Download as PDF, PPTX
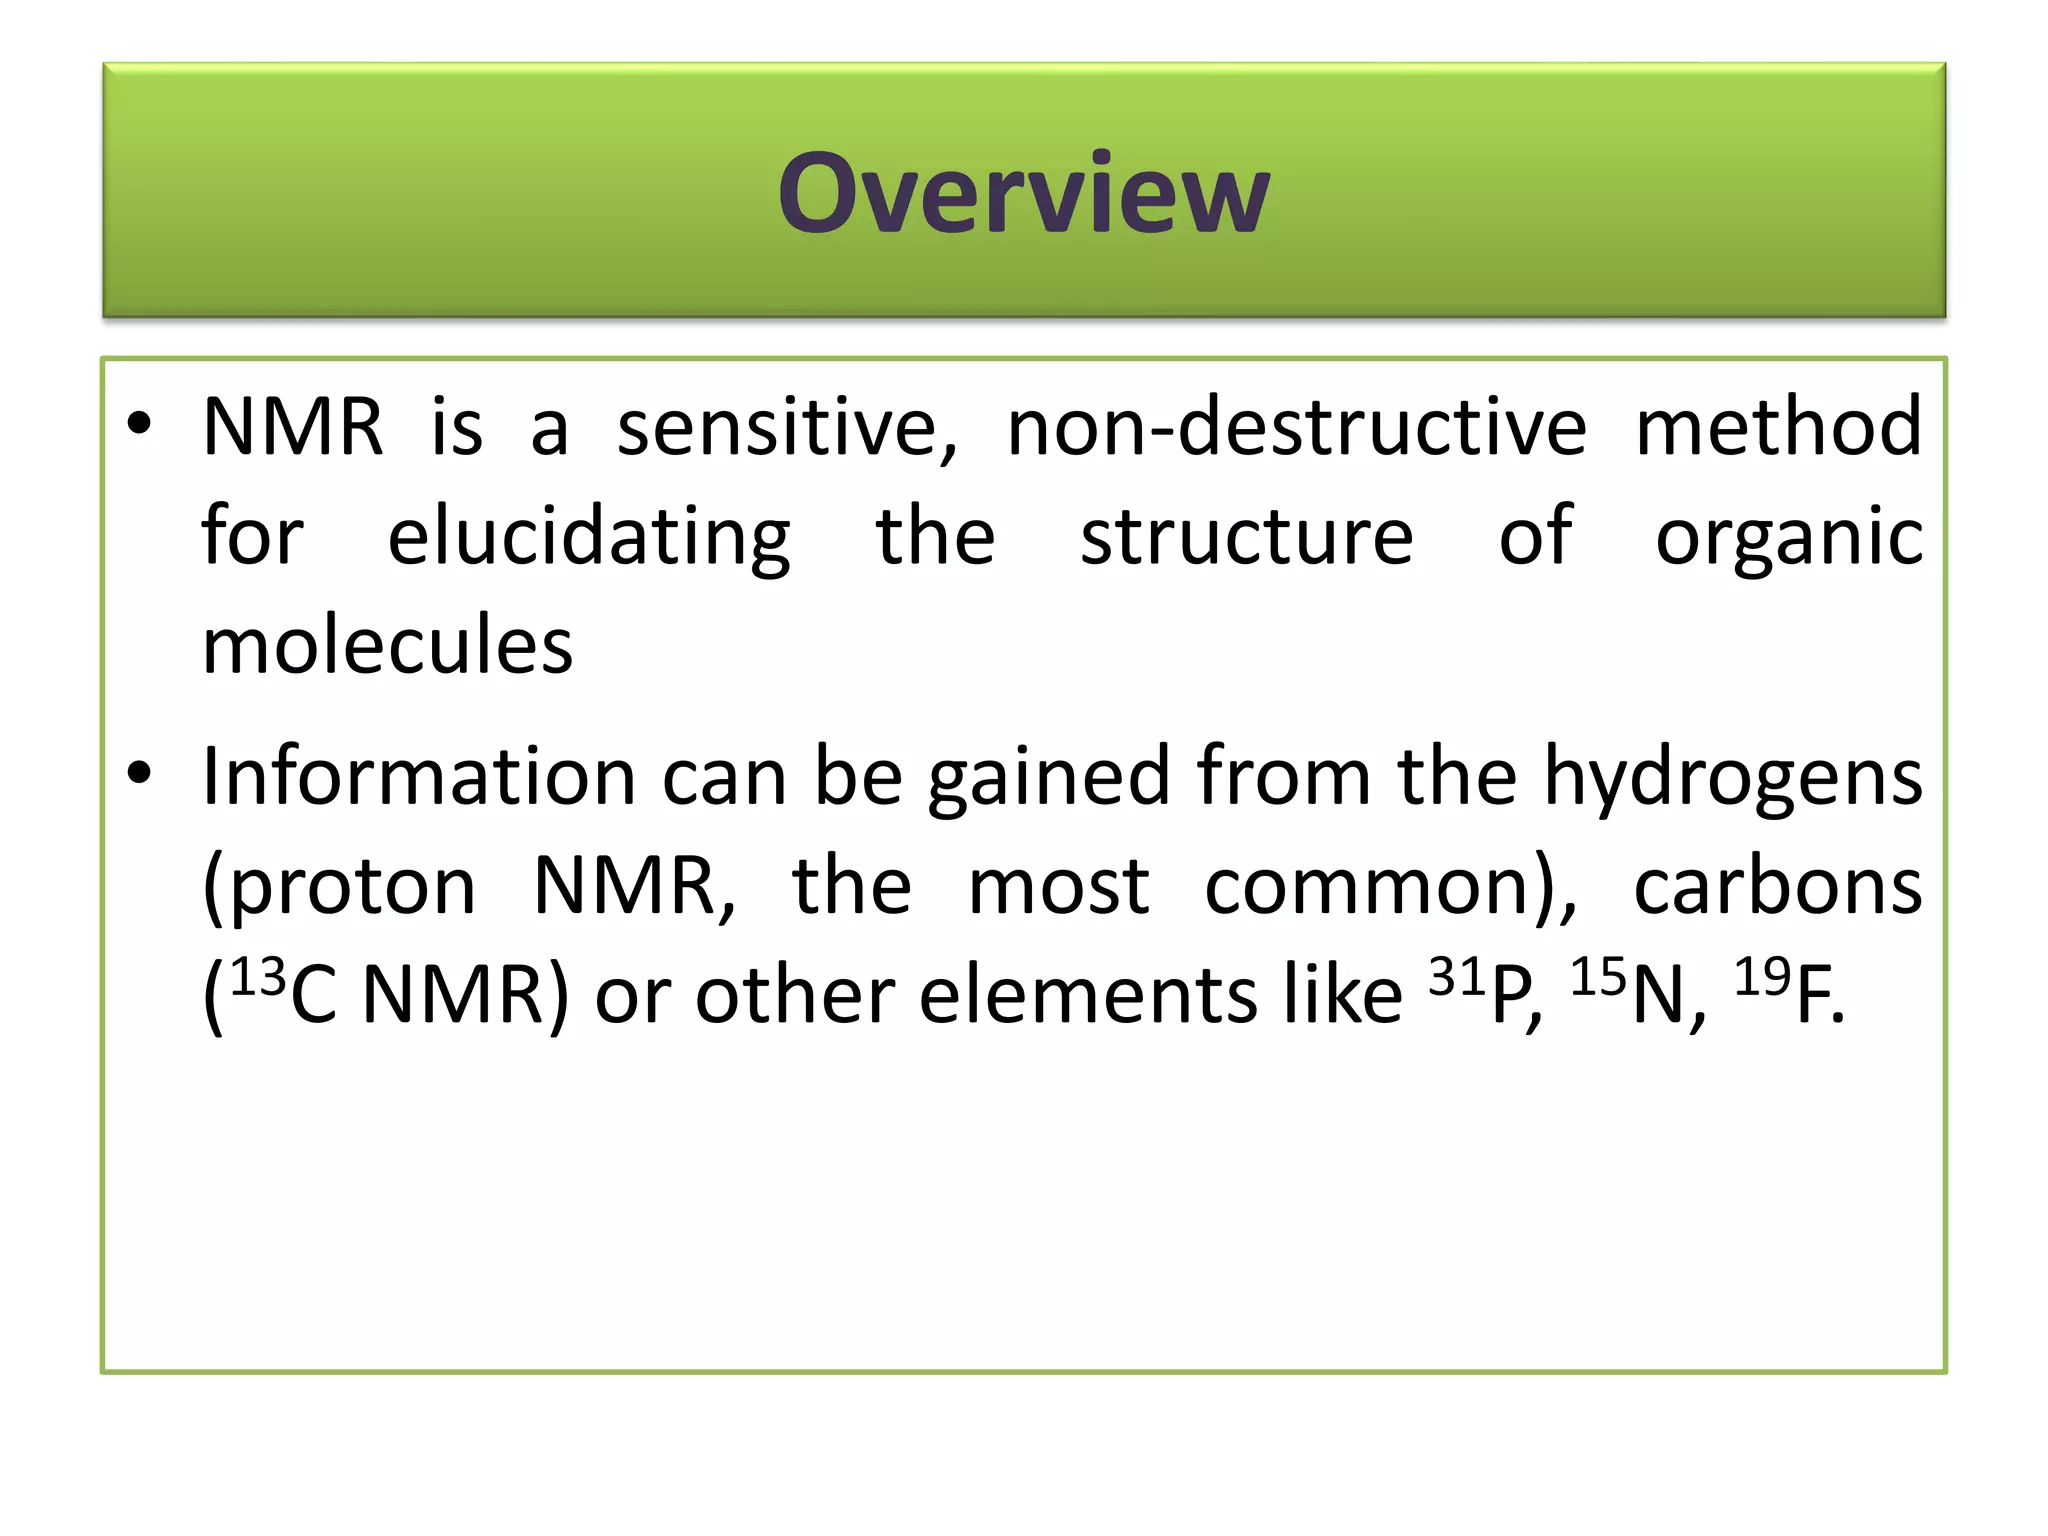


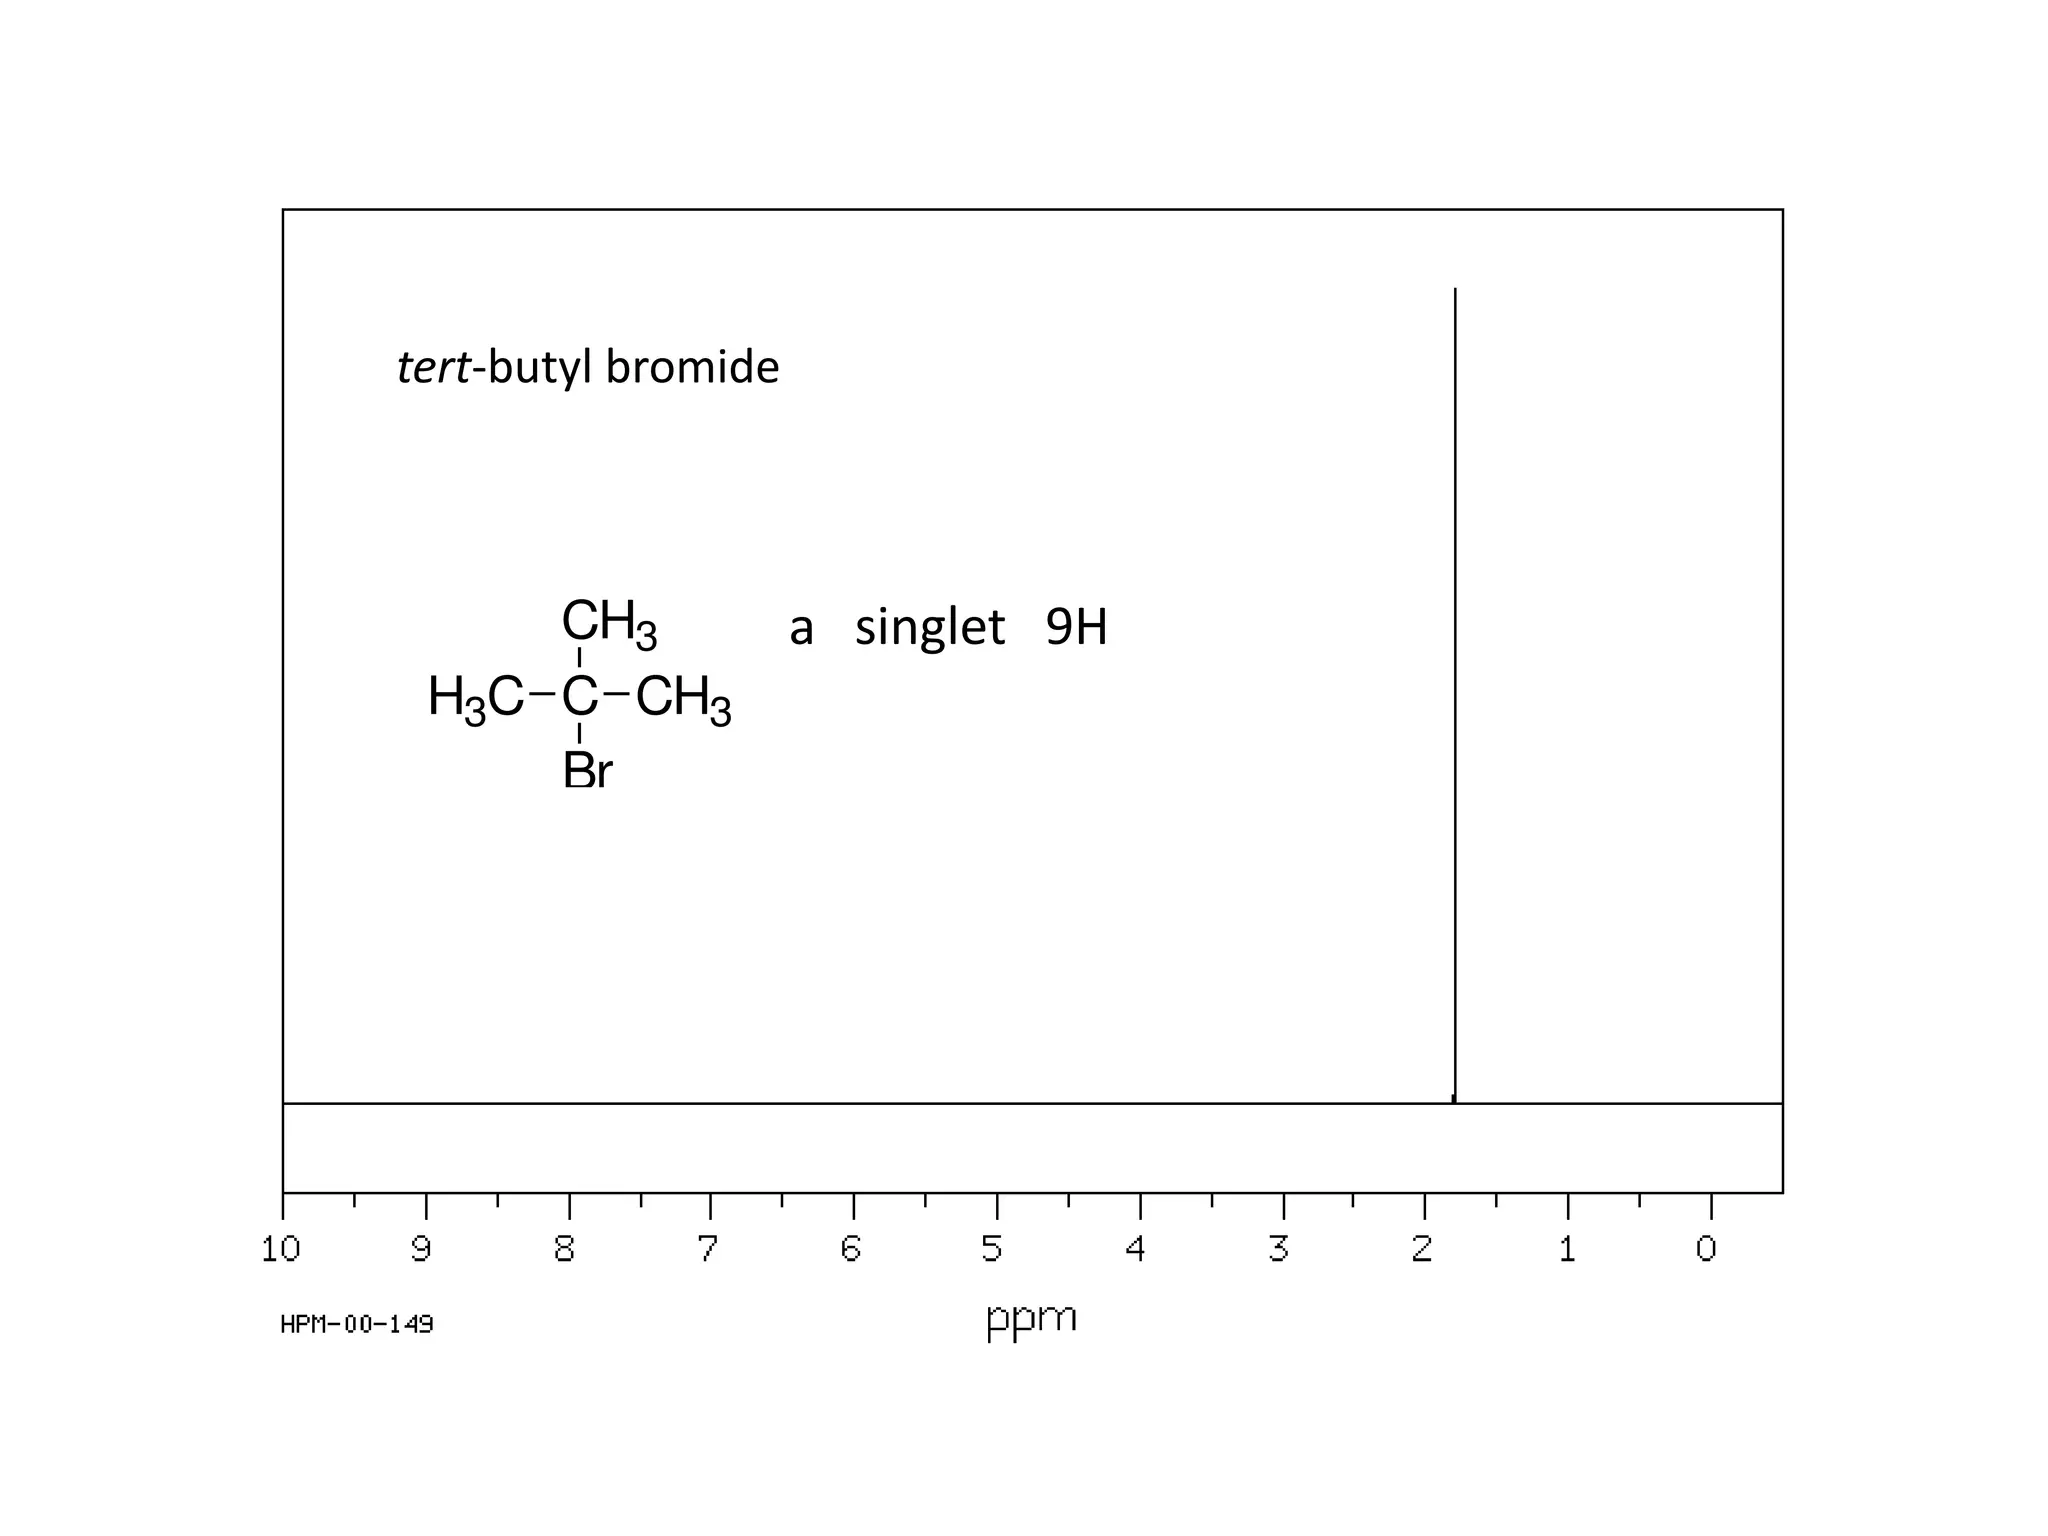
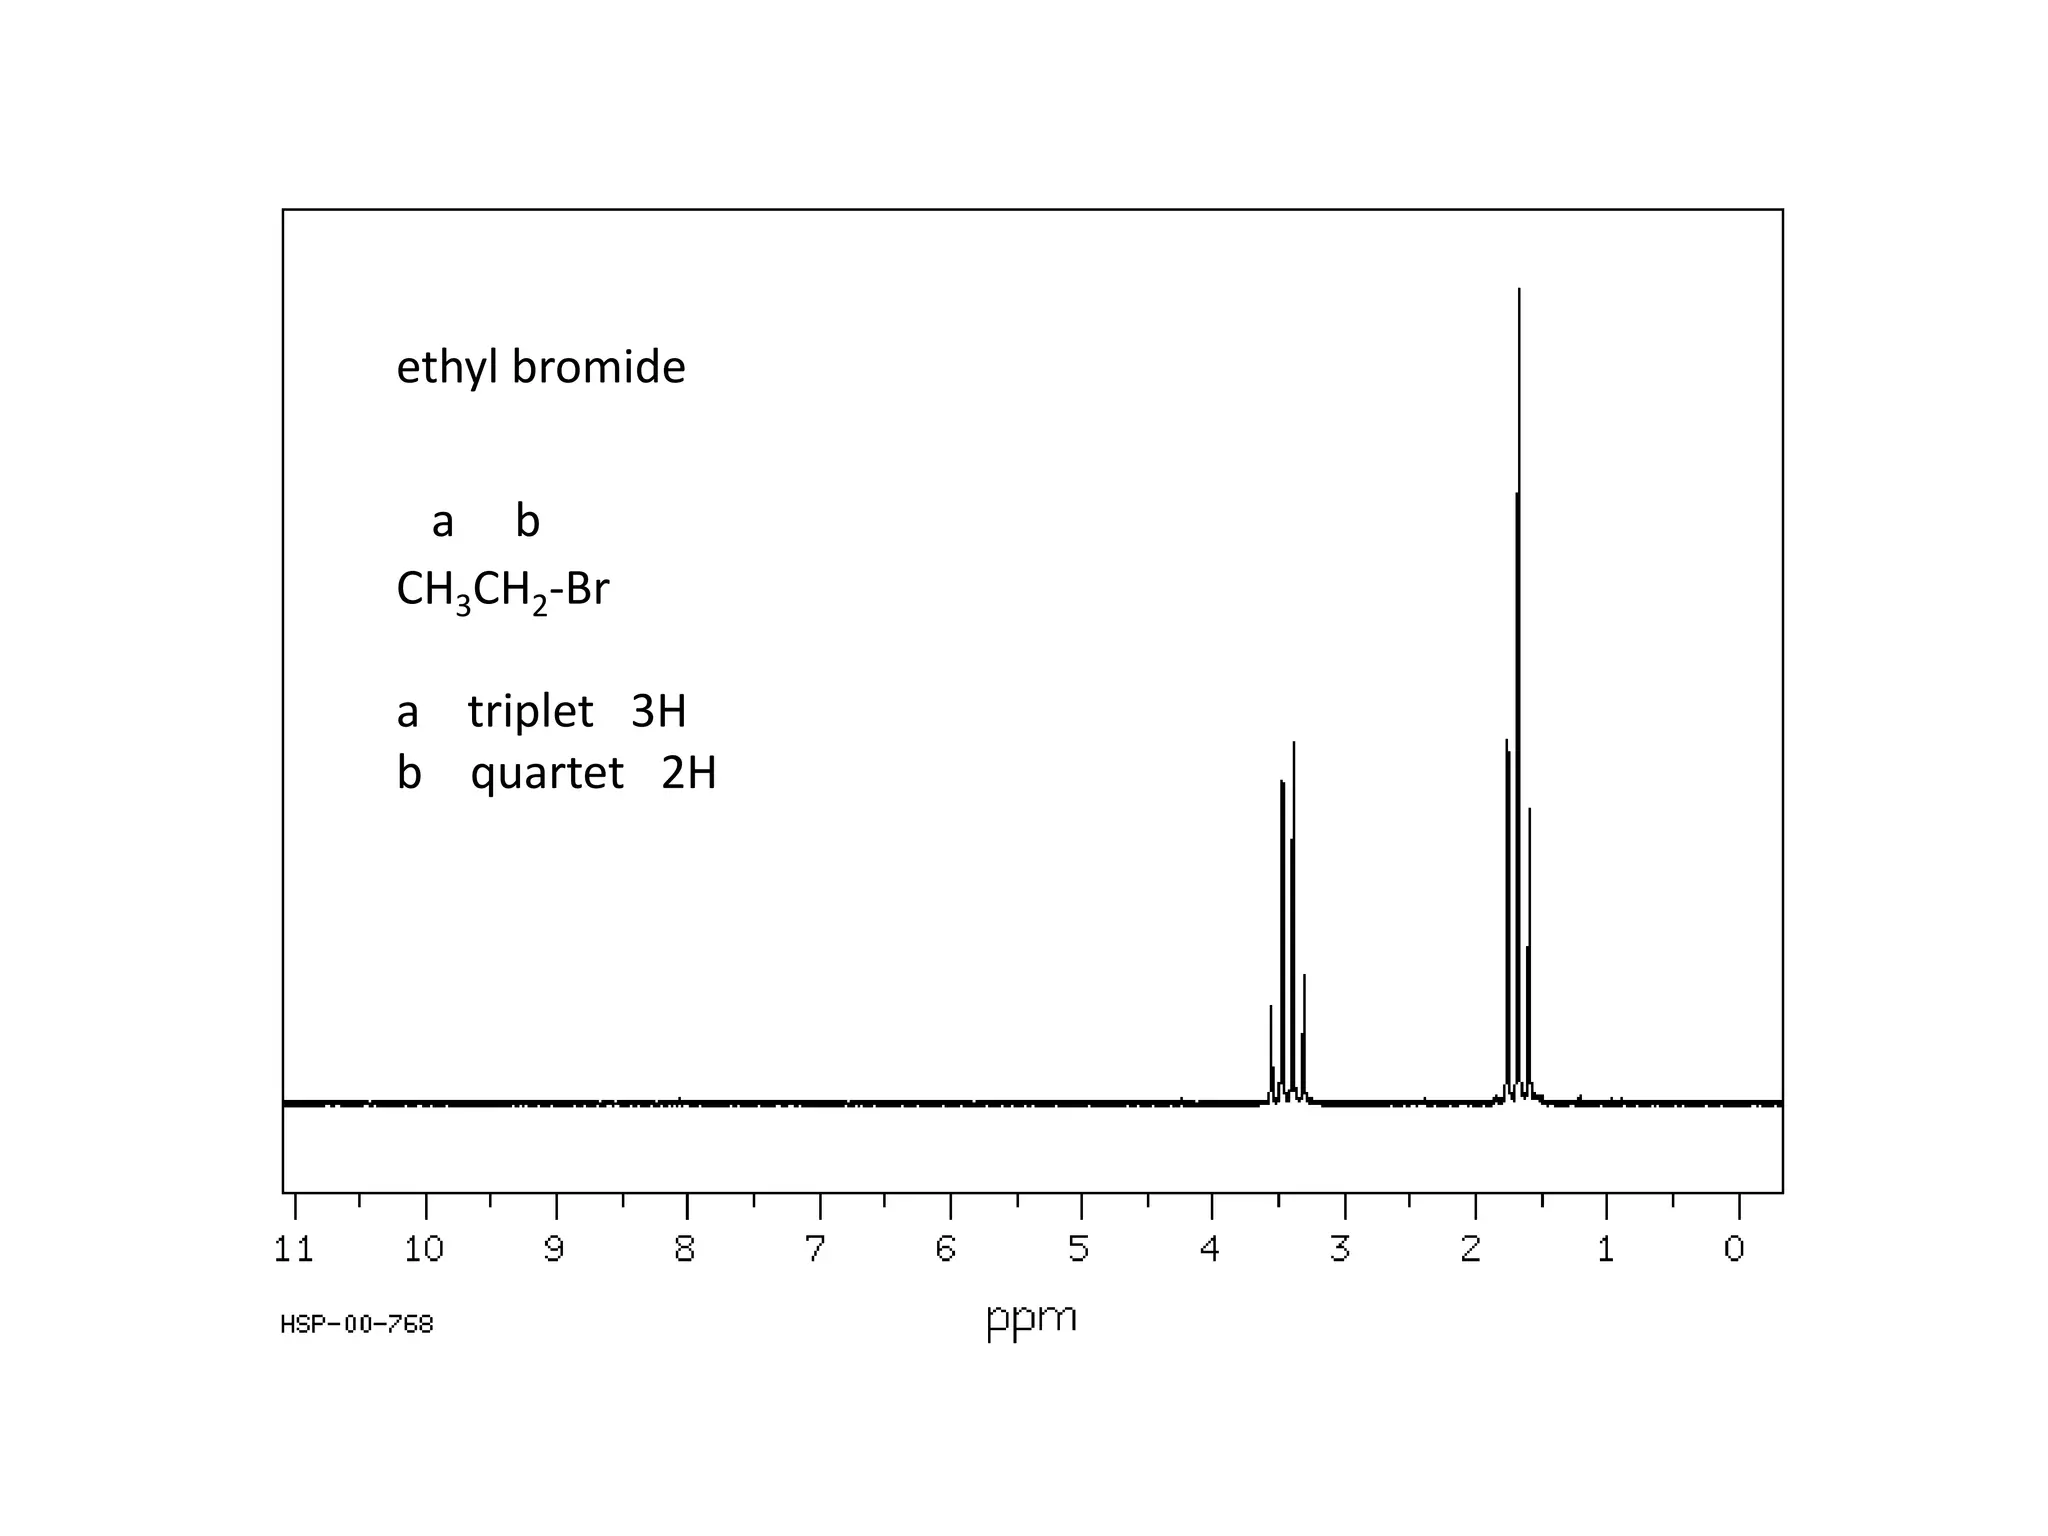
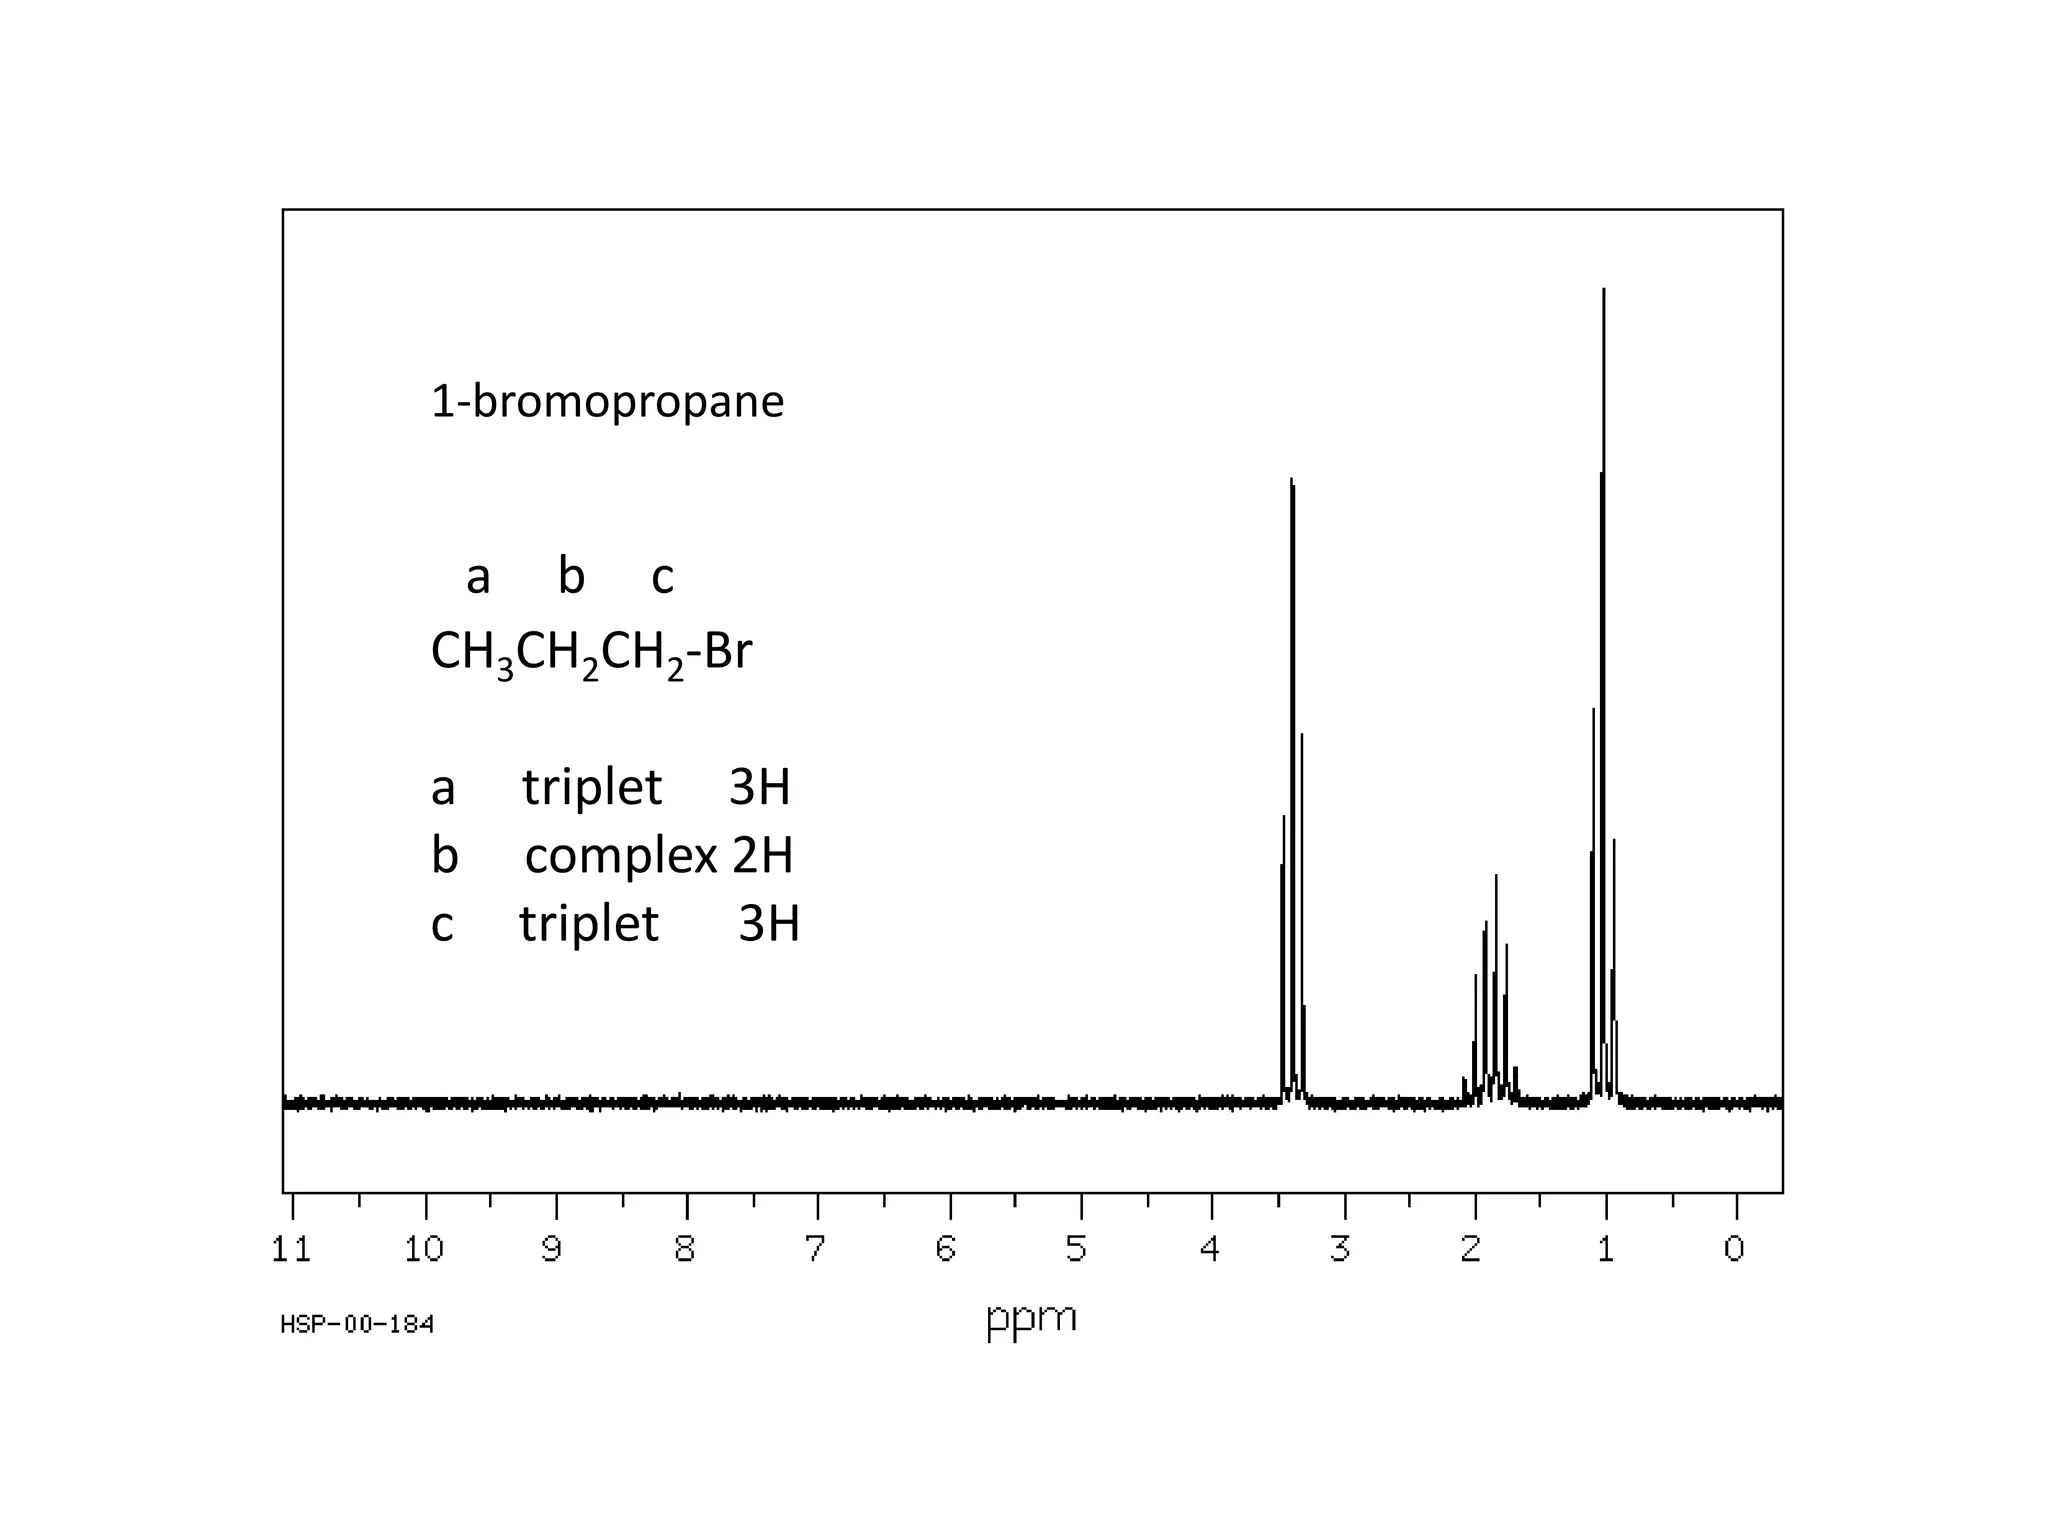
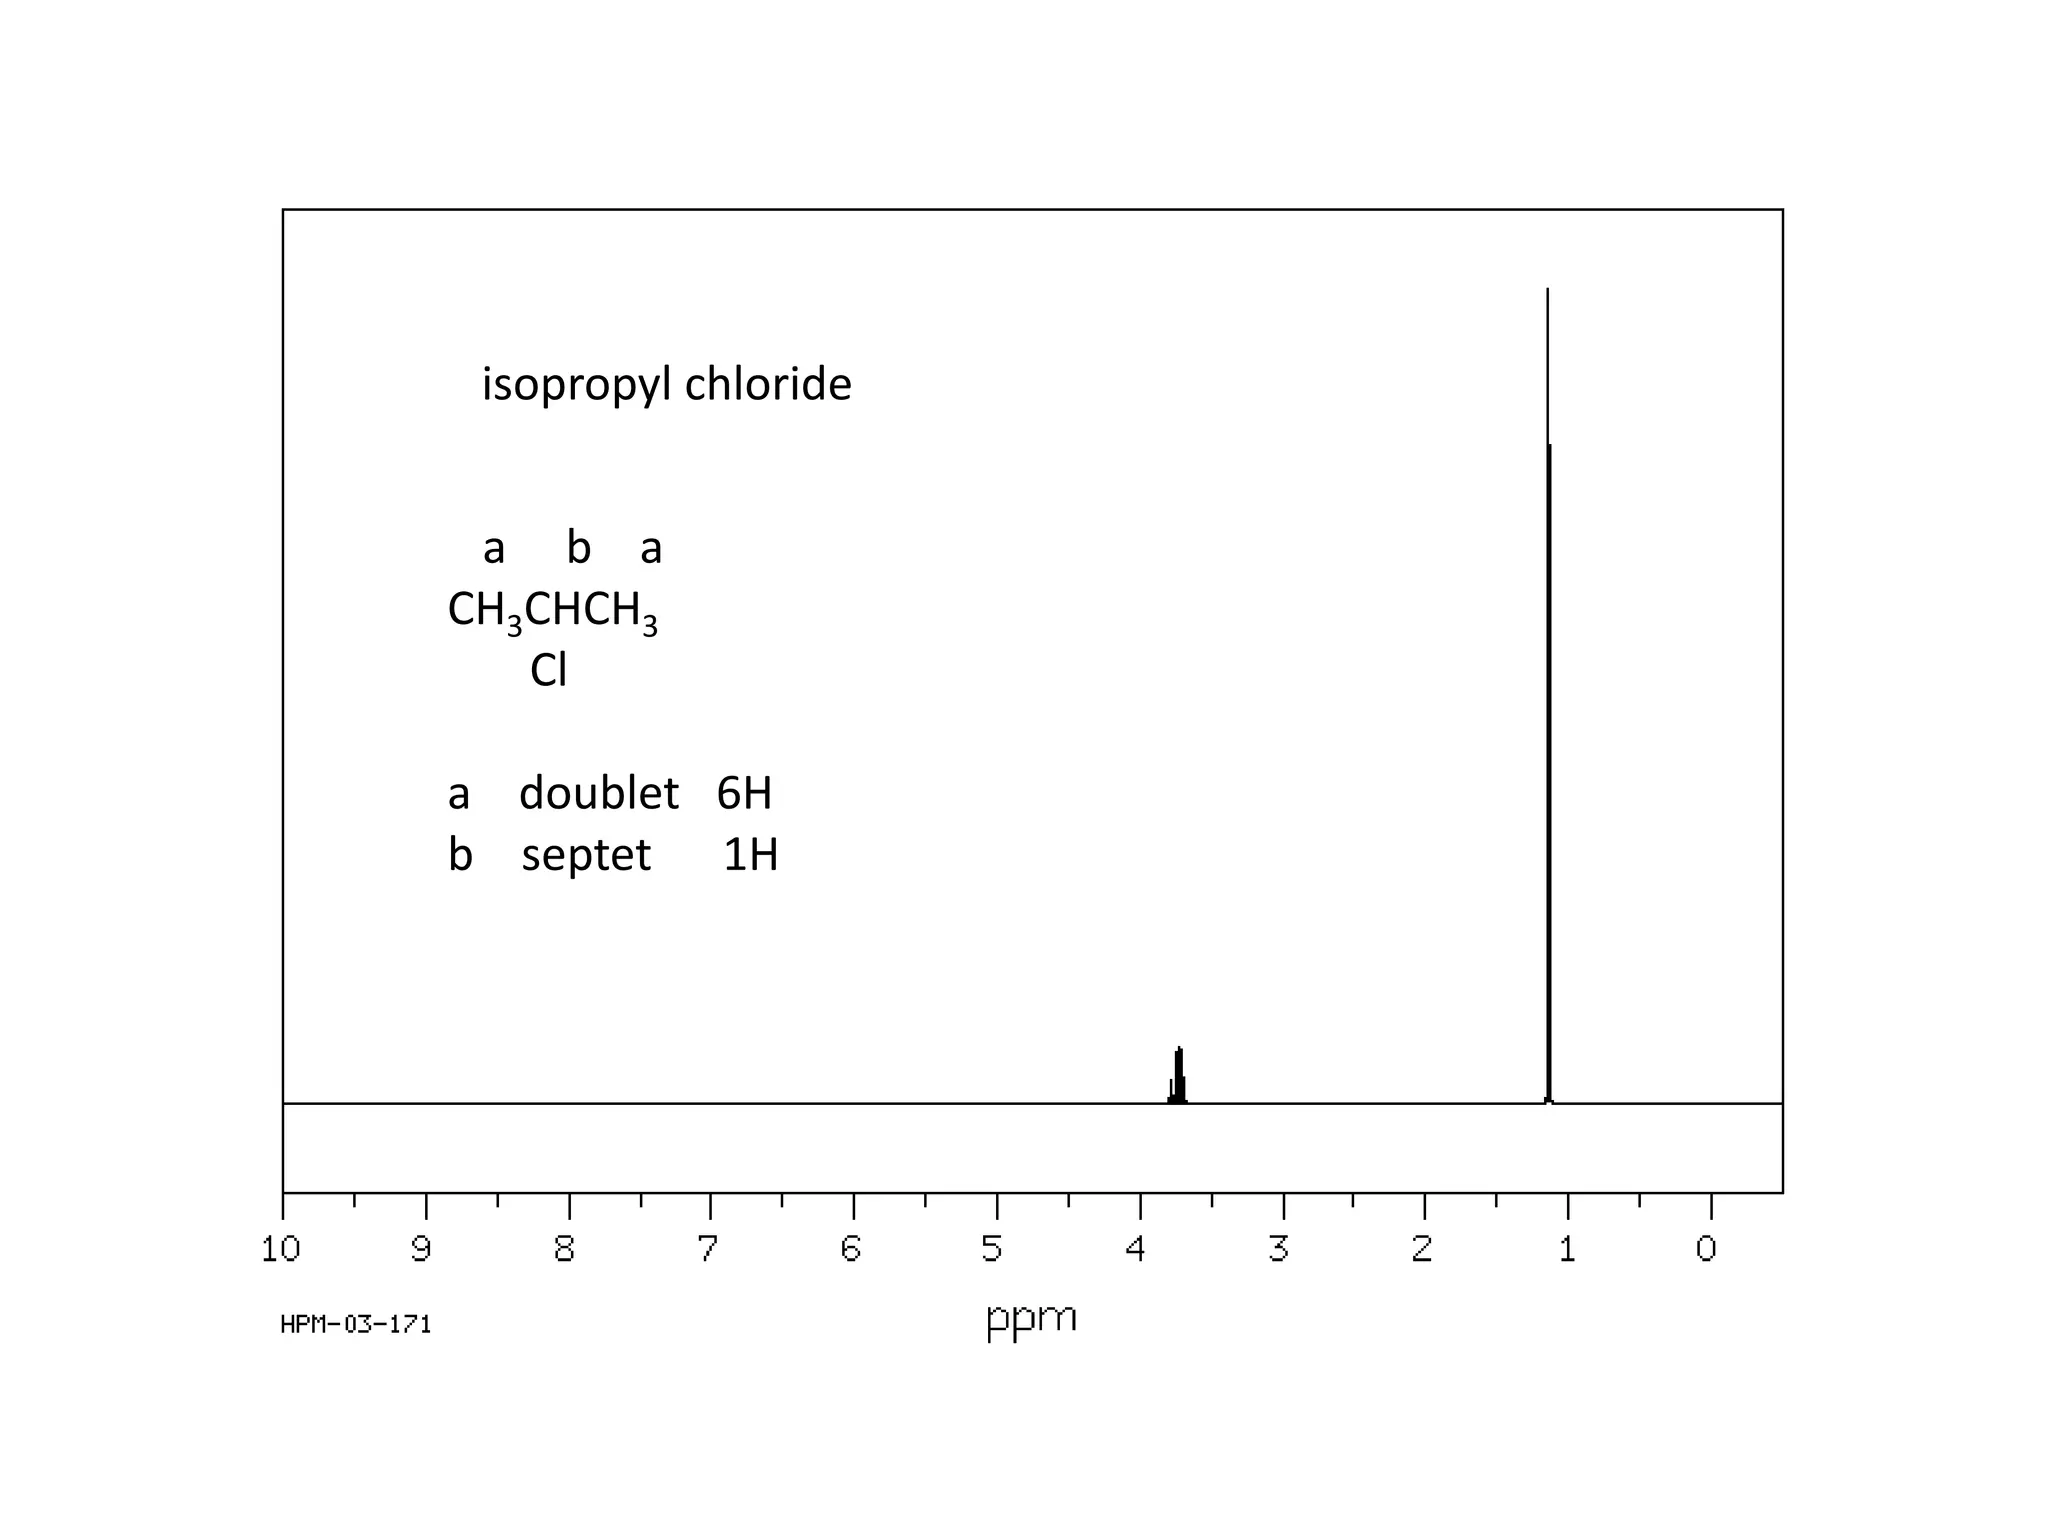
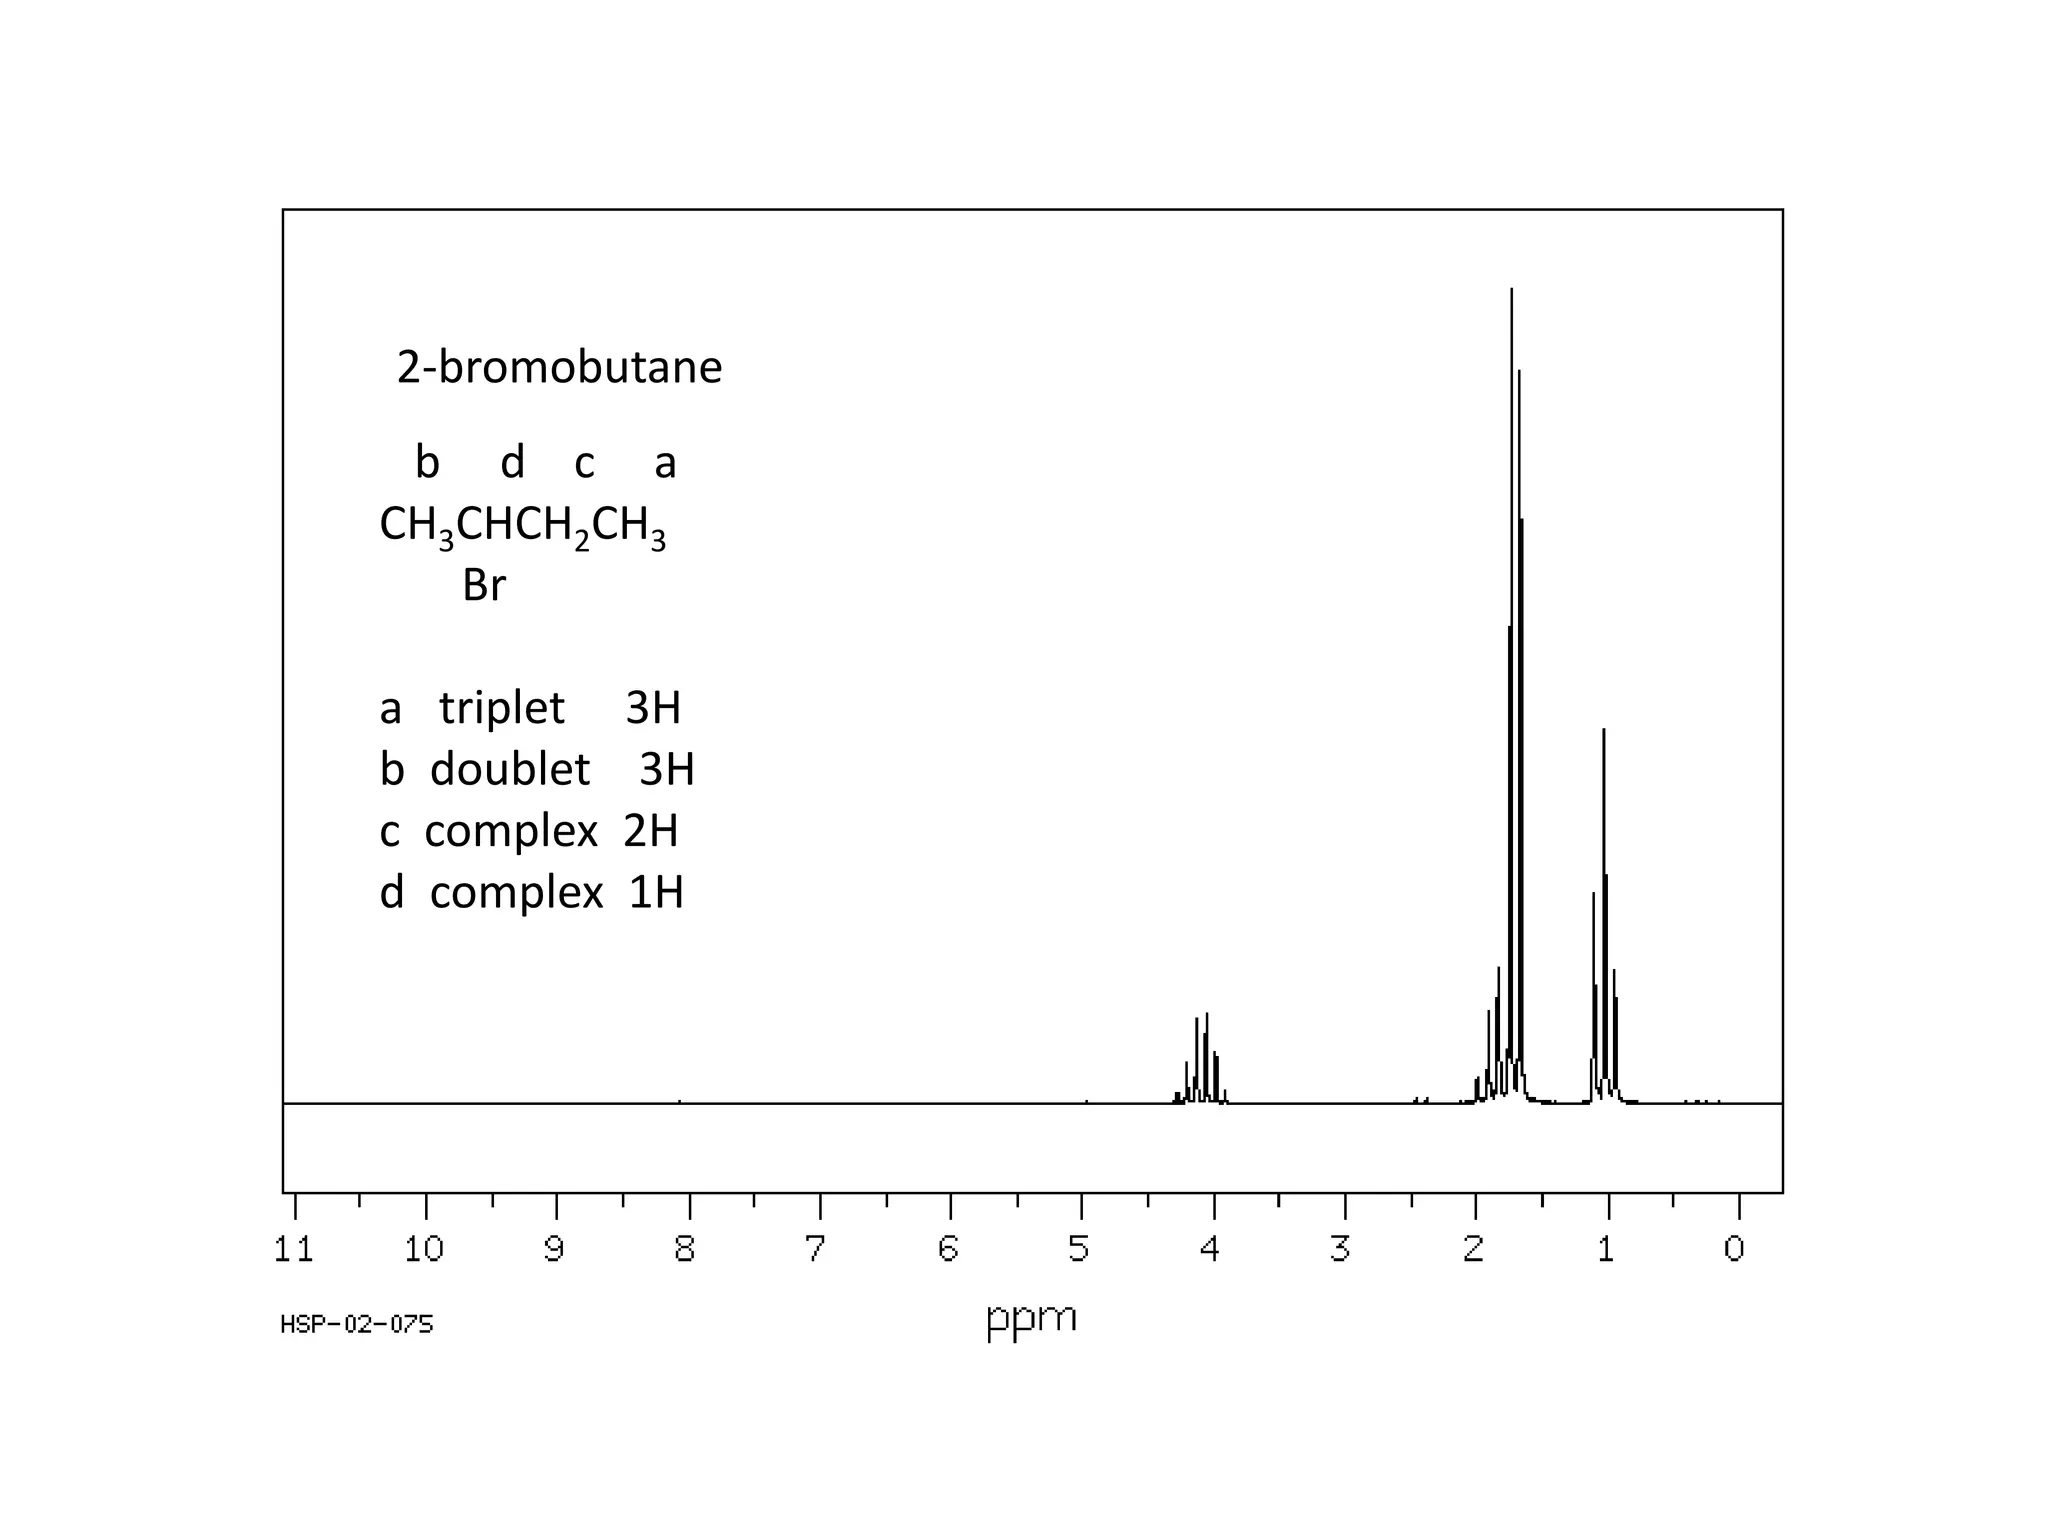
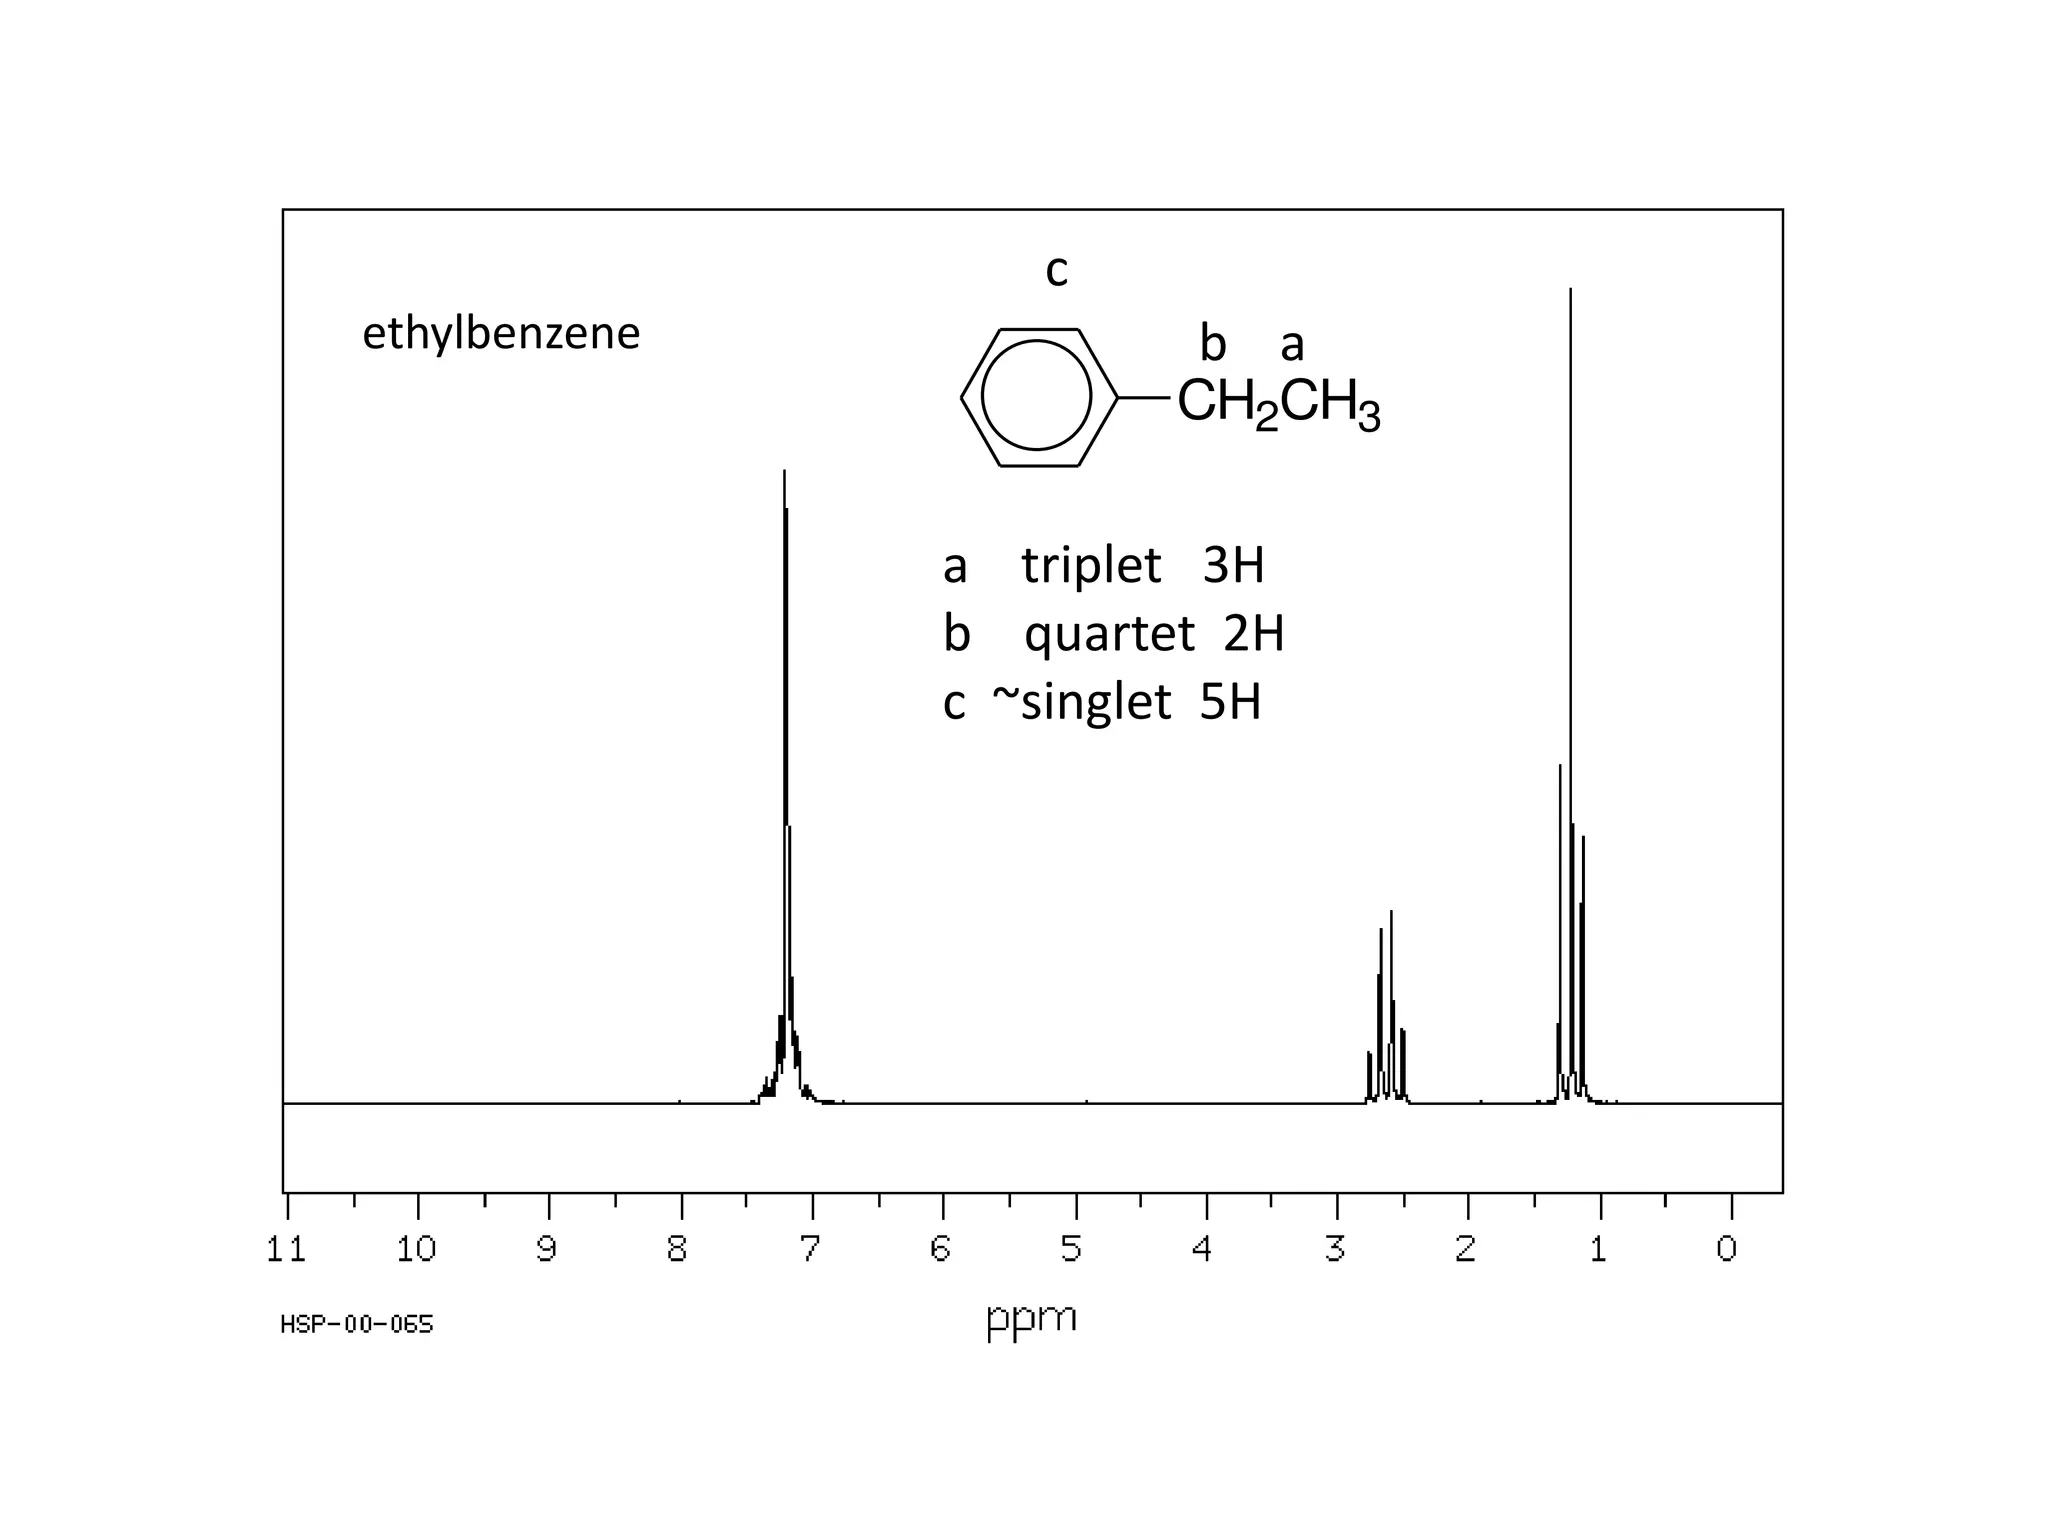
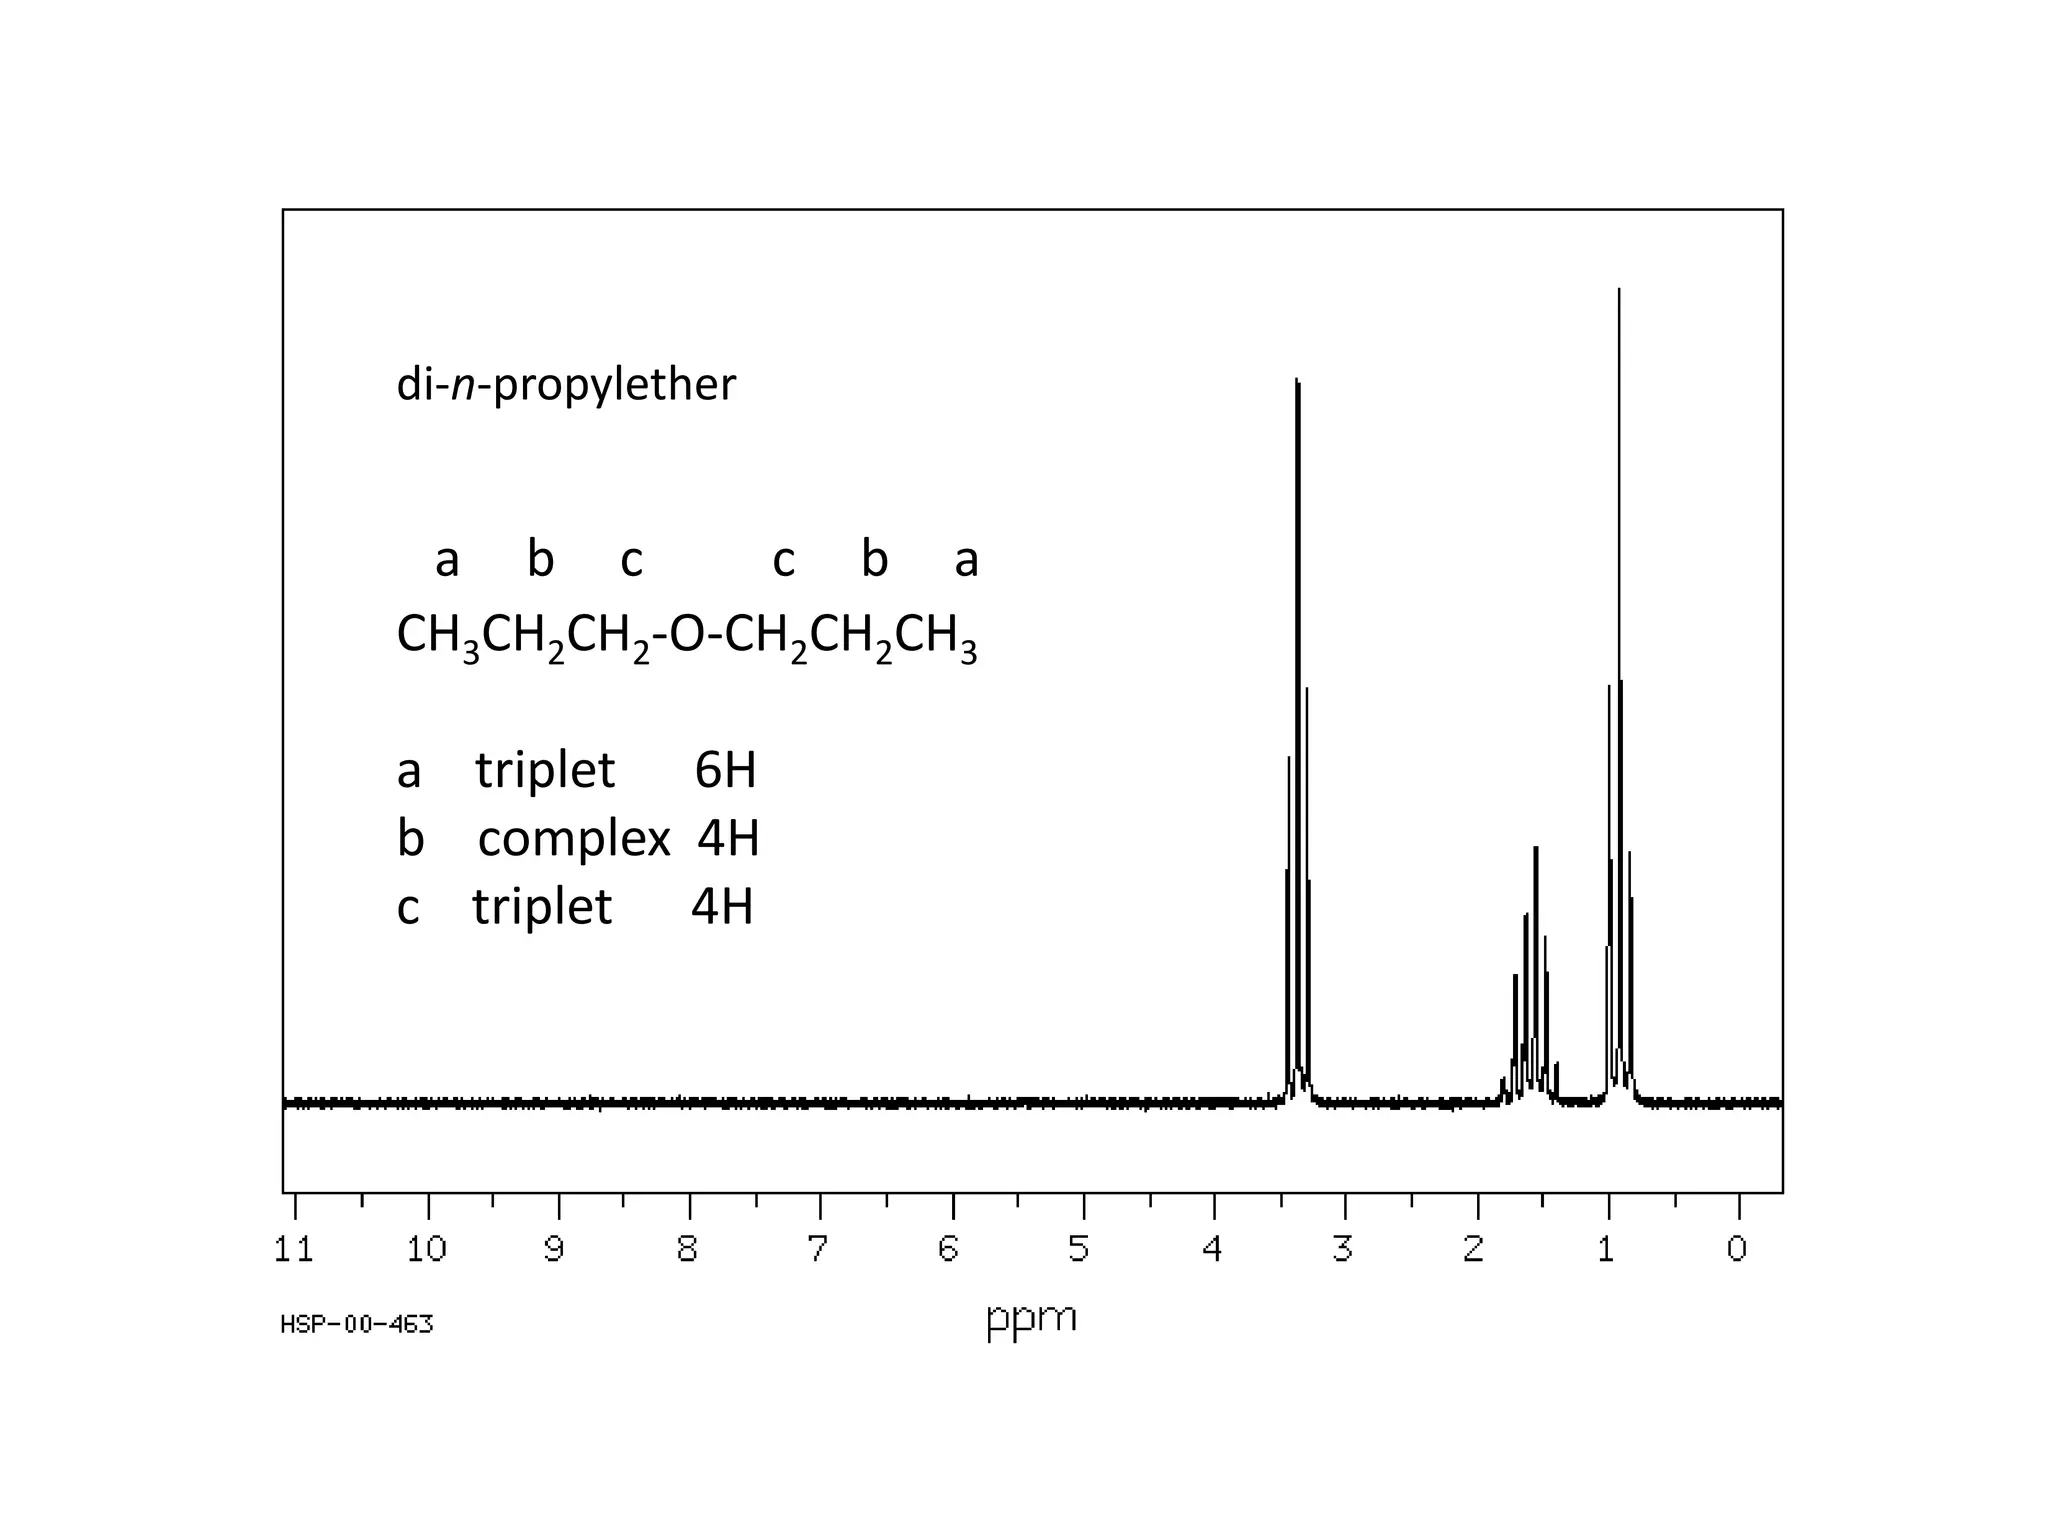
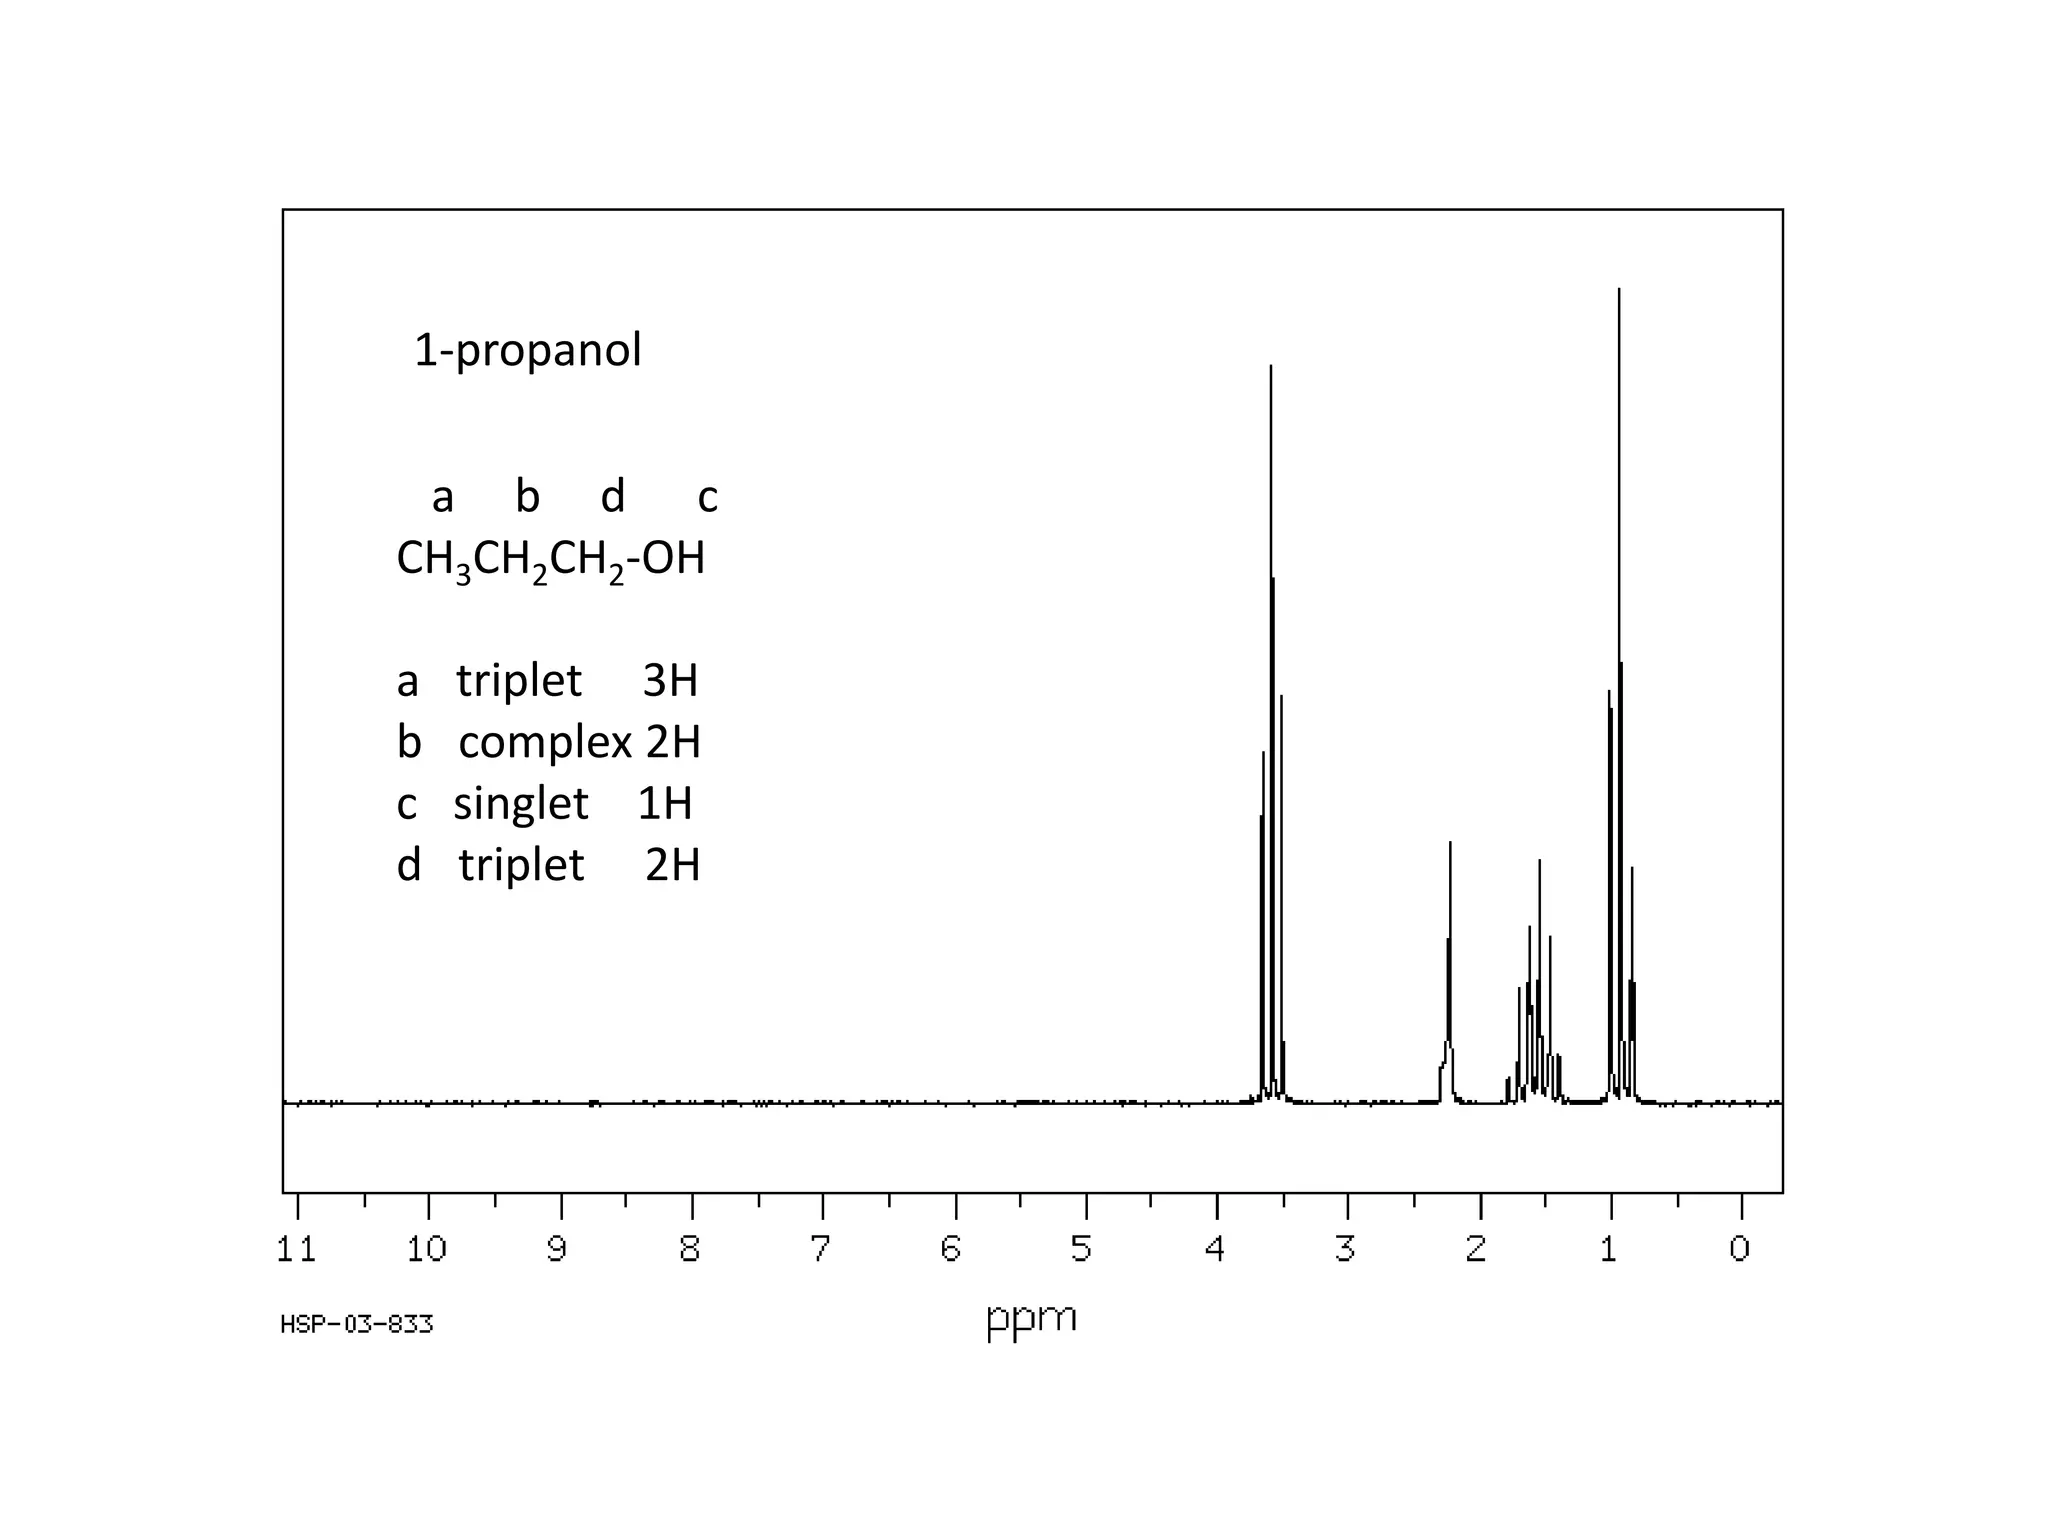


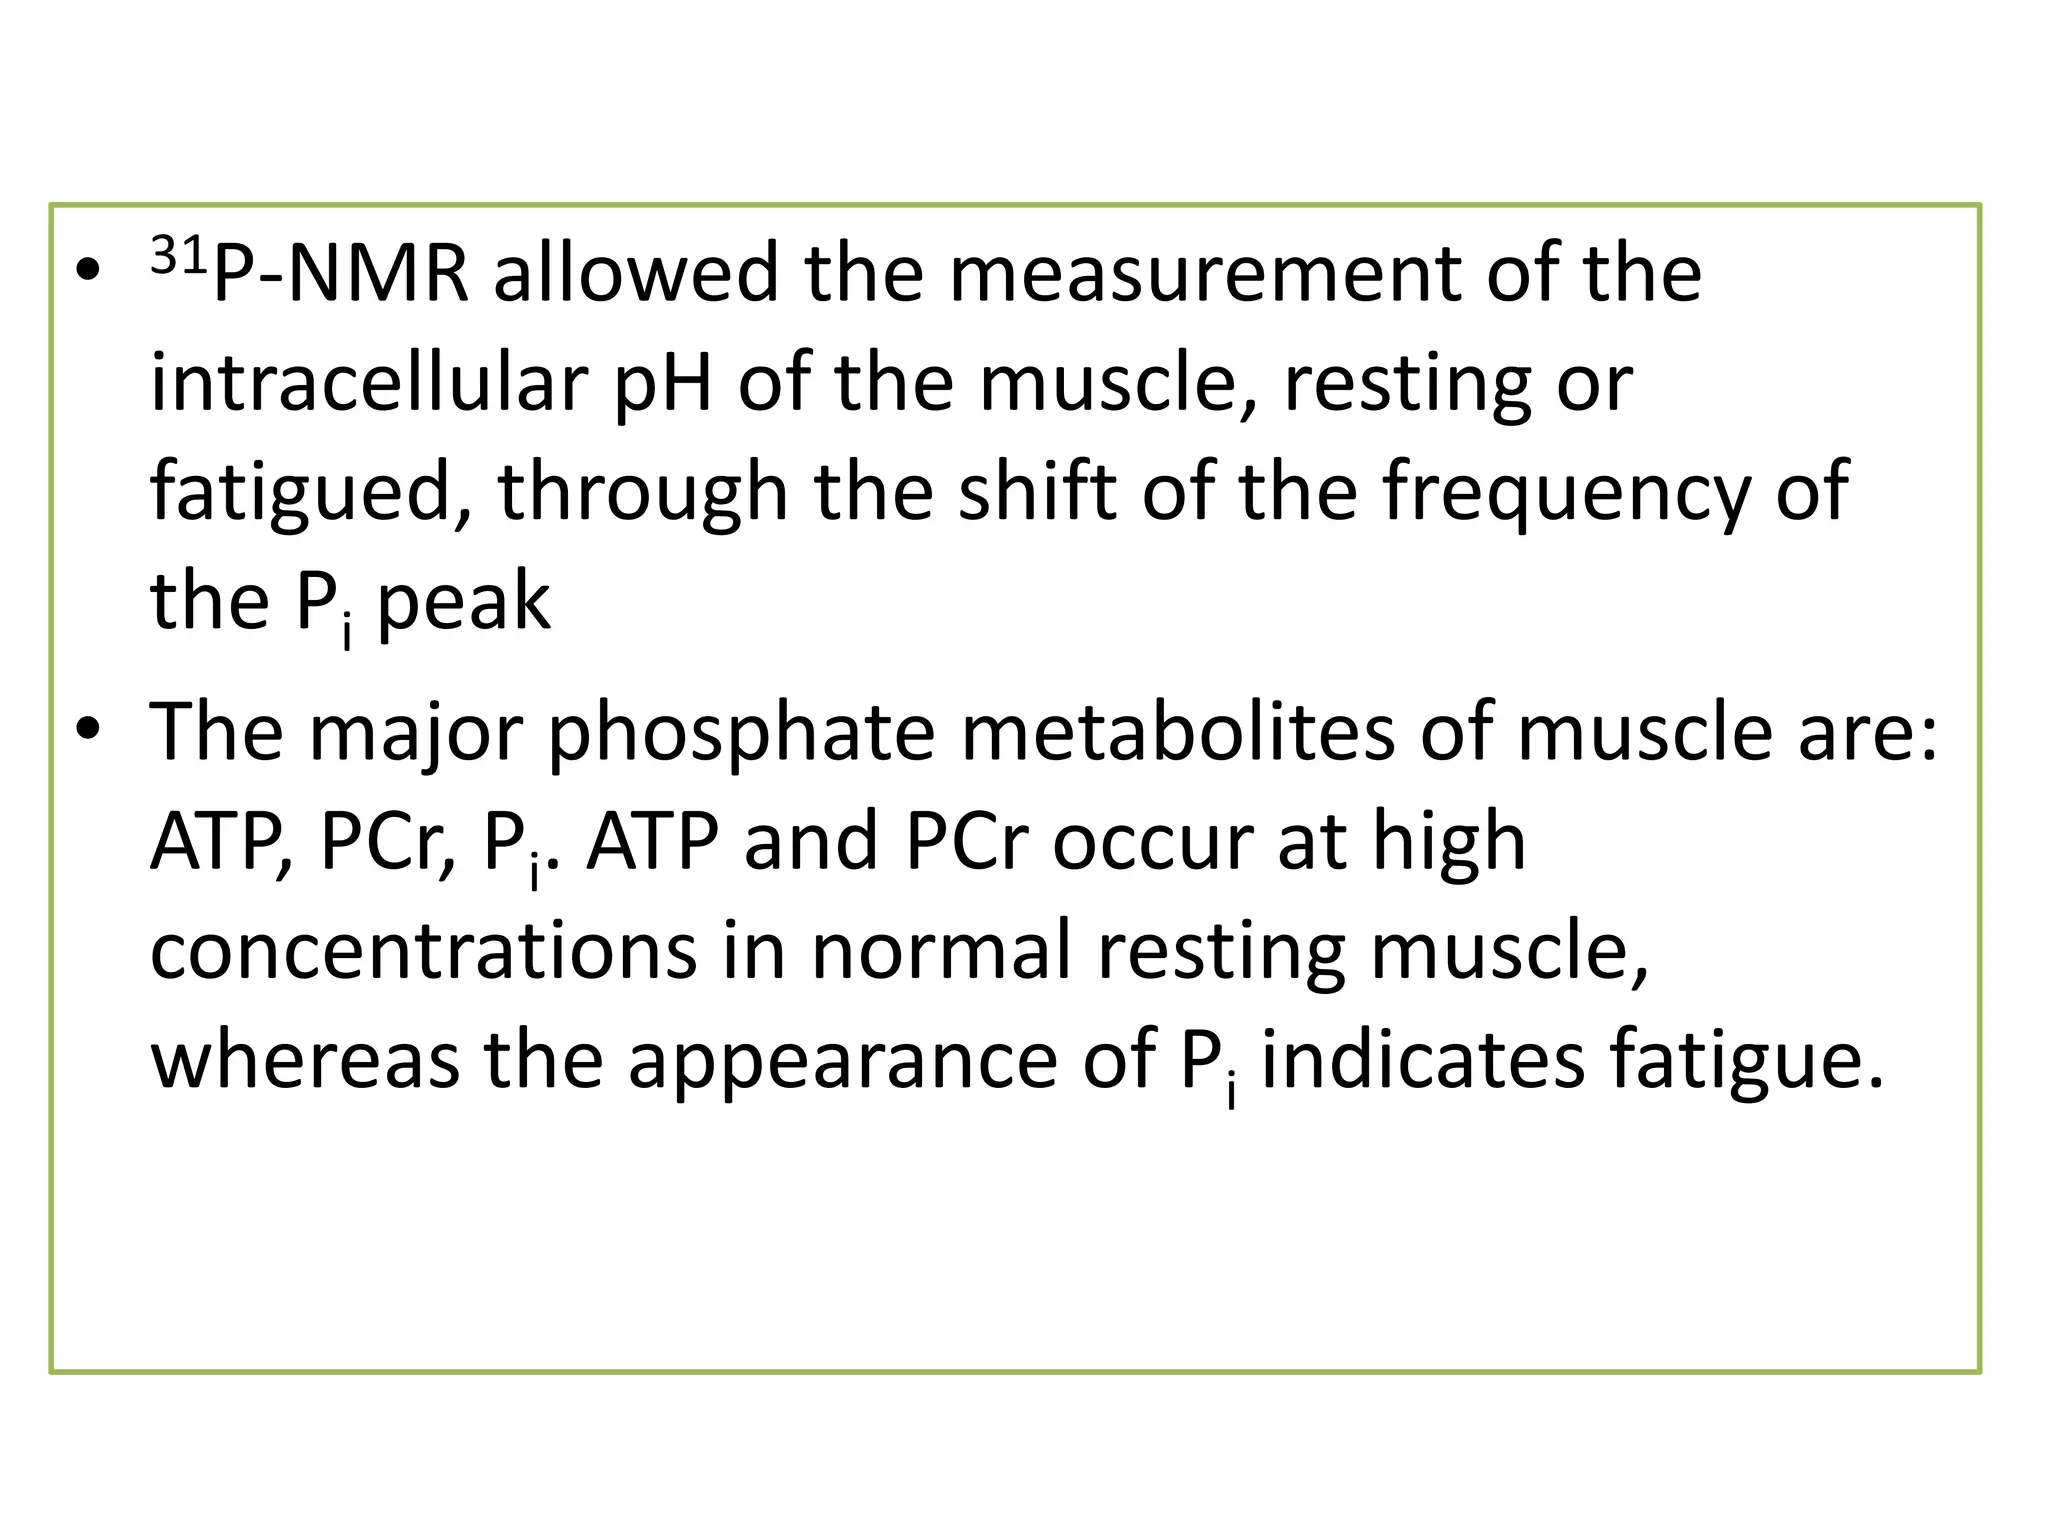
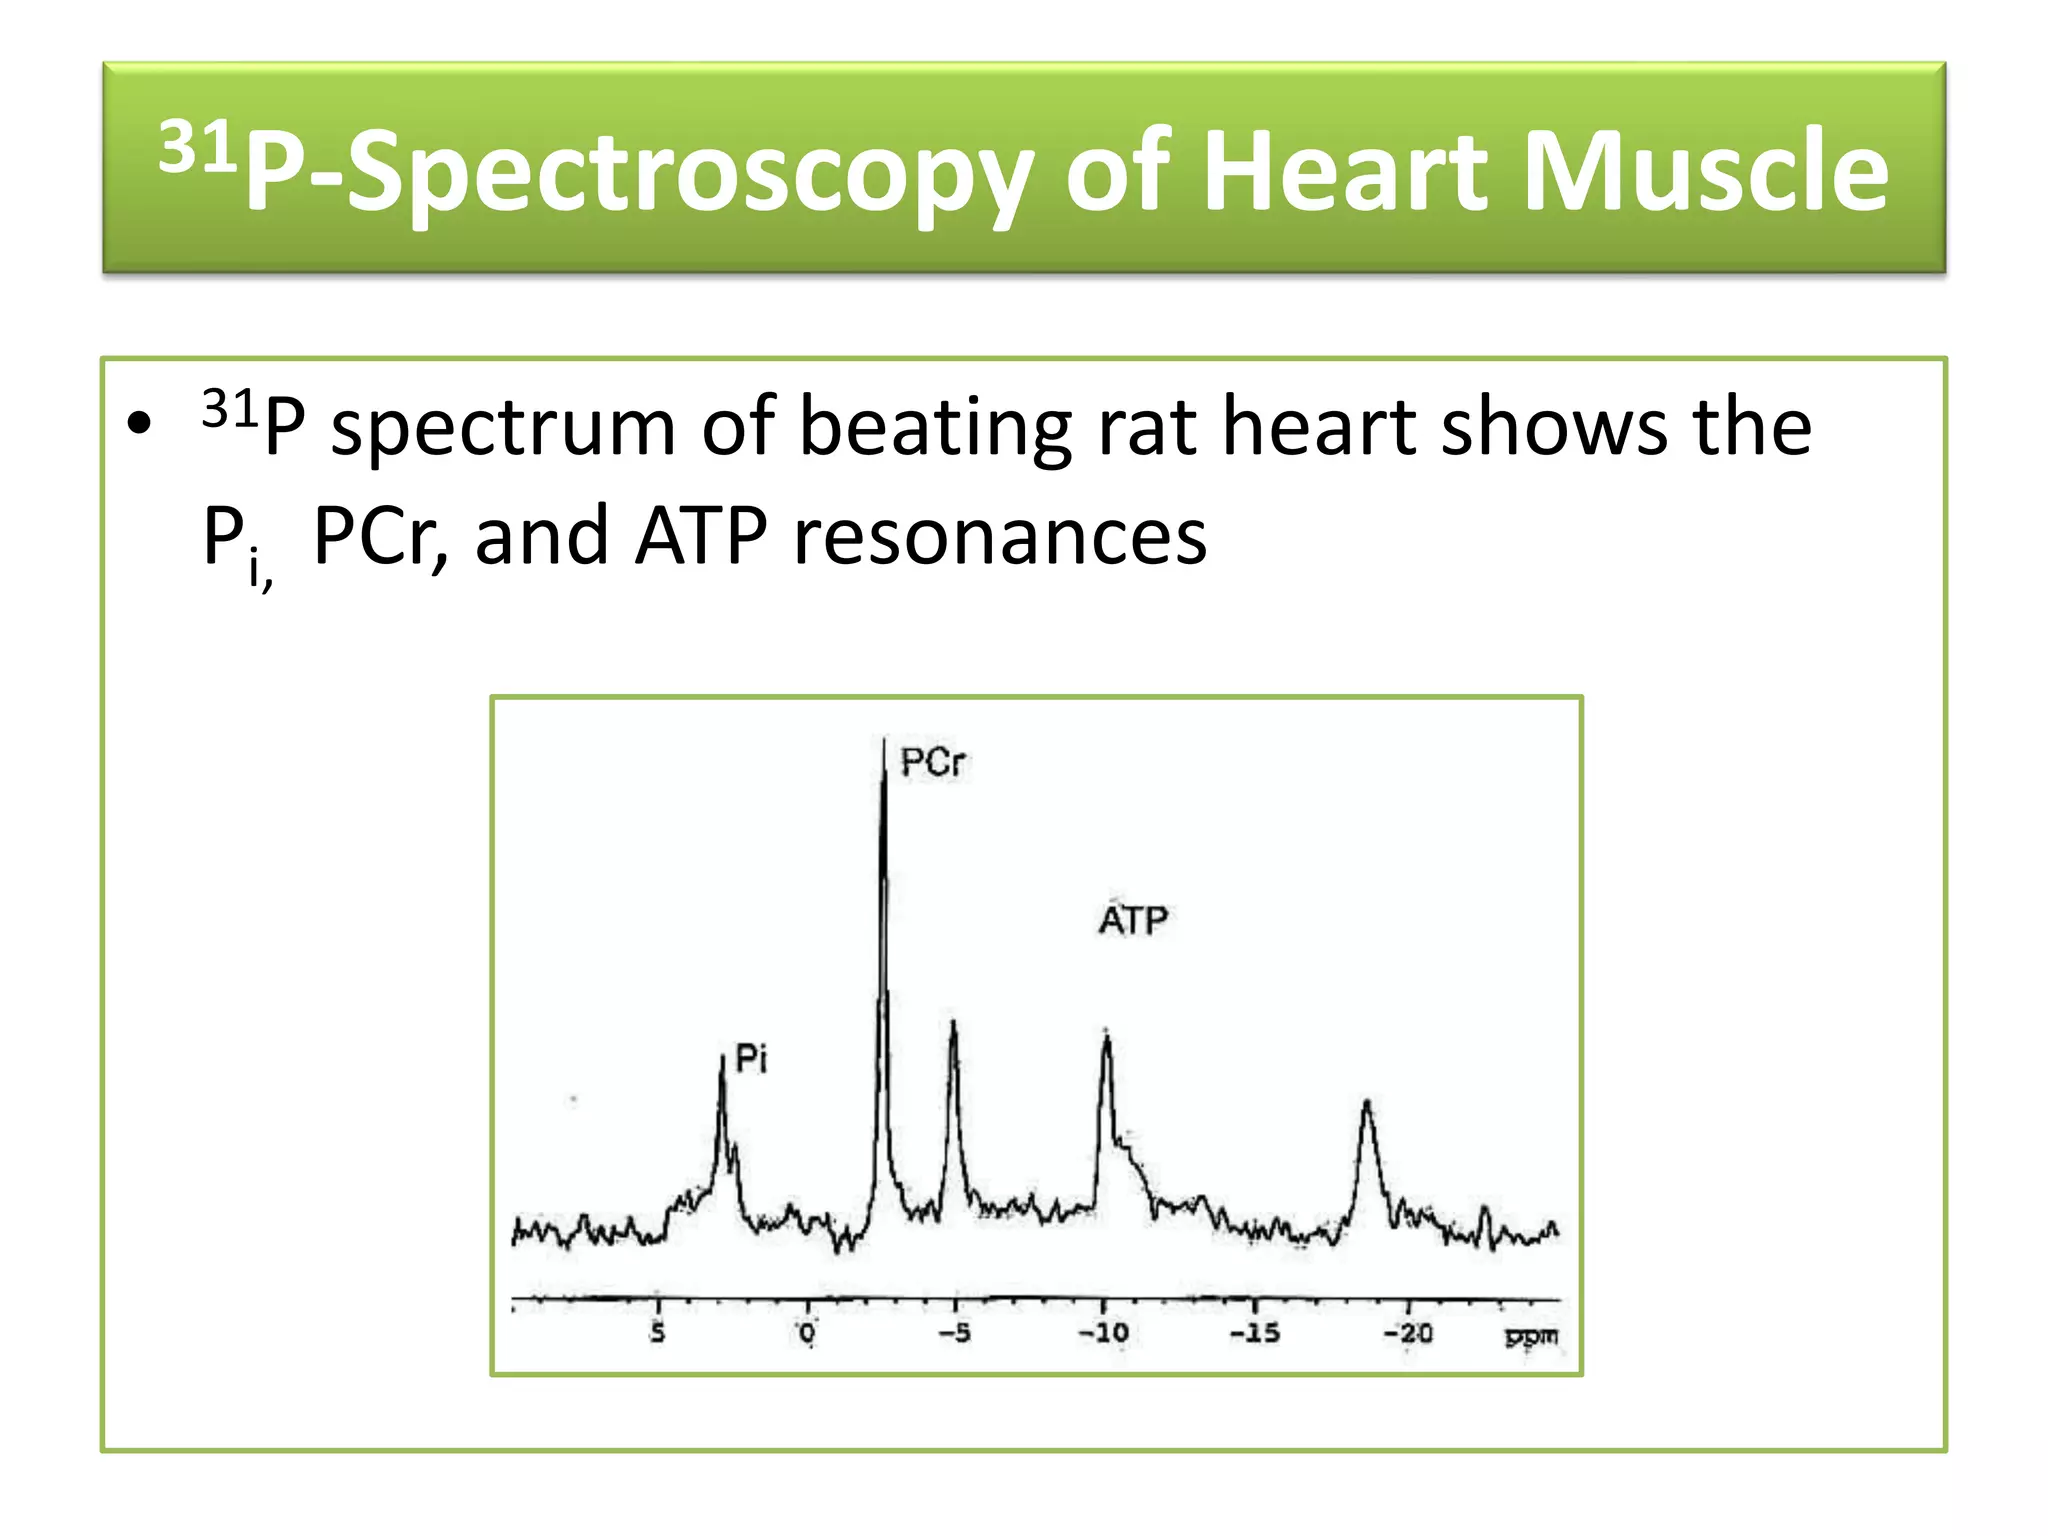


NMR spectroscopy can be used to elucidate the structure of organic molecules. Two-dimensional NMR techniques like COSY simplify complex 1D NMR spectra and provide information about proton-proton couplings in a molecule. This allows researchers to determine connectivity between protons and fully characterize molecular structures. 31P NMR spectroscopy is also useful for studying biological molecules like ATP, PCr, and Pi in muscle tissue and can provide insights into processes like fatigue.


![Noesy [autosaved]](https://cdn.slidesharecdn.com/ss_thumbnails/noesyautosaved-200728183752-thumbnail.jpg?width=640&height=640&fit=bounds)


