Download to read offline

![0
500
1000
1500
2000
2500
3000
3500
0
1000000
2000000
3000000
4000000
5000000
6000000
Jan-2011
Sep-2011
May-2012
Jan-2013
Sep-2013
May-2014
Jan-2015
Sep-2015
May-2016
Jan-2017
Sep-2017
May-2018
Jan-2019
Sep-2019
May-2020
Jan-2021
P
Load
(kg)
Monthly
Discharge
(m3)
Month
Monthly QP [m3] P Load [kg]
Monthly Discharge at Main PS vs P Loads](https://image.slidesharecdn.com/september1-1030-chandramadramootoo-220914133035-0146de6a/85/September-1-1030-Chandra-Madramootoo-8-320.jpg)
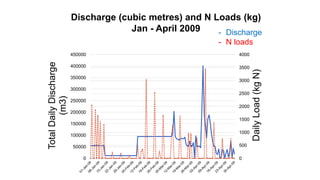
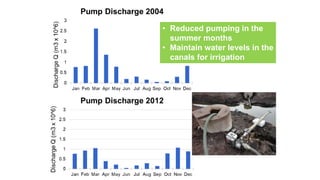
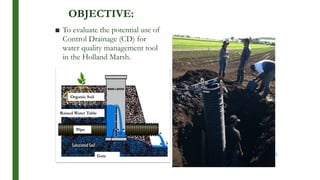
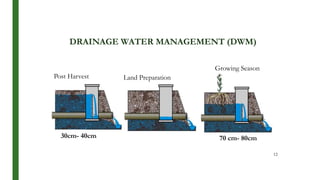
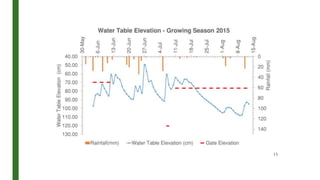
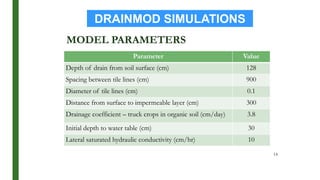
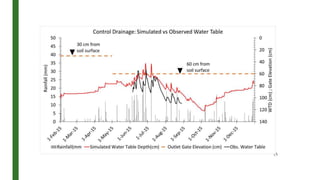
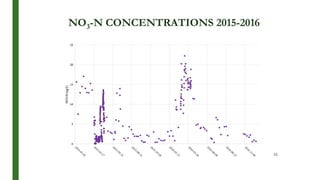
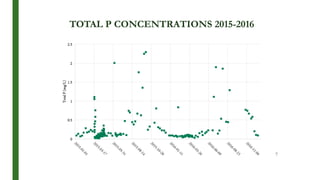
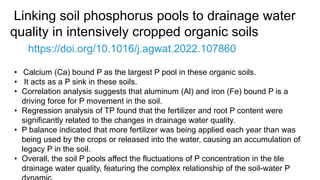

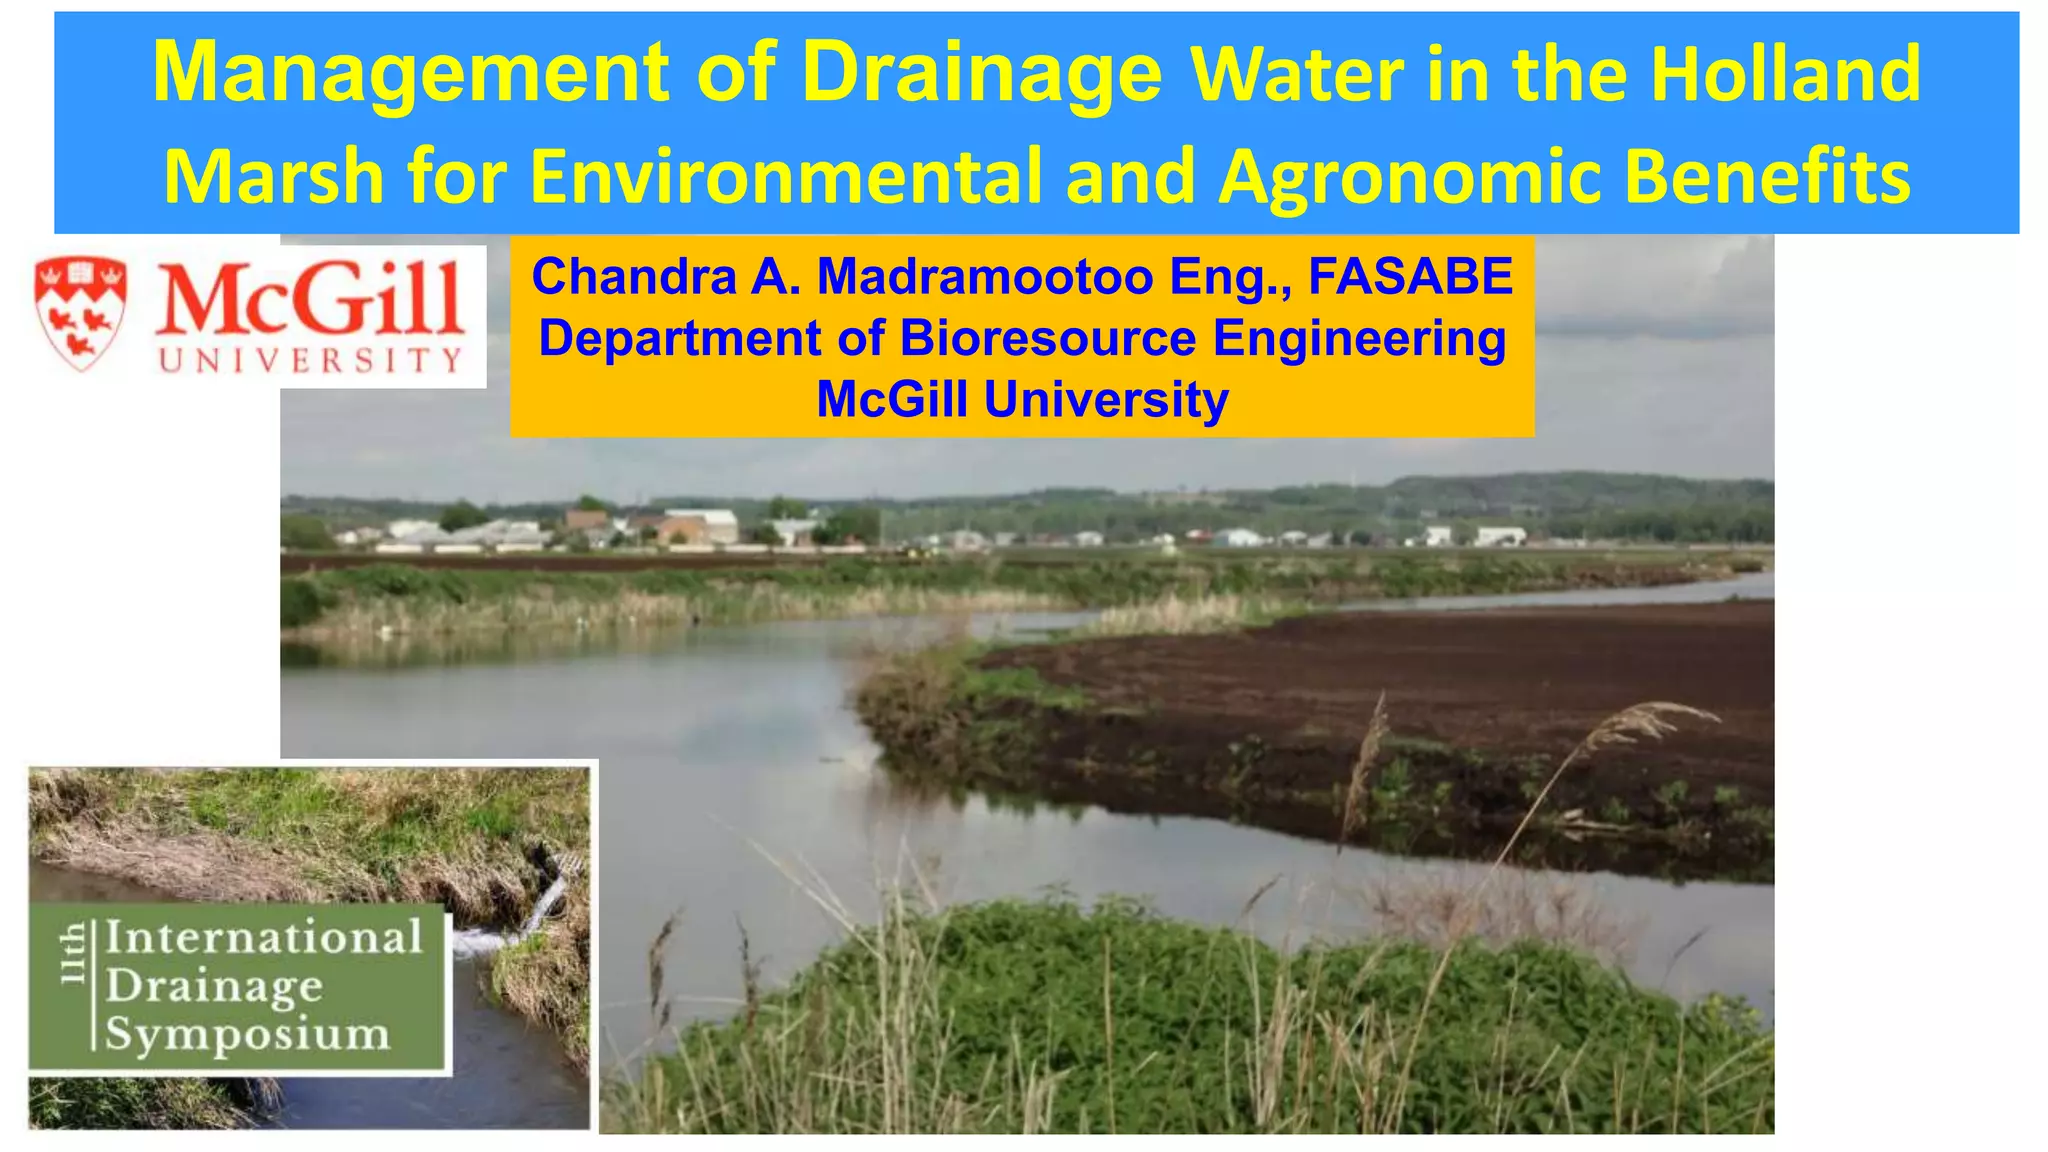
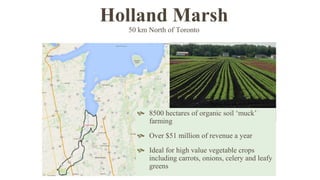
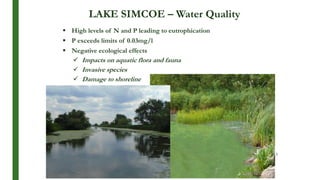
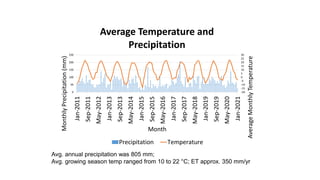
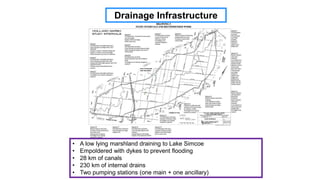
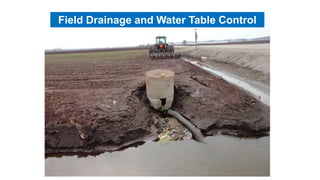
The document summarizes research on managing drainage water in the Holland Marsh region of Ontario to improve water quality and agricultural productivity. Key points: - The Holland Marsh is an important vegetable growing region on organic soils, but drainage into Lake Simcoe contributes excess nutrients. - A study evaluated controlling water tables with controlled drainage to reduce pumping and nutrient loads in drainage water. Modeling and monitoring found it effective for water conservation but more limited for nutrient reductions. - Soil phosphorus pools, particularly aluminum and iron-bound phosphorus, were found to influence phosphorus levels in drainage water more than drainage management alone. Fertilizer applications exceeded crop needs, accumulating legacy phosphorus in soils over time.


