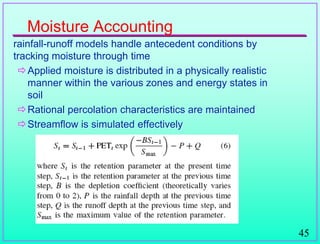
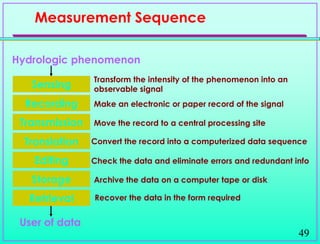
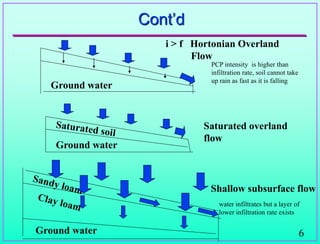
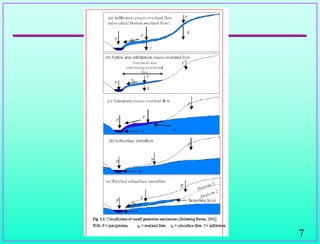
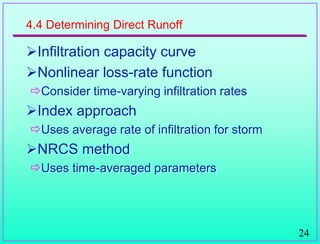
The document discusses hydrological processes related to surface runoff, outlining various methods for generation and measurement, including Hortonian overland flow and subsurface runoff. It emphasizes factors affecting runoff like watershed characteristics, rainfall intensity, and soil types, and provides methods for determining direct runoff. Furthermore, it details the use of models and curve numbers for predicting runoff potential in different land use scenarios.

![15
3. Watershed Factor:
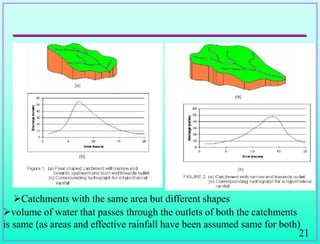
a. Size
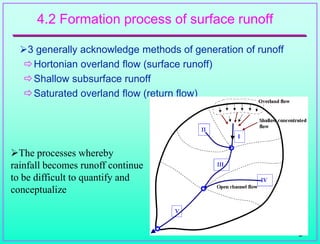
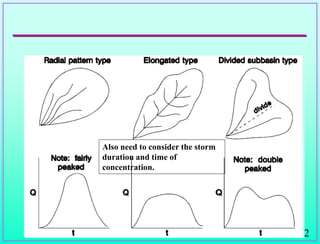
b. Shape
c. Altitude
d. Topography
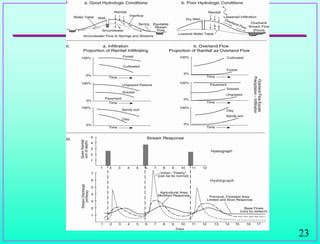
e. Geology [Soil type]
f. Land use [vegetation], Orientation
g. Type of drainage network
h. Proximate to ocean and mountain range
4. Storage Characteristics:
a. Depressions
b. Ponds, lakes and pools.
c. Stream
d. Channels.
e. Check dams in gullies
f. Upstream reservoirs or tanks.
g. Ground water storage in deposits/aquifers](https://image.slidesharecdn.com/chapter4-surfacerunoff1-240921120102-f7a5d9df/85/Chapter-4-Surface-runoff1-pdf-format-of-document-15-320.jpg)

![28
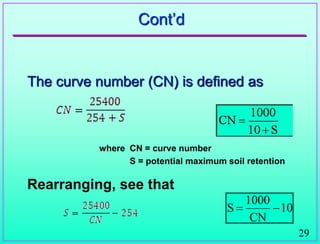
Cont‟d
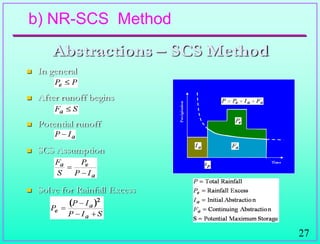
where Q = surface runoff [L]
P = precipitation [L]
Ia = initial abstraction
S = potential maximum soil retention [L]
Note that Q represents cumulative runoff corresponding to
cumulative P
S)
I
(P
)
I
(P
Q
a
2
a
](https://image.slidesharecdn.com/chapter4-surfacerunoff1-240921120102-f7a5d9df/85/Chapter-4-Surface-runoff1-pdf-format-of-document-28-320.jpg)