Download to read offline
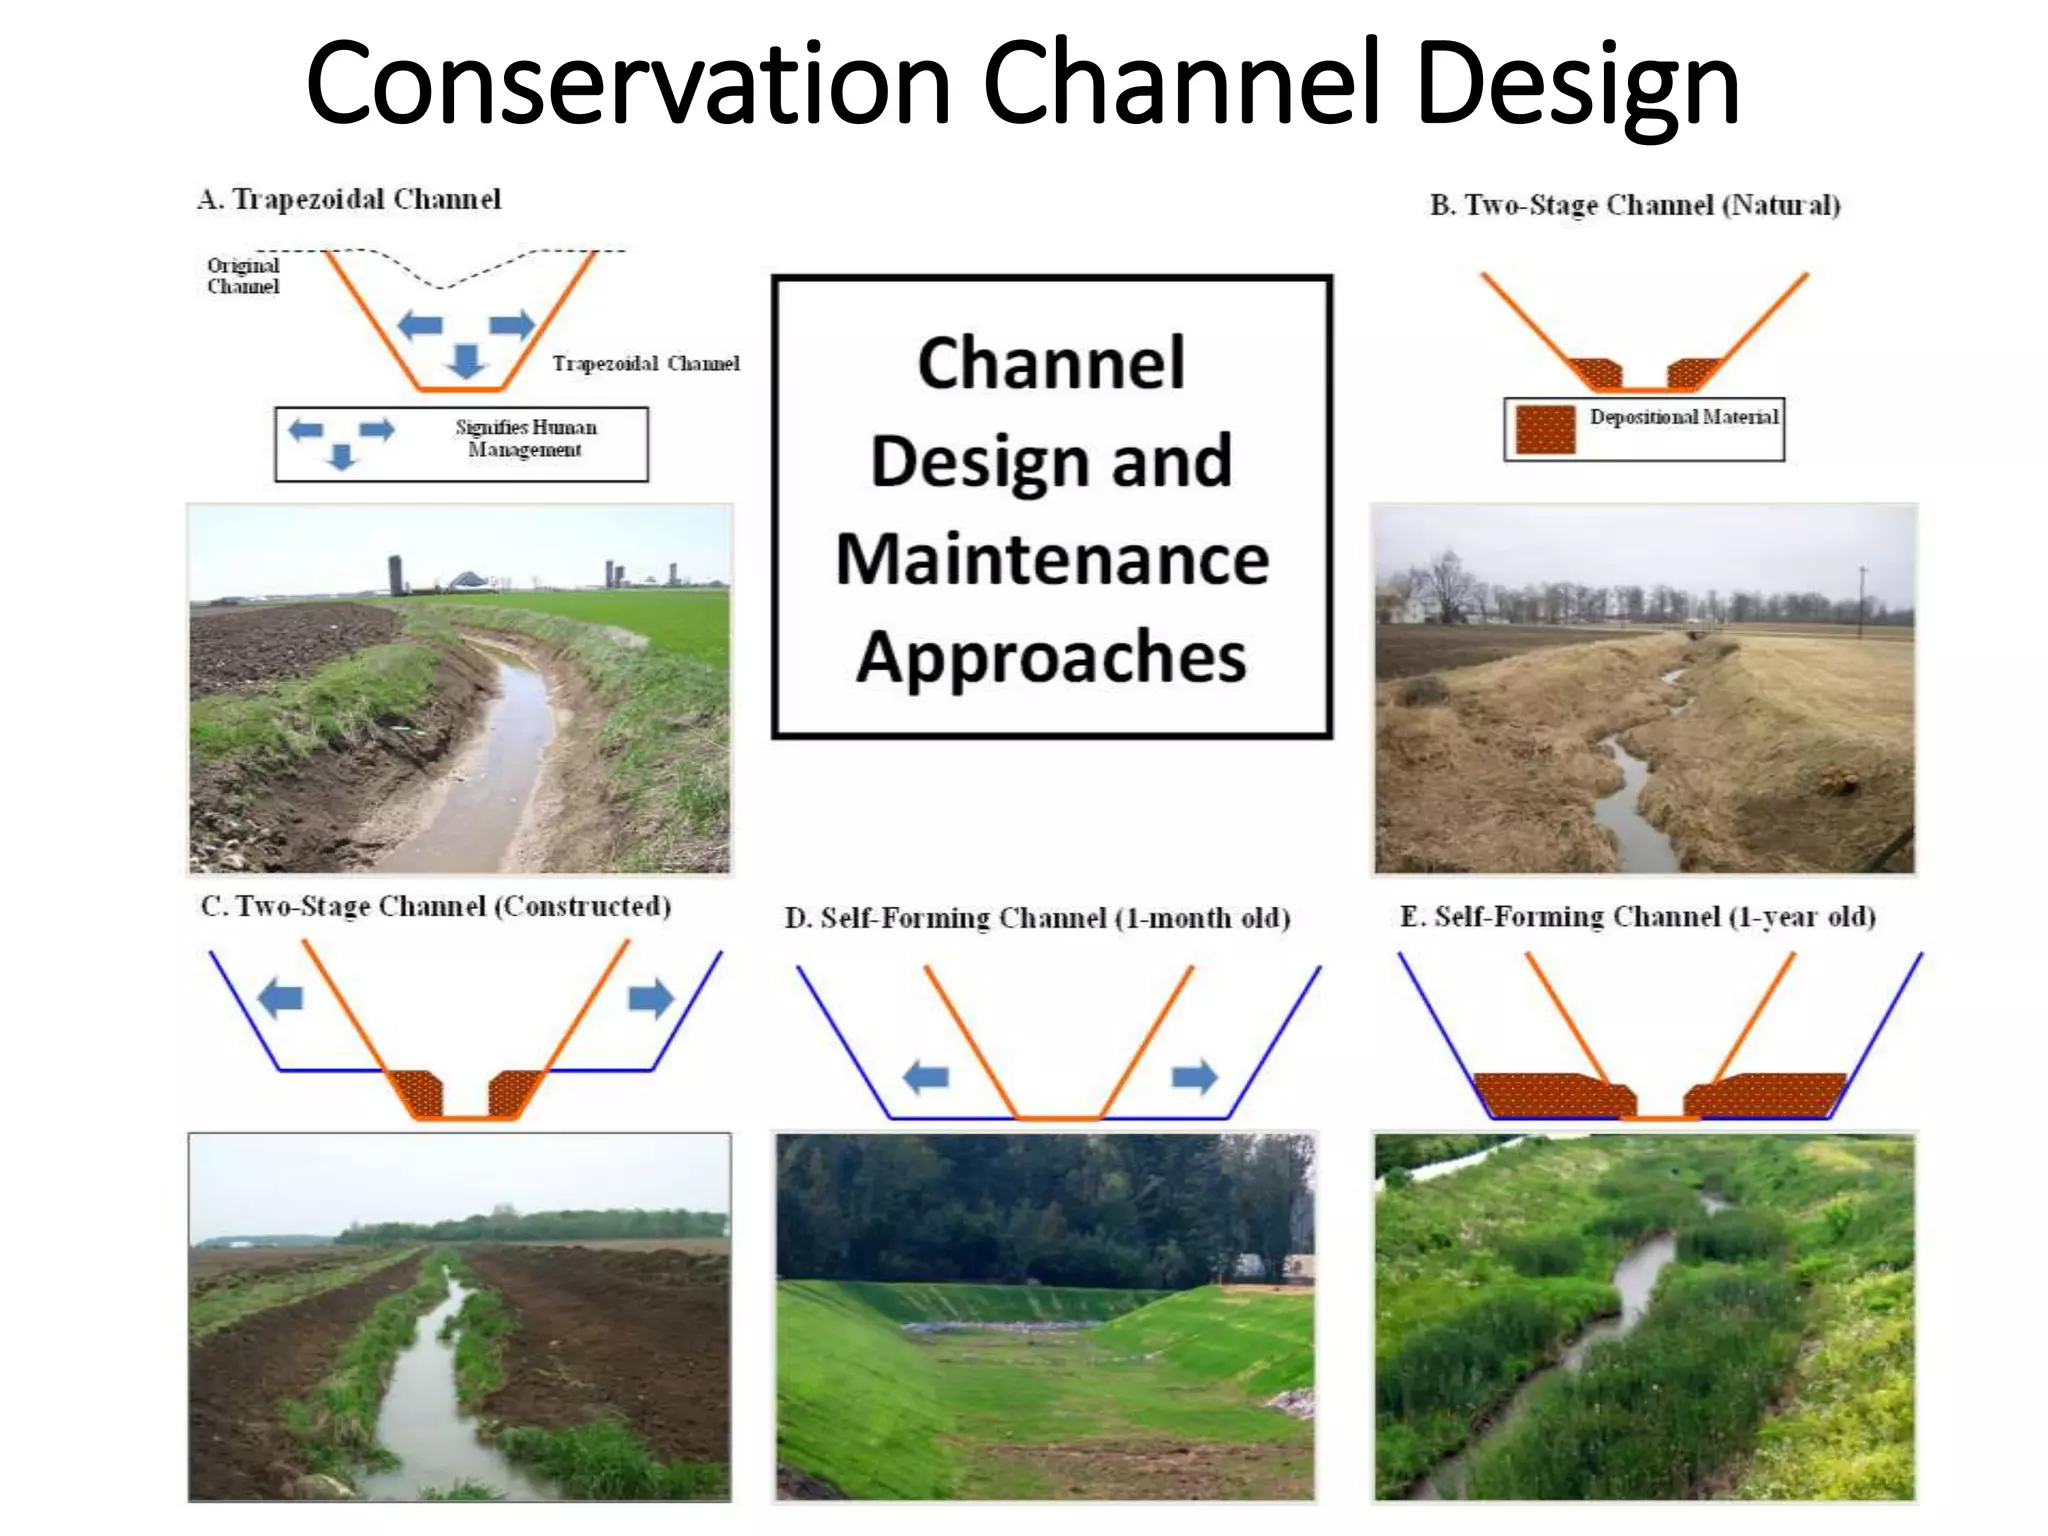
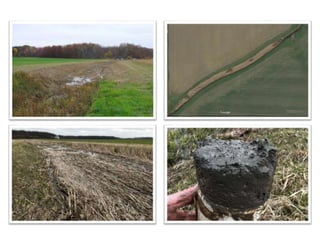
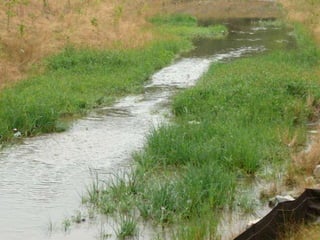
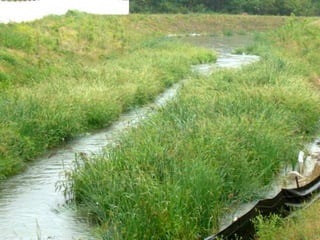
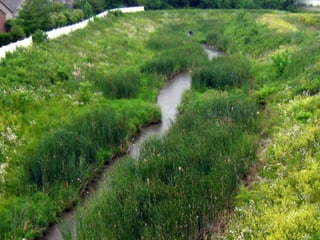
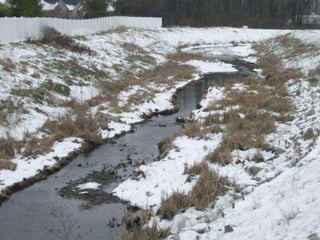
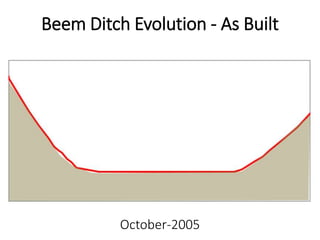
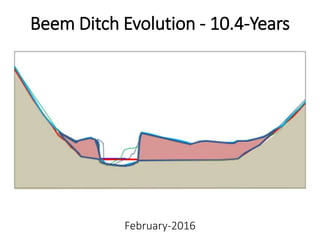
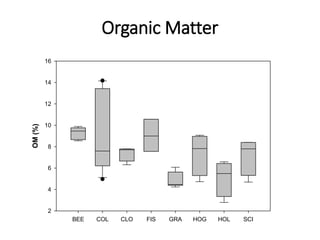
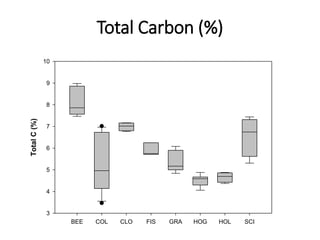
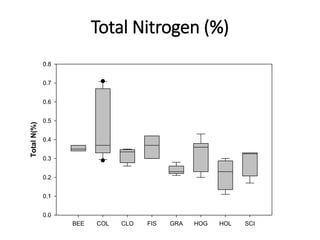
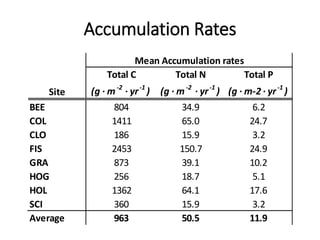
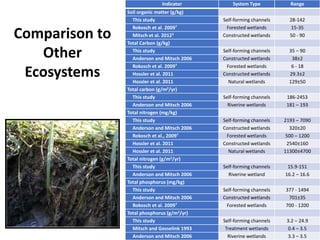
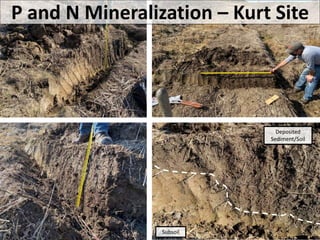

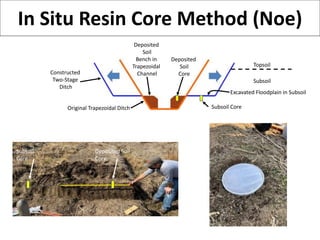
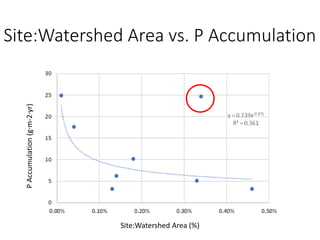
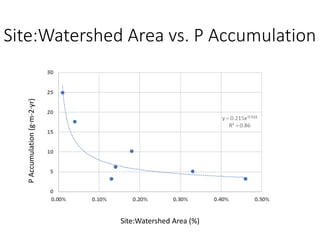
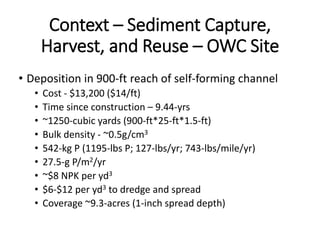

This document summarizes research on conservation channel design and sediment capture in two-stage ditches. It finds that self-forming channels accumulated more sediment, carbon, nitrogen, and phosphorus over time compared to traditional ditches. Sediment analysis showed higher nutrient levels than surrounding soils. A case study site captured over 500 kg of phosphorus over 9 years that could be harvested and reused as fertilizer, offsetting nutrient costs for farmers. The document concludes sediment trapping in two-stage ditches can improve water quality while providing a locally sourced, cost-effective fertilizer resource.


