Download to read offline

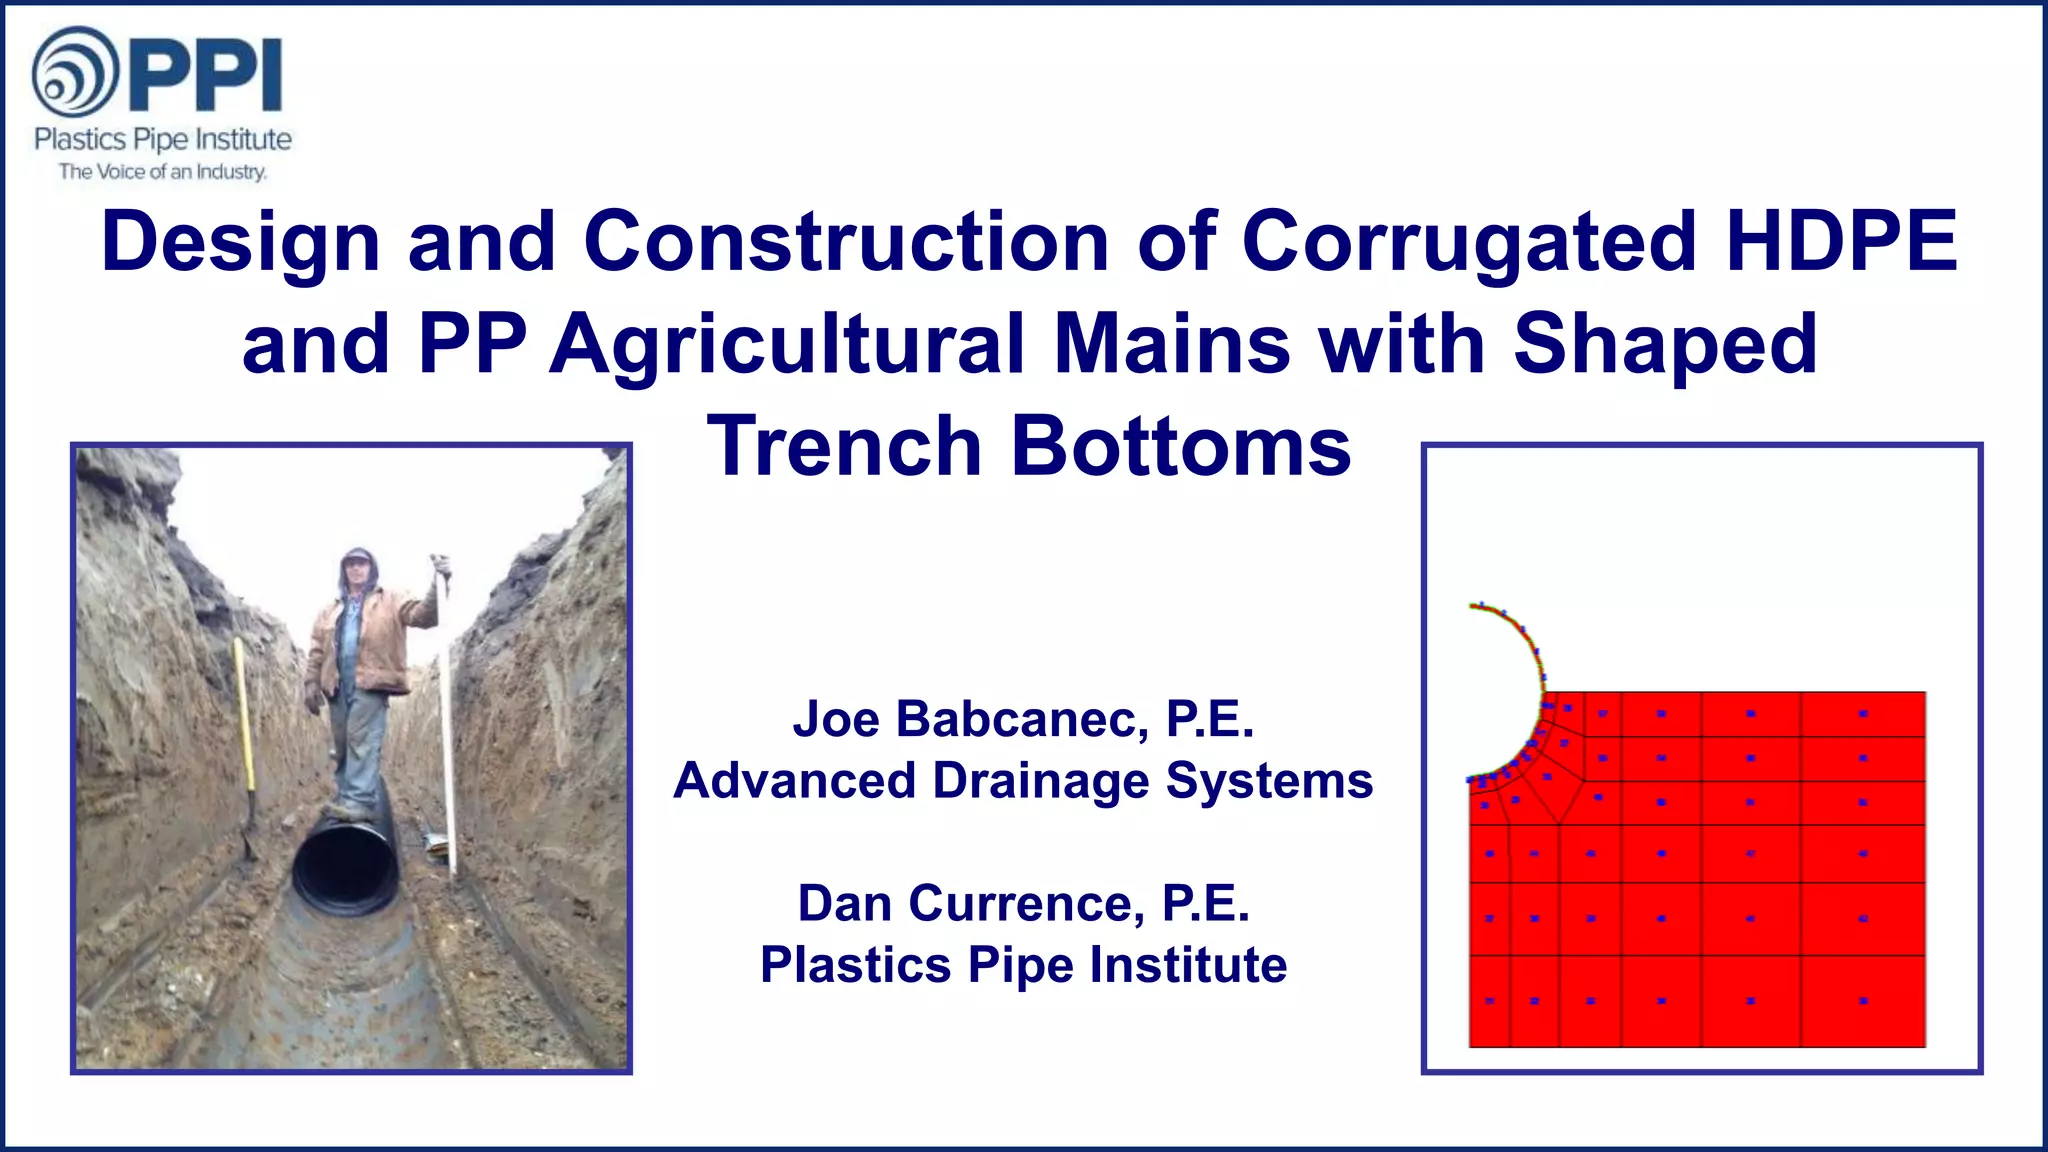
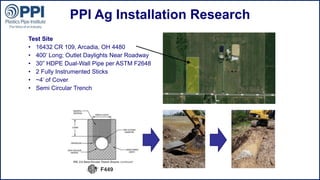
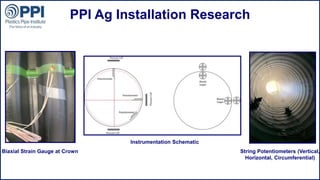
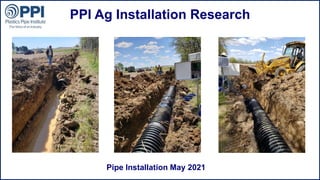
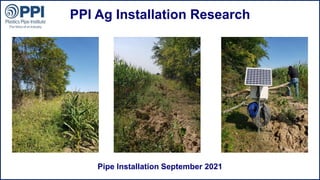
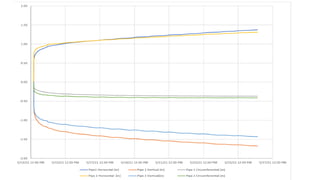
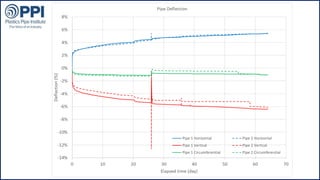
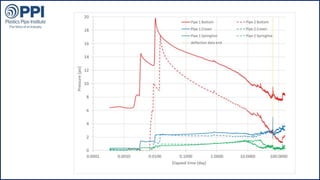
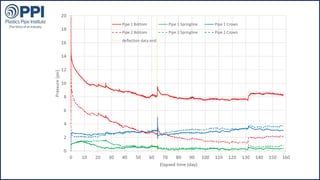
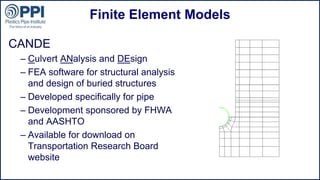
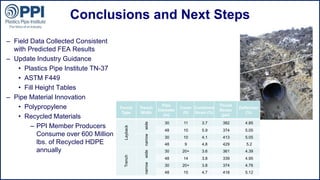

This document summarizes research conducted by the Plastics Pipe Institute (PPI) on the installation of corrugated high-density polyethylene (HDPE) and polypropylene (PP) agricultural drainage pipe. It describes field testing of 30-inch HDPE dual-wall pipe installed at a test site in Ohio, including instrumentation to monitor strain and deflection. Finite element modeling was also used to analyze trench configurations. The research aims to update industry guidance documents to optimize pipe installation practices and trench designs. PPI members also work to increase the use of recycled HDPE and PP materials in pipe production.


