Download to read offline
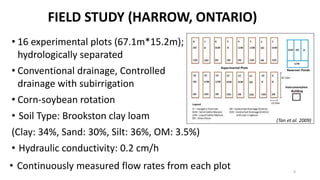
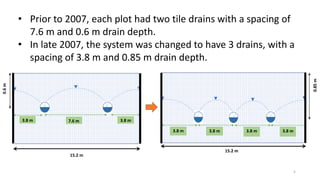
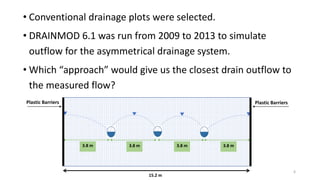
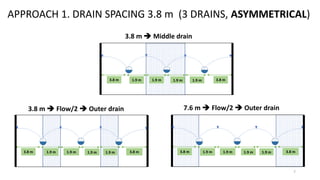
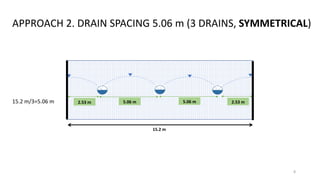
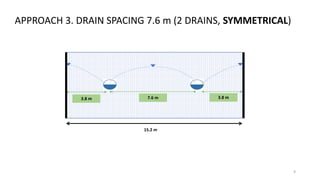
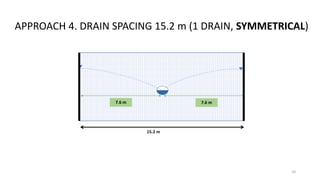
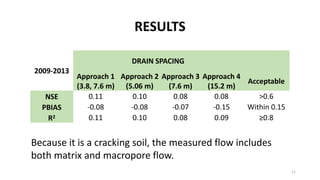
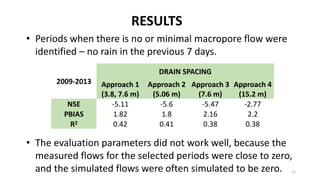
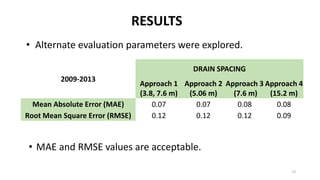
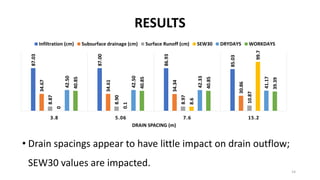

1) DRAINMOD simulations were conducted for a field in Harrow, Ontario with an asymmetrical drainage system to determine the best approach to simulate drain outflow. 2) Four approaches using different drain spacings were tested: 3.8m, 5.06m, 7.6m, and 15.2m. 3) The mean absolute error and root mean square error for each approach were acceptable, indicating drain spacing had little impact on outflow simulation, though it did impact soil moisture parameters.


