Download as PDF, PPTX


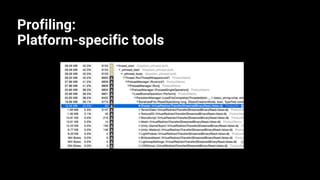


Kerry Turner, a developer relations engineer at Unity Technologies, discusses performance optimization in Unity, focusing on memory usage, load times, and CPU optimization for animations. Key topics include profiling best practices, asset settings for memory management, and the importance of minimizing resources to enhance performance. The document emphasizes using appropriate tools and settings to streamline runtime efficiency and provides guidelines for audio and animation management.


![[UniteKorea2013] Memory profiling in Unity](https://cdn.slidesharecdn.com/ss_thumbnails/memoryprofilinginunity-130509204713-phpapp01-thumbnail.jpg?width=640&height=640&fit=bounds)


![[Unite Seoul 2020] Mobile Graphics Best Practices for Artists](https://cdn.slidesharecdn.com/ss_thumbnails/arm-uniteseoul2020final-210524084305-thumbnail.jpg?width=640&height=640&fit=bounds)