Download as PDF, PPTX


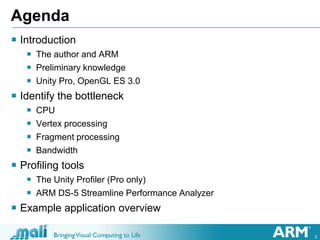

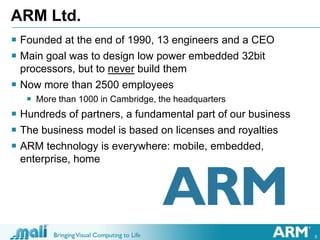
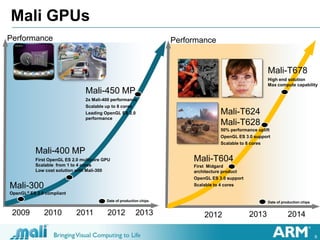
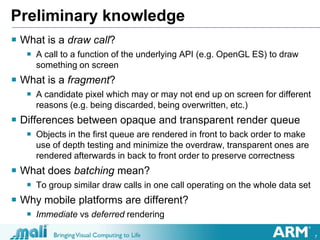
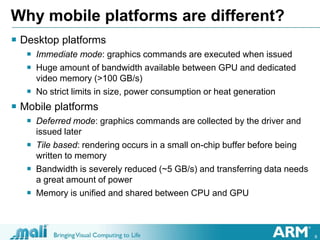
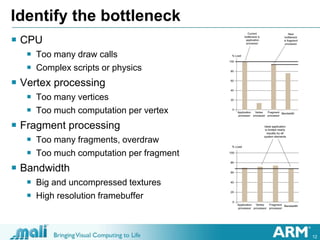
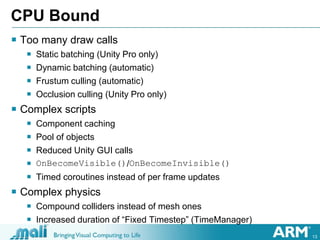
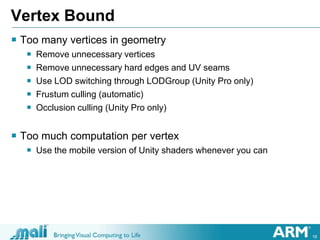
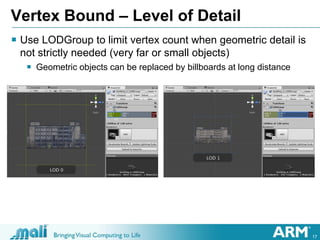
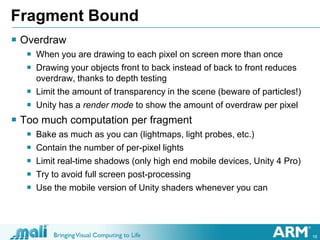
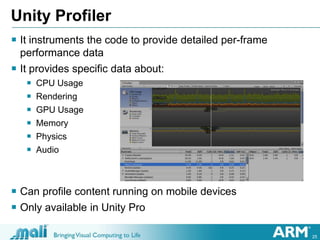
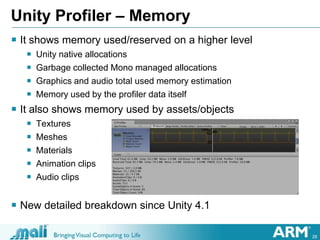
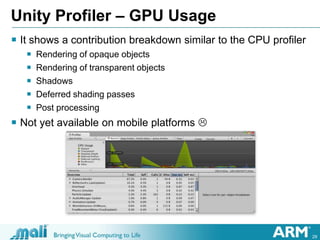
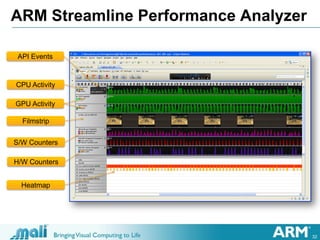
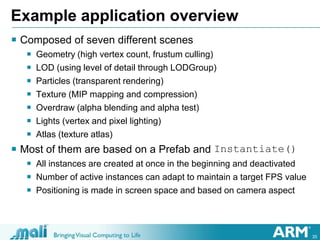
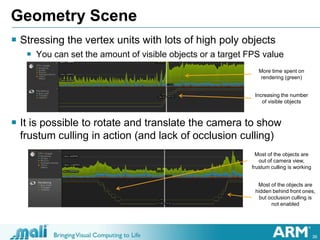
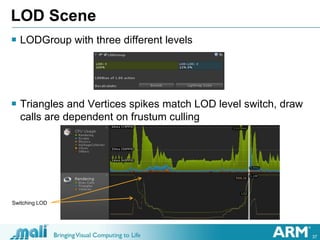
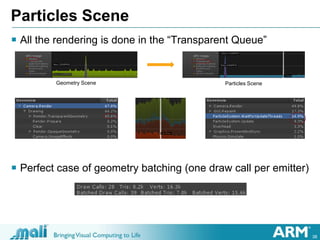
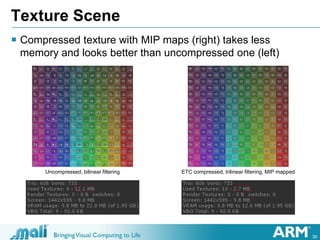
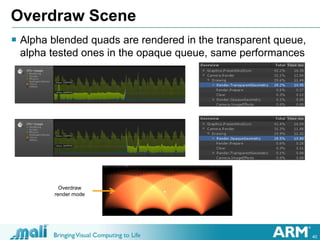
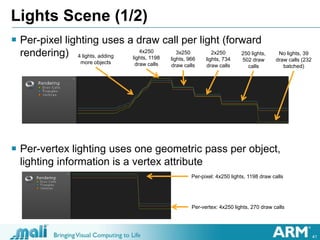
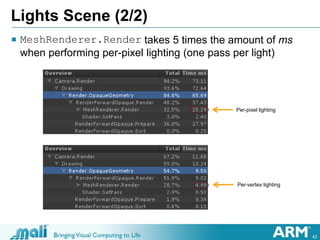
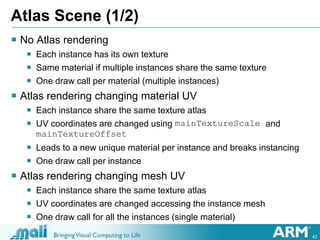
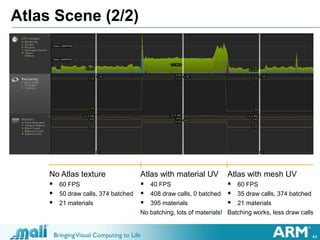


The document discusses optimizing Unity games for mobile platforms. It begins with an introduction to the author and ARM. It then covers identifying performance bottlenecks like CPU, vertex processing, fragment processing, and bandwidth usage. Tools for profiling like the Unity Profiler and ARM DS-5 Streamline Performance Analyzer are presented. An example application is overviewed to demonstrate optimization techniques for geometry, level of detail, particles, textures, overdraw, lights, and texture atlases. The document provides guidance on using tools and techniques to improve performance and optimize games for mobile hardware.


![[데브루키/141206 박민근] 유니티 최적화 테크닉 총정리](https://cdn.slidesharecdn.com/ss_thumbnails/141206-141207232632-conversion-gate02-thumbnail.jpg?width=640&height=640&fit=bounds)


![[160404] 유니티 apk 용량 줄이기](https://cdn.slidesharecdn.com/ss_thumbnails/160404apk-160404100918-thumbnail.jpg?width=640&height=640&fit=bounds)
![[Unite2015 박민근] 유니티 최적화 테크닉 총정리](https://cdn.slidesharecdn.com/ss_thumbnails/unite2015-150417010741-conversion-gate02-thumbnail.jpg?width=640&height=640&fit=bounds)


![[Unite Seoul 2020] Mobile Graphics Best Practices for Artists](https://cdn.slidesharecdn.com/ss_thumbnails/arm-uniteseoul2020final-210524084305-thumbnail.jpg?width=640&height=640&fit=bounds)
![[Unite Seoul 2019] Mali GPU Architecture and Mobile Studio](https://cdn.slidesharecdn.com/ss_thumbnails/maligpuarchitectureandmobilestudiofinal3-190717042828-thumbnail.jpg?width=640&height=640&fit=bounds)
![[Unity Forum 2019] Mobile Graphics Optimization Guides](https://cdn.slidesharecdn.com/ss_thumbnails/20191108taipeiunityforum-191204024024-thumbnail.jpg?width=640&height=640&fit=bounds)


![[TGDF 2019] Mali GPU Architecture and Mobile Studio](https://cdn.slidesharecdn.com/ss_thumbnails/tgdfgpuarchitecturemobilestudio-190717043007-thumbnail.jpg?width=640&height=640&fit=bounds)

![[TGDF 2020] Mobile Graphics Best Practices for Artist](https://cdn.slidesharecdn.com/ss_thumbnails/mobilegraphicsbestpracticesforartist-200712102753-thumbnail.jpg?width=640&height=640&fit=bounds)