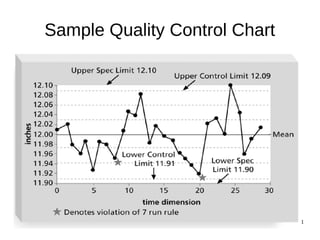
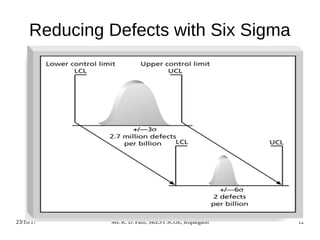
23/10/17 Ms. K. D. Patil, SRES's SCOE, Kopargaon 1
Subject: Software Engineering & Project
Management
Topic: Quality Control
23/10/17 Ms. K. D. Patil, SRES's SCOE, Kopargaon 2
Quality Control
● The main outputs of quality control are
● acceptance decisions
● rework
● process adjustments
● Some tools and techniques include
● pareto analysis
● statistical sampling
● quality control charts
● testing
23/10/17 Ms. K. D. Patil, SRES's SCOE, Kopargaon 3
Pareto Analysis
● Pareto analysis involves identifying the vital few
contributors that account for the most quality
problems in a system
● Also called the 80-20 rule, meaning that 80% of
problems are often due to 20% of the causes
● Pareto diagrams are histograms that help
identify and prioritize problem areas
23/10/17 Ms. K. D. Patil, SRES's SCOE, Kopargaon 4
Figure : Sample Pareto Diagram
Row 1 Row 2 Row 3 Row 4
0
2
4
6
8
10
12
Column 1
Column 2
Column 3
23/10/17 Ms. K. D. Patil, SRES's SCOE, Kopargaon 5
Statistical Sampling and Standard
Deviation
● Statistical sampling involves choosing part of a
population of interest for inspection
● The size of a sample depends on how
representative you want the sample to be
● Sample size formula:
Sample size = .25 X (certainty Factor/acceptable error)2
23/10/17 Ms. K. D. Patil, SRES's SCOE, Kopargaon 6
Commonly Used Certainty Factors
Desired Certainty Certainty Factor
95% 1.960
90% 1.645
80% 1.281
95% certainty: Sample size = 0.25 X (1.960/.05) 2
= 384
90% certainty: Sample size = 0.25 X (1.645/.10)2
= 68
80% certainty: Sample size = 0.25 X (1.281/.20)2
= 10
23/10/17 Ms. K. D. Patil, SRES's SCOE, Kopargaon 7
Standard Deviation
● Standard deviation measures how much
variation exists in a distribution of data
● A small standard deviation means that data
cluster closely around the middle of a
distribution and there is little variability among
the data
● A normal distribution is a bell-shaped curve that
is symmetrical about the mean or average value
of a population
23/10/17 Ms. K. D. Patil, SRES's SCOE, Kopargaon 8
Normal Distribution and Standard
Deviation
23/10/17 Ms. K. D. Patil, SRES's SCOE, Kopargaon 9
Sigma and Defective Units
Specification Range
(in +/- Sigmas)
Percent of
Population
Within Range
Defective Units
Per Billion
1 68.27 317,300,000
2 95.45 45,400,000
3 99.73 2,700,000
4 99.9937 63,000
5 99.999943 57
6 99.9999998 2
23/10/17 Ms. K. D. Patil, SRES's SCOE, Kopargaon 10
Quality Control Charts, Six Sigma,
and the Seven Run Rule
● A control chart is a graphic display of data that
illustrates the results of a process over time. It helps
prevent defects and allows you to determine whether a
process is in control or out of control
● Operating at a higher sigma value, like 6 sigma, means
the product tolerance or control limits have less
variability
● The seven run rule states that if seven data points in a
row are all below the mean, above,the mean, or
increasing or decreasing, then the process needs to be
examined for non-random problems
23/10/17 Ms. K. D. Patil, SRES's SCOE, Kopargaon 11
Sample Quality Control Chart
23/10/17 Ms. K. D. Patil, SRES's SCOE, Kopargaon 12
Reducing Defects with Six Sigma
23/10/17 Ms. K. D. Patil, SRES's SCOE, Kopargaon 13
References
● Information Technology Project Management by
Kathy Schwalbe.

Unit 5 quality control

  • 1.
    23/10/17 Ms. K.D. Patil, SRES's SCOE, Kopargaon 1 Subject: Software Engineering & Project Management Topic: Quality Control
  • 2.
    23/10/17 Ms. K.D. Patil, SRES's SCOE, Kopargaon 2 Quality Control ● The main outputs of quality control are ● acceptance decisions ● rework ● process adjustments ● Some tools and techniques include ● pareto analysis ● statistical sampling ● quality control charts ● testing
  • 3.
    23/10/17 Ms. K.D. Patil, SRES's SCOE, Kopargaon 3 Pareto Analysis ● Pareto analysis involves identifying the vital few contributors that account for the most quality problems in a system ● Also called the 80-20 rule, meaning that 80% of problems are often due to 20% of the causes ● Pareto diagrams are histograms that help identify and prioritize problem areas
  • 4.
    23/10/17 Ms. K.D. Patil, SRES's SCOE, Kopargaon 4 Figure : Sample Pareto Diagram Row 1 Row 2 Row 3 Row 4 0 2 4 6 8 10 12 Column 1 Column 2 Column 3
  • 5.
    23/10/17 Ms. K.D. Patil, SRES's SCOE, Kopargaon 5 Statistical Sampling and Standard Deviation ● Statistical sampling involves choosing part of a population of interest for inspection ● The size of a sample depends on how representative you want the sample to be ● Sample size formula: Sample size = .25 X (certainty Factor/acceptable error)2
  • 6.
    23/10/17 Ms. K.D. Patil, SRES's SCOE, Kopargaon 6 Commonly Used Certainty Factors Desired Certainty Certainty Factor 95% 1.960 90% 1.645 80% 1.281 95% certainty: Sample size = 0.25 X (1.960/.05) 2 = 384 90% certainty: Sample size = 0.25 X (1.645/.10)2 = 68 80% certainty: Sample size = 0.25 X (1.281/.20)2 = 10
  • 7.
    23/10/17 Ms. K.D. Patil, SRES's SCOE, Kopargaon 7 Standard Deviation ● Standard deviation measures how much variation exists in a distribution of data ● A small standard deviation means that data cluster closely around the middle of a distribution and there is little variability among the data ● A normal distribution is a bell-shaped curve that is symmetrical about the mean or average value of a population
  • 8.
    23/10/17 Ms. K.D. Patil, SRES's SCOE, Kopargaon 8 Normal Distribution and Standard Deviation
  • 9.
    23/10/17 Ms. K.D. Patil, SRES's SCOE, Kopargaon 9 Sigma and Defective Units Specification Range (in +/- Sigmas) Percent of Population Within Range Defective Units Per Billion 1 68.27 317,300,000 2 95.45 45,400,000 3 99.73 2,700,000 4 99.9937 63,000 5 99.999943 57 6 99.9999998 2
  • 10.
    23/10/17 Ms. K.D. Patil, SRES's SCOE, Kopargaon 10 Quality Control Charts, Six Sigma, and the Seven Run Rule ● A control chart is a graphic display of data that illustrates the results of a process over time. It helps prevent defects and allows you to determine whether a process is in control or out of control ● Operating at a higher sigma value, like 6 sigma, means the product tolerance or control limits have less variability ● The seven run rule states that if seven data points in a row are all below the mean, above,the mean, or increasing or decreasing, then the process needs to be examined for non-random problems
  • 11.
    23/10/17 Ms. K.D. Patil, SRES's SCOE, Kopargaon 11 Sample Quality Control Chart
  • 12.
    23/10/17 Ms. K.D. Patil, SRES's SCOE, Kopargaon 12 Reducing Defects with Six Sigma
  • 13.
    23/10/17 Ms. K.D. Patil, SRES's SCOE, Kopargaon 13 References ● Information Technology Project Management by Kathy Schwalbe.