Download as PDF, PPTX


![7 QC TOOLS
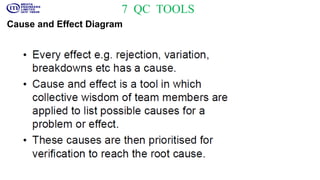
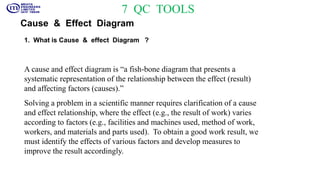
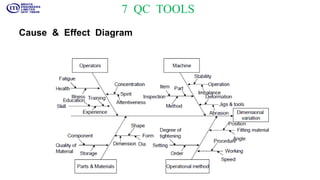
Cause & Effect Diagram
Can obtain a clear
overall picture of causal
relation. (A change in
the cause triggers a
variation in the
result.)○ Can clarify
the cause and effect
relationship.
Can list up all causes
to identify important
causes.
Can determine the
direction of action
(countermeasure).
Method Usage Result
Used when
clarifying a cause
and effect
relationship.[Used
during a phase to
analyze causes.]
Used to develop
countermeasures.
[Used during a phase to plan
countermeasures.]
Material Method
ManMachine
Cause (4M’s) Result
(Controlled State)
Effect
Cause and EffectCause and Effect
DiagramDiagram
Material Method
ManMachine
Cause (4M’s) Result
(Controlled State)
Effect
Cause and EffectCause and Effect
DiagramDiagram](https://image.slidesharecdn.com/7qctool-191217063203/85/7-QC-TOOL-19-320.jpg)
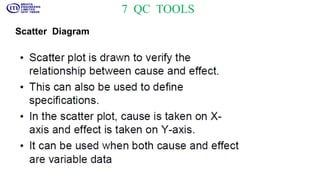
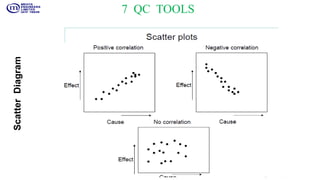
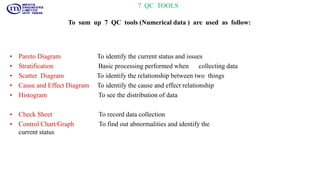


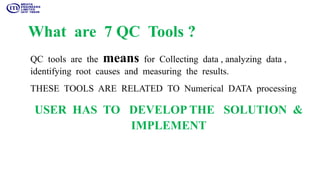
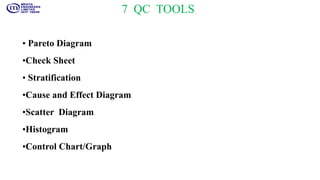
The document discusses the 7 main quality control tools used for collecting and analyzing numerical data. The tools are: Pareto diagram, check sheet, stratification, cause and effect diagram, scatter diagram, histogram, and control chart/graph. Each tool is explained briefly. The Pareto diagram identifies important issues. Stratification involves basic data processing. The scatter diagram shows relationships between two variables. The cause and effect diagram identifies causes and their effects. The histogram depicts data distribution. The check sheet records collected data. And the control chart finds abnormalities and status. Together these 7 QC tools are used to collect, analyze, identify root causes, and measure results.


