Download to read offline
![Rajashekharaiah, J.: Six Sigma Benchmarking of Process Capability Analysis and Mapping of Process Parameters
ISSN: 1984-3046 • Journal of Operations and Supply Chain Management Volume 9 Number 2 p 60 – 7171
Montgomery, D. C. (1986). Introduction to statistical quality control.
New York, USA: John Wiley & Sons.
Nonthaleerak, P., & Hendry, L. (2006). Six Sigma: Literature re-
view and key future research areas. International Journal of Six
Sigma and Competitive Advantage, 2(2), 105-161.
Oke, S. (2007). Six Sigma: A literature review. South African Jour-
nal of Industrial Engineering, 18(2), 109-129.
Pande, P., & Holpp, L. (2002). What is Six Sigma? New York,
USA: McGraw-Hill.
Pearn, W. L., Kotz, S., & Johnson, N. L. (1992). Distributional and
inferential properties of process capability indices. Journal of
Quality Technology, 24(4), 216-231.
Persico, J. (Ed.) (1992). The TQM transformation: A model for
organizational change. Quality Resources. New York, USA:
White Plains.
Porter, L. J., & Oakland, J. B. (1991). Process capability indices:
An overview of theory and practices. Quality and Reliability
Engineering International, 7, 437-448.
Prabhushankar, G., Devadasan, S., Shalij, P., & Thirunavukkara-
su, V. (2008). The origin, history and definition of Six Sigma:
A literature review. International Journal Of Six Sigma And
Competitive Advantage, 4(2), 133-150.
Pyzdek, T. (2003). The Six Sigma handbook. New York, USA: Mc-
Graw-Hill.
Rao, S., & Xia, W. (1999). Measuring quality by process capability
indices and the effects of non-normality. Journal of Statistics
and Management Systems, 2(2-3), 127-142.
Scott, R. (2011). Benchmarking: A literature review. Academic
Excellence Centre for Learning and Development, Edith
Cowan University. Retrieved from http://intranet.ecu.edu.
au/ data/assets/pdf_file/0010/ 357193/Benchmarking-Litera-
ture-Review.pdf
Six Sigma Daily. (2016). DPMO to sigma level relationship. [on-
line] Retrieved from http://www.sixsigmadaily.com/dpmo-
to-sigma-level-relationship/
Somerville, S., & Montgomery, D. (1996). Process capability indi-
ces and non-normal distributions. Quality Engineering, 9(2),
305-316.
Summers, D. (2005). Quality management (1st ed.). Upper Saddle
River, USA: Pearson Prentice Hall.
Tjahjono, B., Ball, P., Vitanov, V., Scorzafave, C., Nogueira, J., &
Calleja, J. ...Yadav, A. (2010). Six Sigma: A literature review.
International Journal of Lean Six Sigma, 1(3), 216-233.
Zairi, M., & Youssef, M. (1995). A review of key publications on
benchmarking part I. Benchmarking for Quality Management &
Technology, 2(1), 65-72.](https://image.slidesharecdn.com/64344-138937-1-pb-170216164531/75/Operations-Management-Six-sigma-benchmarking-of-process-capability-analysis-and-mapping-of-process-parameters-12-2048.jpg)

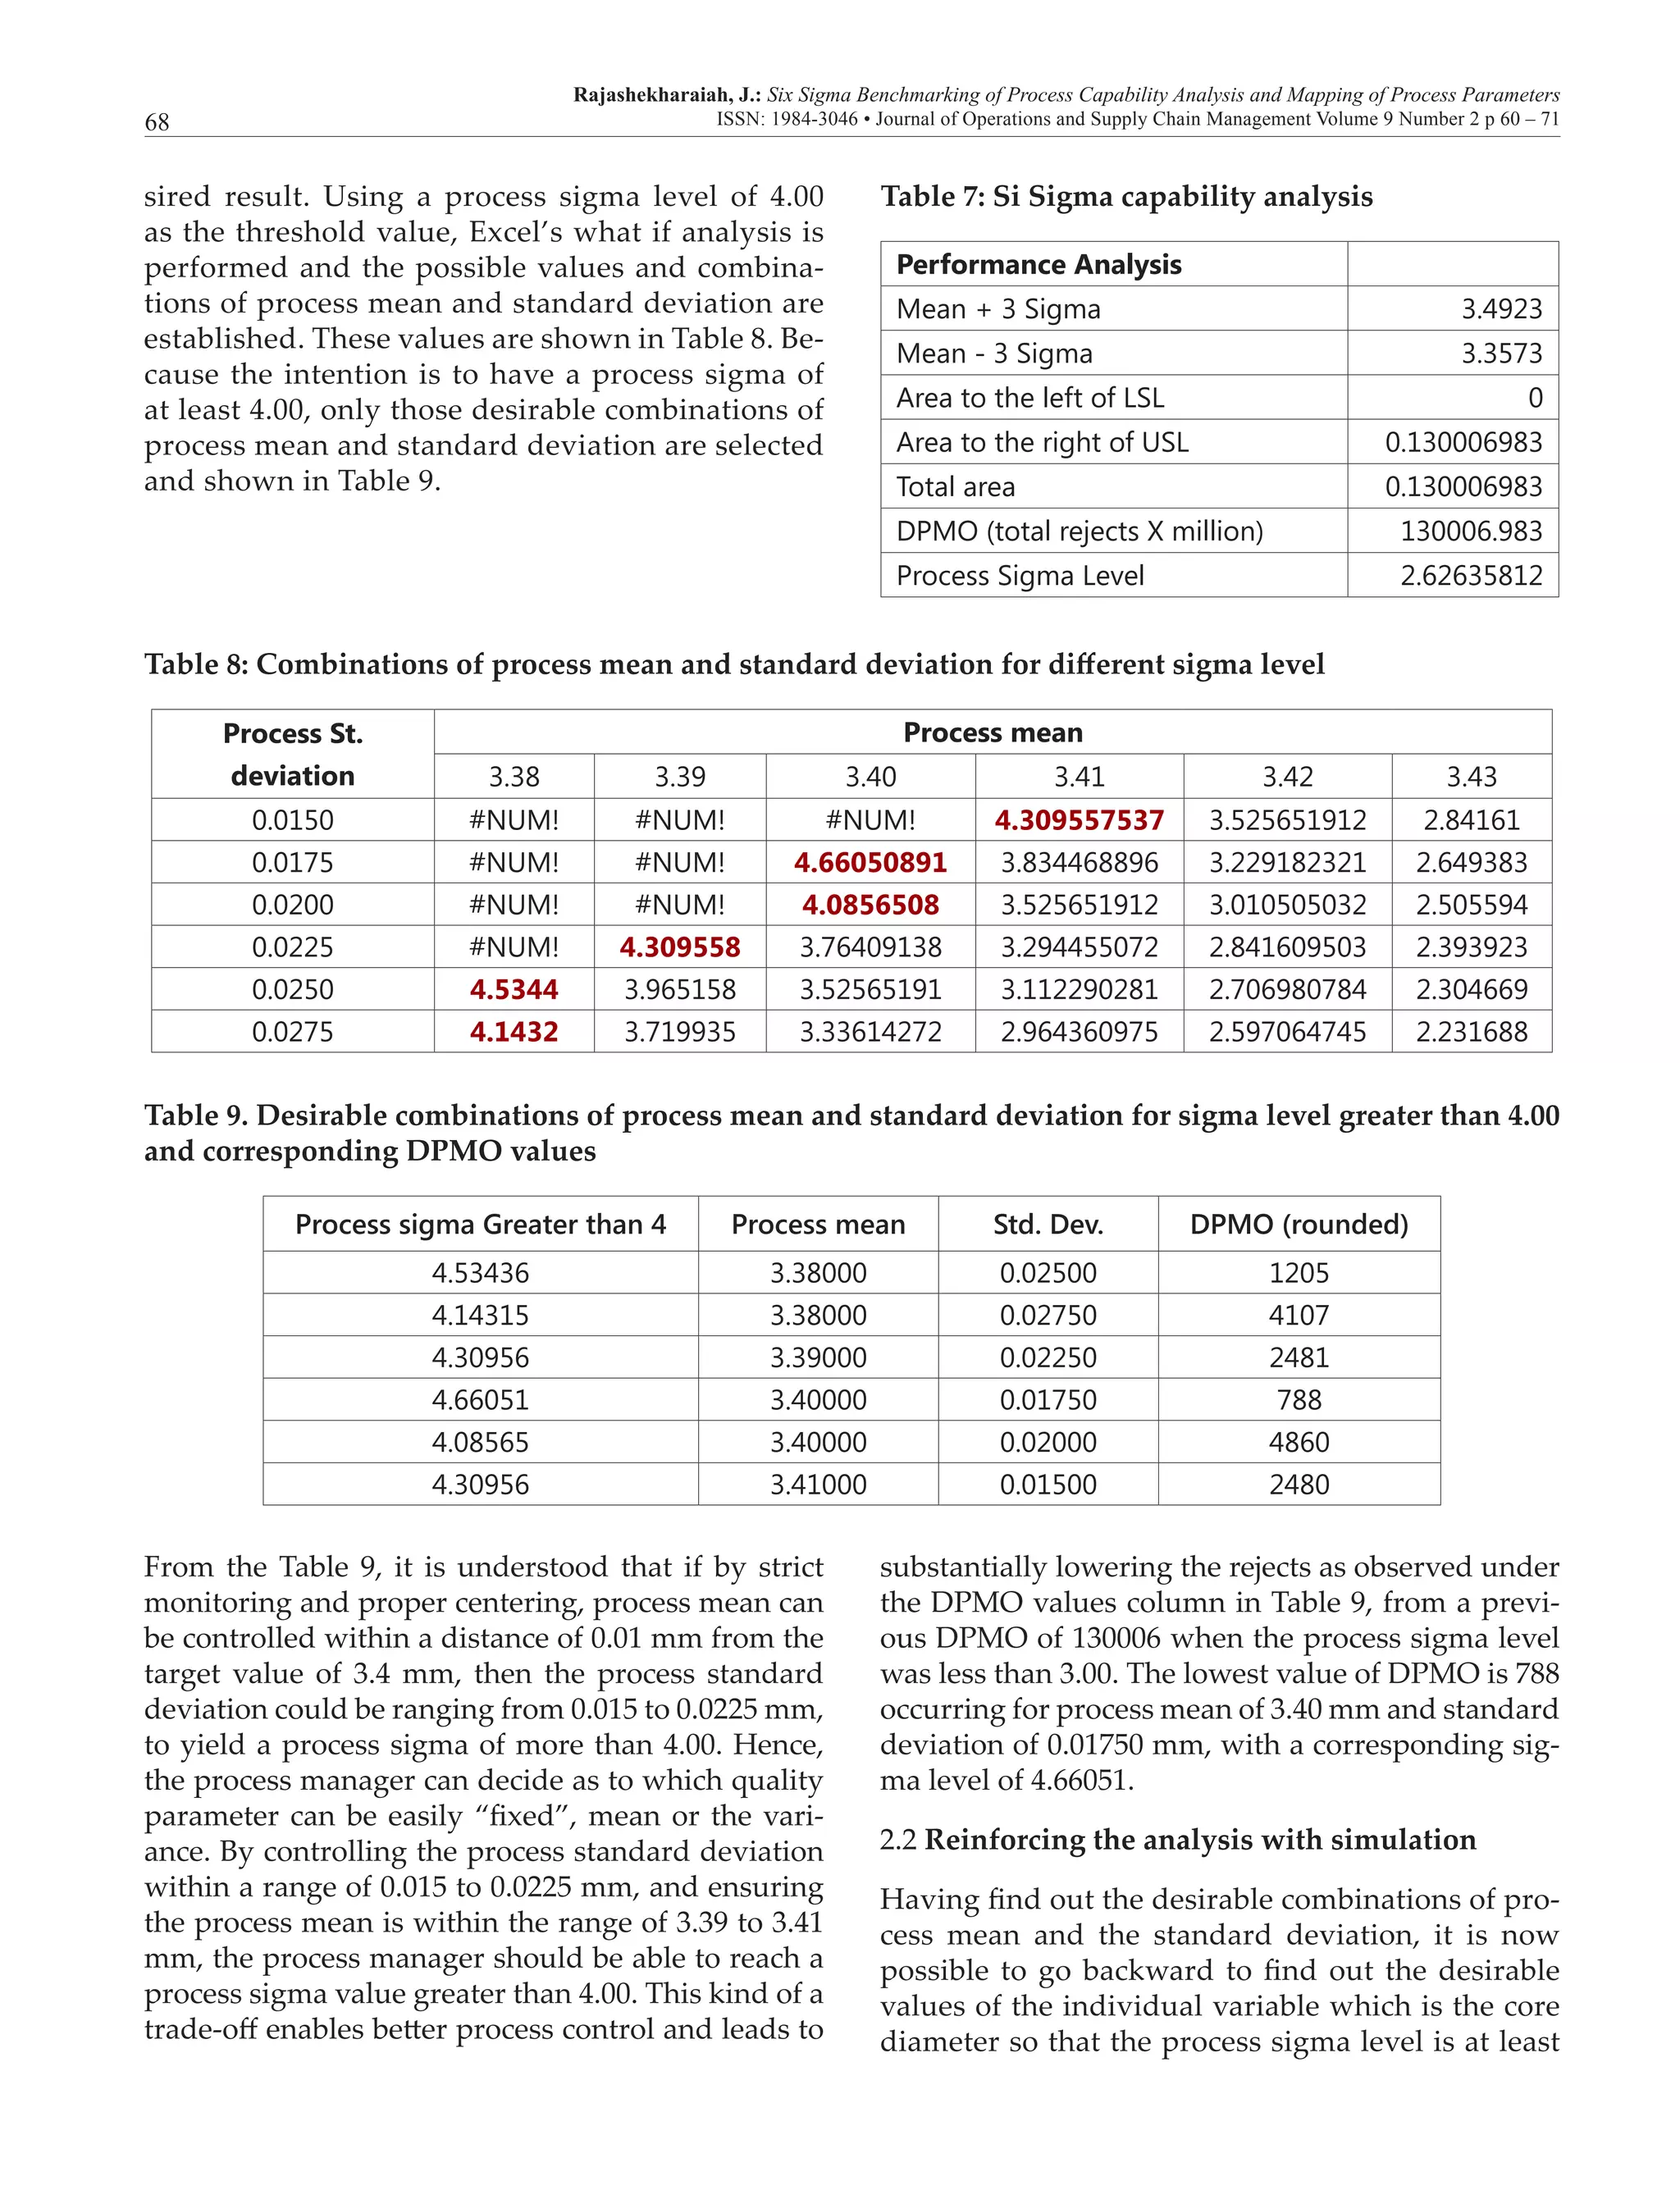
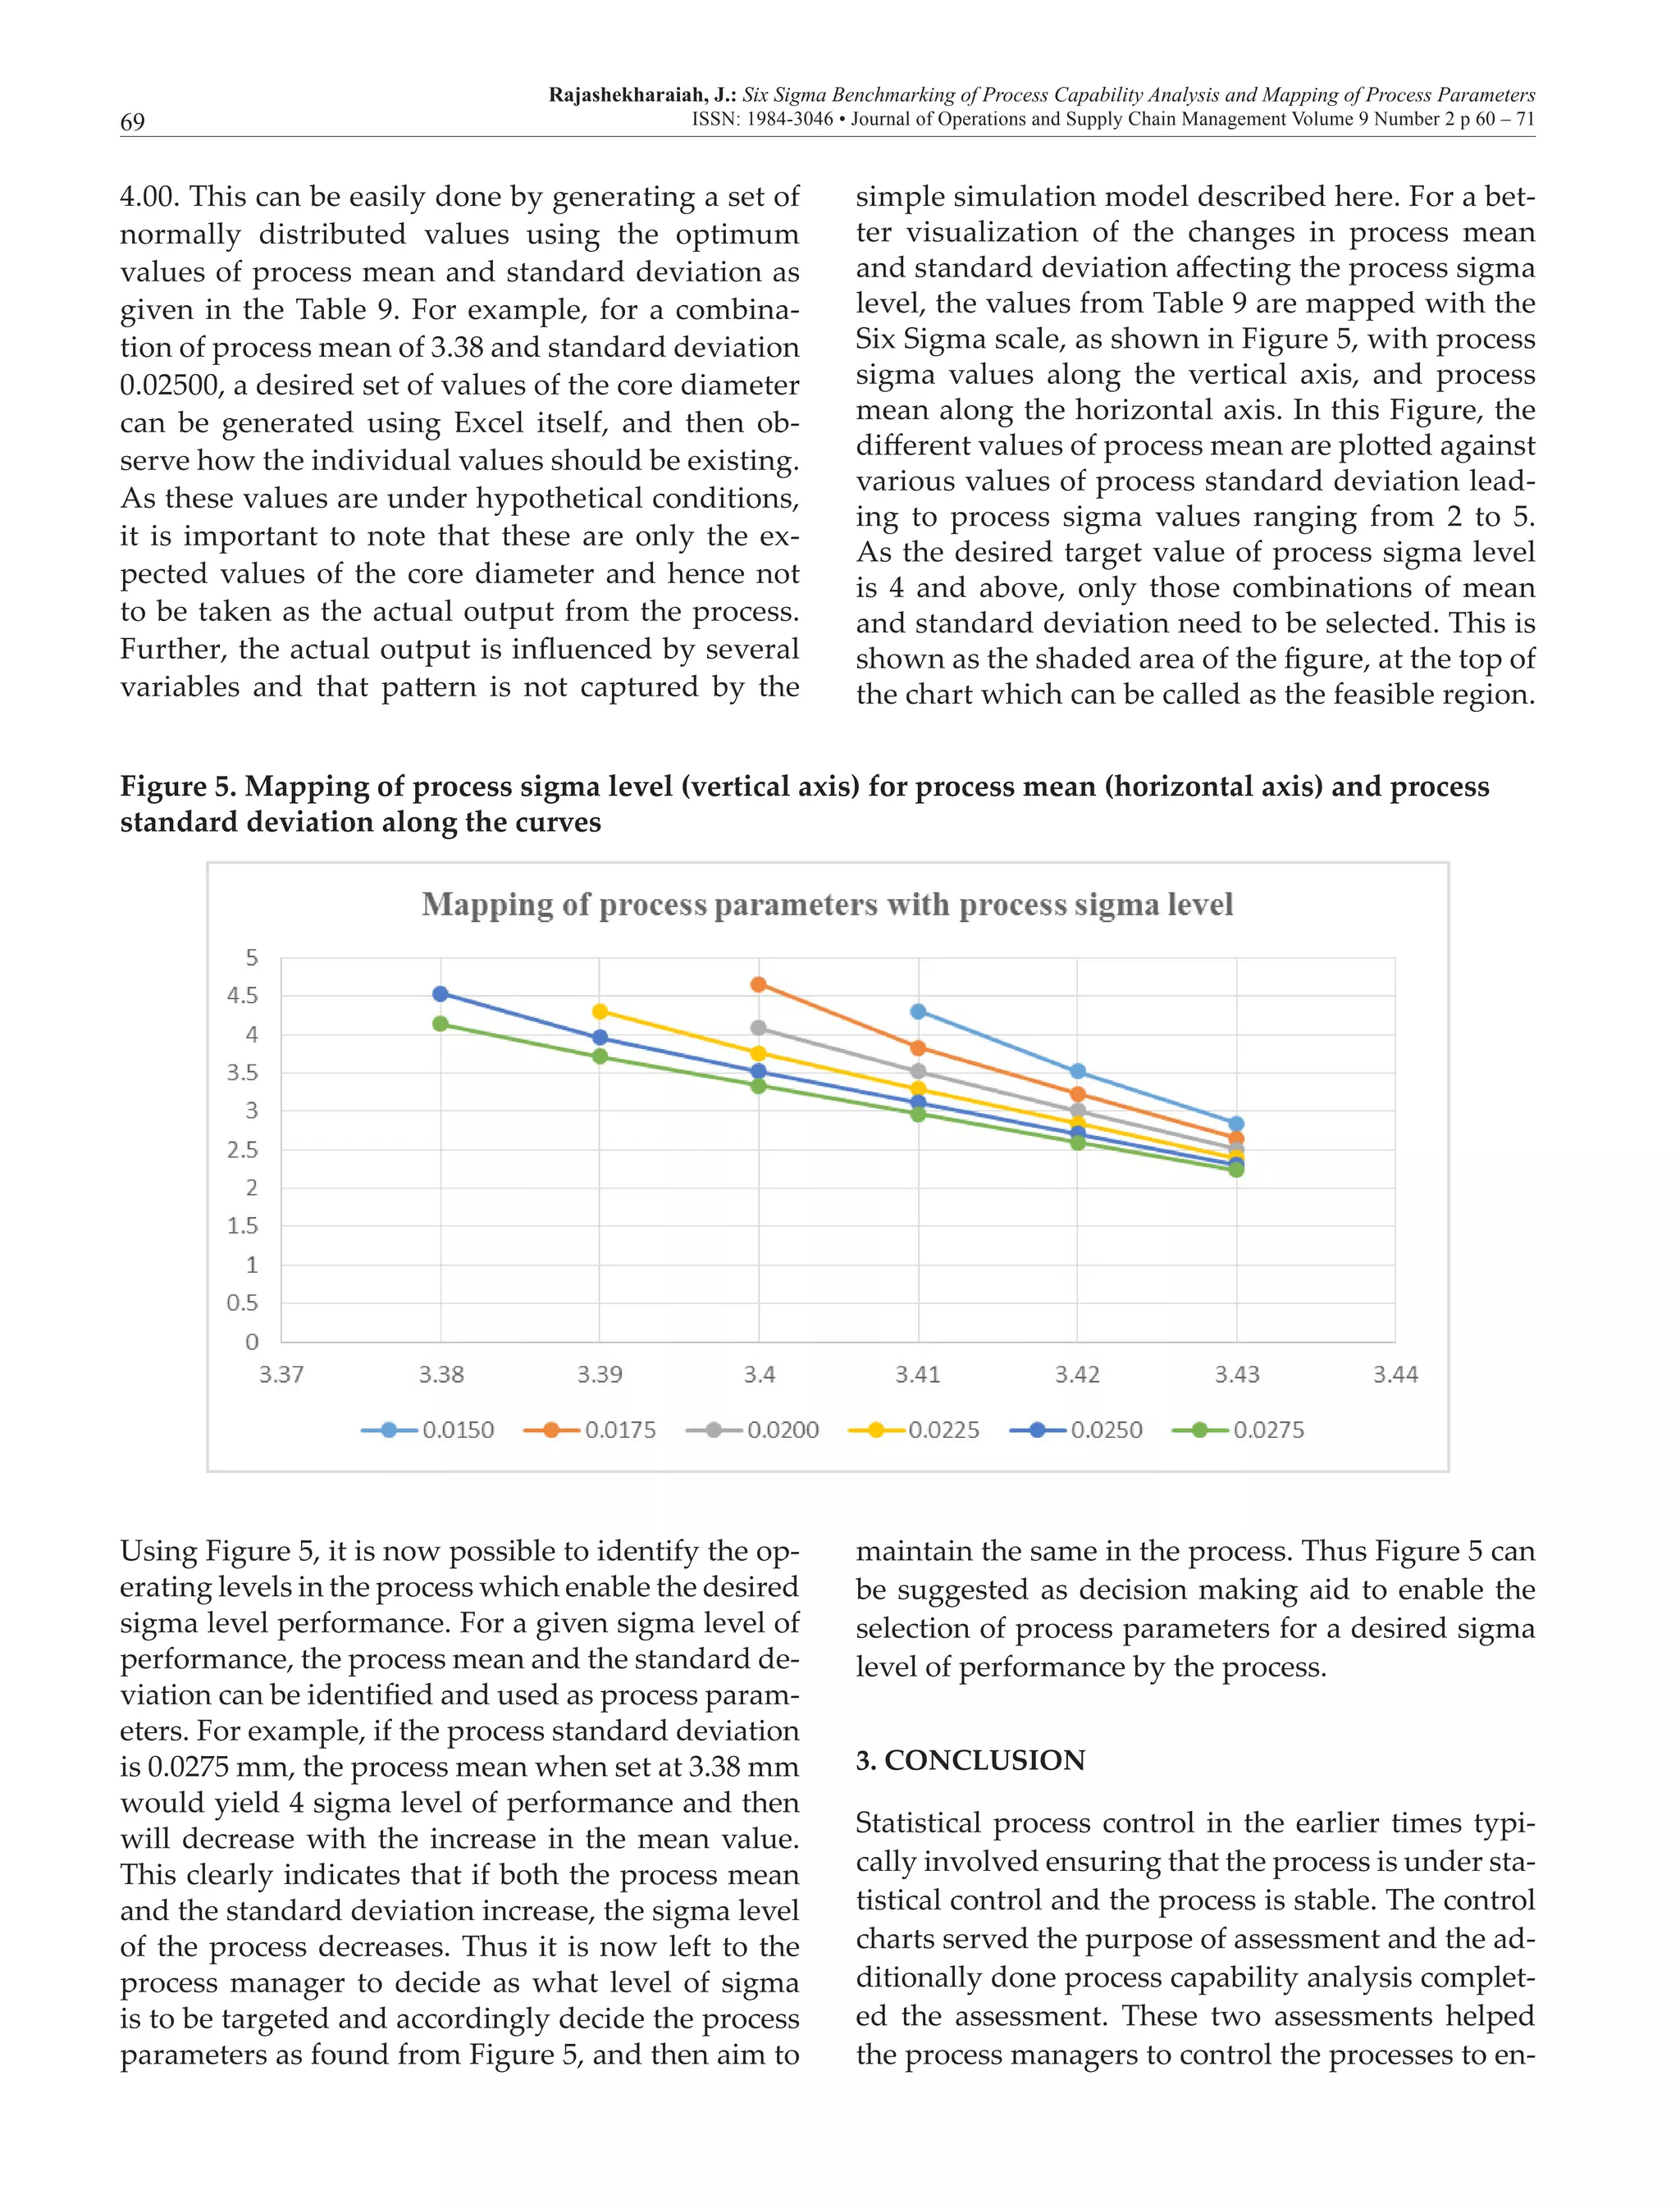
The document discusses the importance of process capability analysis (PCA) in ensuring the quality of manufacturing outputs, particularly in the context of Six Sigma benchmarking. It details how PCA uses process capability indices to evaluate and improve production processes, emphasizing the need for companies to meet global standards through effective monitoring and decision-making. The paper also provides a review of relevant literature and mathematical formulations related to process capability, along with practical applications demonstrated through Excel.


![Process Capability[1]](https://cdn.slidesharecdn.com/ss_thumbnails/processcapability1-1226090261326164-9-thumbnail.jpg?width=640&height=640&fit=bounds)


![[龍潭聖潔會] 聖靈在你身上嗎?](https://cdn.slidesharecdn.com/ss_thumbnails/1030126-140207122546-phpapp01-thumbnail.jpg?width=640&height=640&fit=bounds)


