Downloaded 20 times
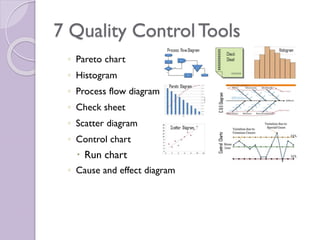
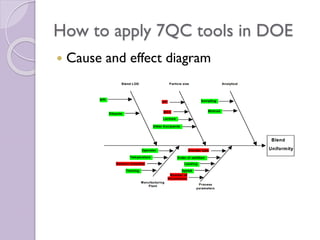
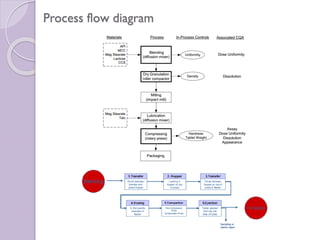
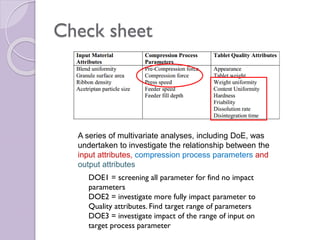
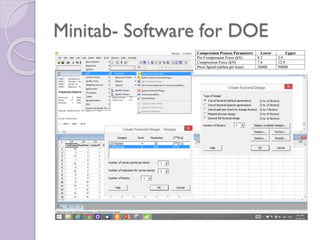
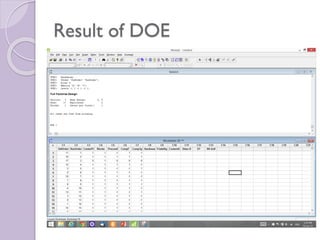
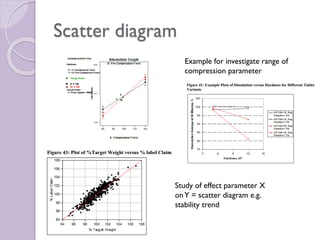
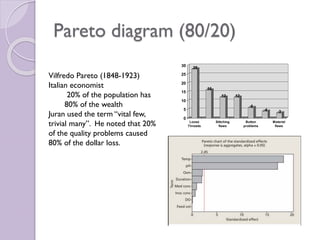
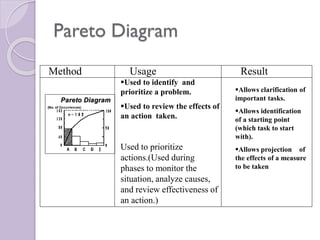
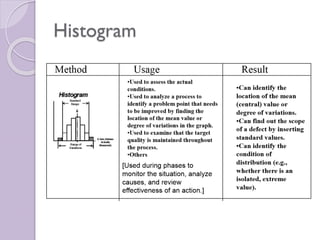
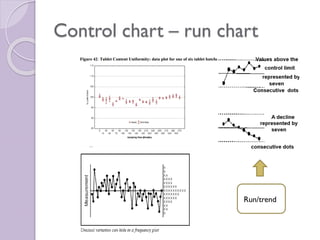
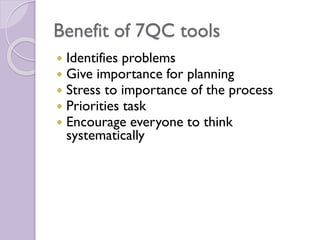

The document discusses using 7QC tools for experiment design and problem solving. It lists 7QC tools like Pareto charts, histograms, process flow diagrams, check sheets, scatter diagrams, control charts, and run charts. These tools can be applied in design of experiments (DOE) to investigate the relationship between input attributes, process parameters, and output attributes. Minitab software can be used for DOE. Results from DOE like scatter diagrams can study the effect of parameters on quality attributes. Pareto charts can identify and prioritize problems, showing that 20% of causes often create 80% of issues. The document gives an example of using these tools to analyze quality problems with ACE tablets.


![7 qc tools[1] to print](https://cdn.slidesharecdn.com/ss_thumbnails/7qctools1toprint-191017092858-thumbnail.jpg?width=640&height=640&fit=bounds)


![7 Quality Control Tools (SQC Model) [MARCH 2009]](https://cdn.slidesharecdn.com/ss_thumbnails/cfakepath7qctools-100630225608-phpapp01-thumbnail.jpg?width=640&height=640&fit=bounds)


![7 qc tools training material[1]](https://cdn.slidesharecdn.com/ss_thumbnails/7qctoolstrainingmaterial1-120925054558-phpapp02-thumbnail.jpg?width=640&height=640&fit=bounds)


![谷歌留痕技术 [ 𝙩𝙤𝙥 𝟮𝟯𝟯. 𝙘 𝙤𝙢 ]](https://cdn.slidesharecdn.com/ss_thumbnails/top233-260130174328-3833018c-thumbnail.jpg?width=640&height=640&fit=bounds)


