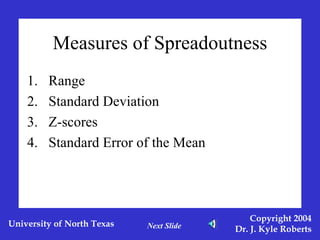
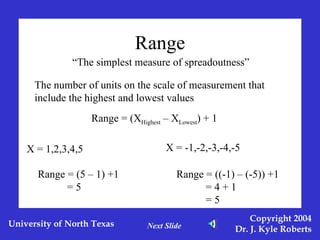
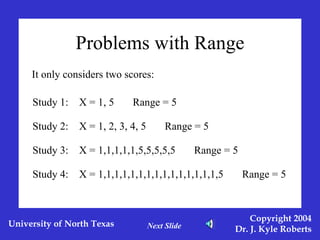
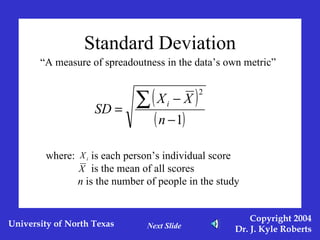
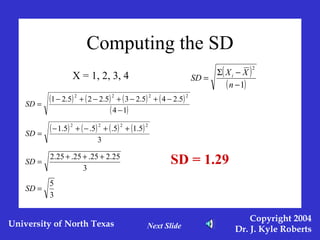
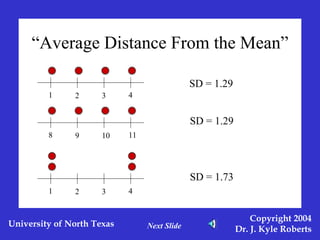
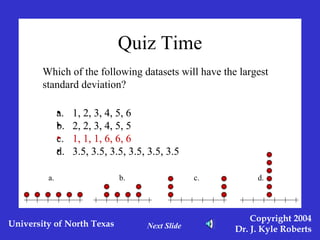
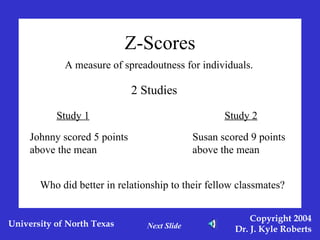
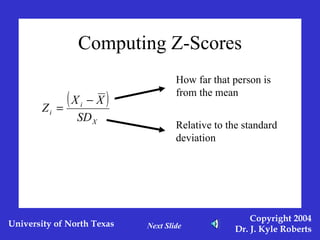
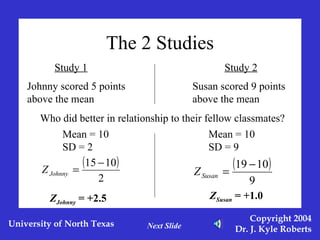
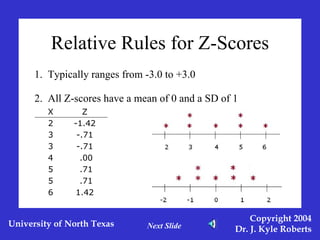
Unit 1: Background to Inferential Statistics Lesson 4:  Measures of Spreadoutness EDER 6010:  Statistics for Educational Research Dr. J. Kyle Roberts University of North Texas Next Slide
Measures of Spreadoutness Range Standard Deviation Z-scores Standard Error of the Mean Next Slide
Range “ The simplest measure of spreadoutness” The number of units on the scale of measurement that include the highest and lowest values Range = (X Highest  – X Lowest ) + 1 X = 1,2,3,4,5 Range = (5 – 1) +1 = 5 X = -1,-2,-3,-4,-5 Range = ((-1) – (-5)) +1 = 4 + 1 = 5 Next Slide
Problems with Range It only considers two scores: Study 2:  X = 1, 2, 3, 4, 5  Range = 5 Study 3:  X = 1,1,1,1,1,5,5,5,5,5  Range = 5 Study 4:  X = 1,1,1,1,1,1,1,1,1,1,1,1,1,1,1,5  Range = 5 Study 1:  X = 1, 5  Range = 5 Next Slide
Standard Deviation “ A measure of spreadoutness in the data’s own metric” Next Slide where:   is each person’s individual score   is the mean of all scores n  is the number of people in the study
Computing the SD X = 1, 2, 3, 4 SD = 1.29 Next Slide
“ Average Distance From the Mean” SD = 1.29 SD = 1.29 SD = 1.73 Next Slide 1 2 3 4 8 9 10 11 1 2 3 4
Quiz Time Which of the following datasets will have the largest standard deviation? 1, 2, 3, 4, 5, 6 2, 2, 3, 4, 5, 5 1, 1, 1, 6, 6, 6 3.5, 3.5, 3.5, 3.5, 3.5, 3.5 1, 2, 3, 4, 5, 6 2, 2, 3, 4, 5, 5 1, 1, 1, 6, 6, 6 3.5, 3.5, 3.5, 3.5, 3.5, 3.5 Next Slide a. b. c. d.
Z-Scores A measure of spreadoutness for individuals. 2 Studies Study 1 Study 2 Johnny scored 5 points above the mean Susan scored 9 points above the mean Who did better in relationship to their fellow classmates? Next Slide
Computing Z-Scores How far that person is from the mean Relative to the standard deviation Next Slide
The 2 Studies Mean = 10 SD = 2 Mean = 10 SD = 9 Z Johnny  = +2.5 Z Susan  = +1.0 Next Slide Study 1 Study 2 Johnny scored 5 points above the mean Susan scored 9 points above the mean Who did better in relationship to their fellow classmates?
Relative Rules for Z-Scores 1.  Typically ranges from -3.0 to +3.0 2.  All Z-scores have a mean of 0 and a SD of 1 Next Slide X 2 3 3 4 5 5 6 Z -1.42 -.71 -.71  .00  .71  .71 1.42
Standard Error of the Mean “The Standard Deviation of the Sampling Distribution” Standard Deviation of X Number of people in the study Used in the construction of “Confidence Intervals” Next Slide
Unit 1: Background to Inferential Statistics Lesson 4:  Measures of Spreadoutness EDER 6010:  Statistics for Educational Research Dr. J. Kyle Roberts University of North Texas

Unit 1 lesson 4

  • 1.
    Unit 1: Backgroundto Inferential Statistics Lesson 4: Measures of Spreadoutness EDER 6010: Statistics for Educational Research Dr. J. Kyle Roberts University of North Texas Next Slide
  • 2.
    Measures of SpreadoutnessRange Standard Deviation Z-scores Standard Error of the Mean Next Slide
  • 3.
    Range “ Thesimplest measure of spreadoutness” The number of units on the scale of measurement that include the highest and lowest values Range = (X Highest – X Lowest ) + 1 X = 1,2,3,4,5 Range = (5 – 1) +1 = 5 X = -1,-2,-3,-4,-5 Range = ((-1) – (-5)) +1 = 4 + 1 = 5 Next Slide
  • 4.
    Problems with RangeIt only considers two scores: Study 2: X = 1, 2, 3, 4, 5 Range = 5 Study 3: X = 1,1,1,1,1,5,5,5,5,5 Range = 5 Study 4: X = 1,1,1,1,1,1,1,1,1,1,1,1,1,1,1,5 Range = 5 Study 1: X = 1, 5 Range = 5 Next Slide
  • 5.
    Standard Deviation “A measure of spreadoutness in the data’s own metric” Next Slide where: is each person’s individual score is the mean of all scores n is the number of people in the study
  • 6.
    Computing the SDX = 1, 2, 3, 4 SD = 1.29 Next Slide
  • 7.
    “ Average DistanceFrom the Mean” SD = 1.29 SD = 1.29 SD = 1.73 Next Slide 1 2 3 4 8 9 10 11 1 2 3 4
  • 8.
    Quiz Time Whichof the following datasets will have the largest standard deviation? 1, 2, 3, 4, 5, 6 2, 2, 3, 4, 5, 5 1, 1, 1, 6, 6, 6 3.5, 3.5, 3.5, 3.5, 3.5, 3.5 1, 2, 3, 4, 5, 6 2, 2, 3, 4, 5, 5 1, 1, 1, 6, 6, 6 3.5, 3.5, 3.5, 3.5, 3.5, 3.5 Next Slide a. b. c. d.
  • 9.
    Z-Scores A measureof spreadoutness for individuals. 2 Studies Study 1 Study 2 Johnny scored 5 points above the mean Susan scored 9 points above the mean Who did better in relationship to their fellow classmates? Next Slide
  • 10.
    Computing Z-Scores Howfar that person is from the mean Relative to the standard deviation Next Slide
  • 11.
    The 2 StudiesMean = 10 SD = 2 Mean = 10 SD = 9 Z Johnny = +2.5 Z Susan = +1.0 Next Slide Study 1 Study 2 Johnny scored 5 points above the mean Susan scored 9 points above the mean Who did better in relationship to their fellow classmates?
  • 12.
    Relative Rules forZ-Scores 1. Typically ranges from -3.0 to +3.0 2. All Z-scores have a mean of 0 and a SD of 1 Next Slide X 2 3 3 4 5 5 6 Z -1.42 -.71 -.71 .00 .71 .71 1.42
  • 13.
    Standard Error ofthe Mean “The Standard Deviation of the Sampling Distribution” Standard Deviation of X Number of people in the study Used in the construction of “Confidence Intervals” Next Slide
  • 14.
    Unit 1: Backgroundto Inferential Statistics Lesson 4: Measures of Spreadoutness EDER 6010: Statistics for Educational Research Dr. J. Kyle Roberts University of North Texas