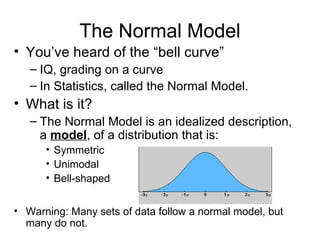
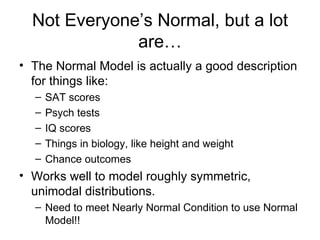
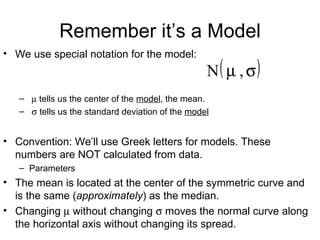
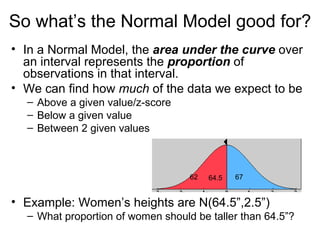
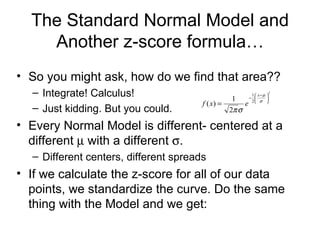
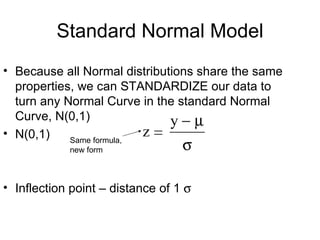
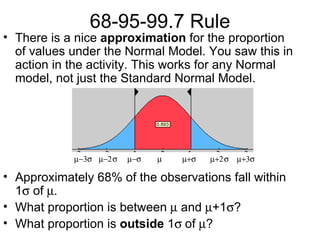
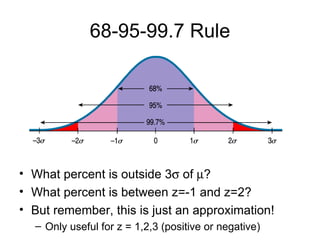
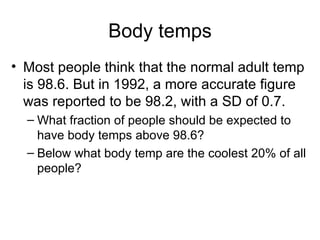
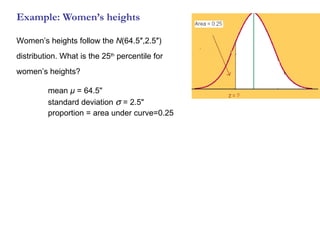
Chapter 3 The Normal Distributions
Chapter 3 Objectives Be able to approximately locate mean and median on a density curve Recognize the Normal distribution, esimate mean and SD by eye Use the 68-95-99.7 Rule Find a z-score and interpret it Given mean and SD, calculate the proportion above or below a z-score, or the proportion between 2 z-scores Given a proportion, be able to calculate the data point with that proportion above or below it.
Describing a Distribution We now have a clear strategy for exploring data on a single quantitative variable: Always plot your data - make a graph. Look for the overall pattern and for striking deviations (outliers, gaps.) Calculate an appropriate numerical summary to briefly describe center and spread
Rulers and measurement We’re going to be spending more time with standard deviation, as a ruler. We’re going to use it as a unit of measure, just like inches, cubits, and so on. This kind Not this kind
Mystery scores… Test 1: Class Mean: 75, Class SD: 7 You scored 2 standard deviations above the mean. What’s your score? Test 2: Class Mean:75, Class SD: 7 You scored a 70. How many SD above/below the mean are you? How should you calculate this?
Z-scores A  Z-score  tells you how many standard deviations above or below a mean a data value is. Remember it this way: It allows us to compare data values, even ones from different data sets.  Important  Formula!!
Who says you can’t compare Apples and Oranges?? Actually, we can. All it takes is a standard deviation. Example: You have an apple and an orange. They each weigh 12 ounces. Which one is bigger? We really mean: which one is  comparatively  bigger? What if I tell you: The apple is 2 standard deviations above the mean apple weight The orange is 1 standard deviation above the mean orange weight.
Placement Exams  What we’re really doing is standardizing variations. An incoming freshman took her college’s placement exams in French and mathematics. She scored: French: 82 Overall mean: 72, SD: 8 Math: 86 Overall mean: 68, SD: 12 On which exam did she do better compared with other freshmen? Explain!
Standardizing Variations Sports:  Joe runs the 100 meter dash 2 seconds faster than average for his school.  (mean: 12s, SD: 1s) Jane jumps 3 feet further in the long jump than average for her school. (mean: 24ft, SD: 2ft) Who’s better at their sport? We need to compare them to the mean for their sport, and then measure how far away from the mean they are, in terms of the spread of the distribution for their sport.
Hmm…Interesting… What makes a z-score interesting?  Points far away from the rest of the data are generally more interesting. Is a z-score of 1 interesting? Standard deviation is usually > IQR for symmetric, so more than 50% of data is within 1 SD of mean. What about a z-score of 3? That’s pretty far out! (remember- 1.5IQR was an outlier. How often do we expect to see big z-scores? To answer this, need to model the data distribution.
What’s a density curve? A: A MODEL that describes a distribution. Gives the overall pattern Area under curve = 1.0 Lots of options for shape
The Normal Model You’ve heard of the “bell curve” IQ, grading on a curve In Statistics, called the Normal Model. What is it? The Normal Model is an idealized description, a  model , of a distribution that is: Symmetric Unimodal Bell-shaped Warning: Many sets of data follow a normal model, but many do not.
Not Everyone’s Normal, but a lot are… The Normal Model is actually a good description for things like: SAT scores Psych tests IQ scores Things in biology, like height and weight Chance outcomes Works well to model roughly symmetric, unimodal distributions. Need to meet Nearly Normal Condition to use Normal Model!!
Remember it’s a Model We use special notation for the model:    tells us the center of the  model , the mean.    tells us the standard deviation of the  model Convention: We’ll use Greek letters for models. These numbers are NOT calculated from data. Parameters The mean is located at the center of the symmetric curve and is the same ( approximately ) as the median. Changing    without changing    moves the normal curve along the horizontal axis without changing its spread.
So what’s the Normal Model good for? In a Normal Model, the  area under the curve  over an interval represents the  proportion  of observations in that interval. We can find how  much  of the data we expect to be  Above a given value/z-score Below a given value Between 2 given values Example: Women’s heights are N(64.5”,2.5”) What proportion of women should be taller than 64.5”? 64.5 67 62
The Standard Normal Model and Another z-score formula… So you might ask, how do we find that area?? Integrate! Calculus! Just kidding. But you could. Every Normal Model is different- centered at a different    with a different   .  Different centers, different spreads If we calculate the z-score for all of our data points, we standardize the curve. Do the same thing with the Model and we get:
Standard Normal Model Because all Normal distributions share the same properties, we can STANDARDIZE our data to turn any Normal Curve in the standard Normal Curve, N(0,1) N(0,1) Inflection point – distance of 1   Same formula, new form
68-95-99.7 Rule There is a nice  approximation  for the proportion of values under the Normal Model. You saw this in action in the activity. This works for any Normal model, not just the Standard Normal Model. Approximately 68% of the observations fall within 1   of   What proportion is between    and   +1  ? What proportion is  outside  1  of   ? 
68-95-99.7 Rule What percent is outside 3   of   ? What percent is between z=-1 and z=2? But remember, this is just an approximation!  Only useful for z = 1,2,3 (positive or negative)
Trees A forester measured 27 trees, finding a mean of 10.4 inches and a SD of 4.7 inches. The trees provide an accurate description for the forest, Normal model. What size are the central 95%? What percent are < 1 inch?  What percent are between 5.7 and 10.4 inches?
But Be Exact Don’t  use the 68-95-99.7 Rule  except for problems with z=1,2,3, where exact answers not needed.  You CAN use: Z-table, Normal Curve Applet, JMP For all of these problems, draw a picture! What percent of a standard Normal model is found: z > -2.05 z < -0.33 1.2 < z < 1.8 | z | < 1.28
IQs Based on the Normal model N(100,16) describing IQ scores, what percent of people’s IQs do you expect to be  Over 80? Under 90? Between 112 and 132?
Example: Gestation time in malnourished mothers What are the effects of better maternal care on gestation time and premies? The goal is to obtain pregnancies of 240 days (8 months) or longer.       What improvement did we get by adding better food?
Reversing the procedure In a standard Normal model, what value(s) of z cut(s) off the region described? The lowest 12% The highest 30% The highest 7% The middle 50% Tip : When using the table, remember to use the area to the  left  of the z you’re looking for.
Body temps Most people think that the normal adult temp is 98.6. But in 1992, a more accurate figure was reported to be 98.2, with a SD of 0.7.  What fraction of people should be expected to have body temps above 98.6? Below what body temp are the coolest 20% of all people?
Example: Women’s heights mean  µ  = 64.5&quot; standard deviation    = 2.5&quot;  proportion = area under curve=0.25 Women’s heights follow the  N (64.5 ″ ,2.5 ″ ) distribution. What is the 25 th  percentile for women’s heights?

Chapter3bps

  • 1.
    Chapter 3 TheNormal Distributions
  • 2.
    Chapter 3 ObjectivesBe able to approximately locate mean and median on a density curve Recognize the Normal distribution, esimate mean and SD by eye Use the 68-95-99.7 Rule Find a z-score and interpret it Given mean and SD, calculate the proportion above or below a z-score, or the proportion between 2 z-scores Given a proportion, be able to calculate the data point with that proportion above or below it.
  • 3.
    Describing a DistributionWe now have a clear strategy for exploring data on a single quantitative variable: Always plot your data - make a graph. Look for the overall pattern and for striking deviations (outliers, gaps.) Calculate an appropriate numerical summary to briefly describe center and spread
  • 4.
    Rulers and measurementWe’re going to be spending more time with standard deviation, as a ruler. We’re going to use it as a unit of measure, just like inches, cubits, and so on. This kind Not this kind
  • 5.
    Mystery scores… Test1: Class Mean: 75, Class SD: 7 You scored 2 standard deviations above the mean. What’s your score? Test 2: Class Mean:75, Class SD: 7 You scored a 70. How many SD above/below the mean are you? How should you calculate this?
  • 6.
    Z-scores A Z-score tells you how many standard deviations above or below a mean a data value is. Remember it this way: It allows us to compare data values, even ones from different data sets. Important Formula!!
  • 7.
    Who says youcan’t compare Apples and Oranges?? Actually, we can. All it takes is a standard deviation. Example: You have an apple and an orange. They each weigh 12 ounces. Which one is bigger? We really mean: which one is comparatively bigger? What if I tell you: The apple is 2 standard deviations above the mean apple weight The orange is 1 standard deviation above the mean orange weight.
  • 8.
    Placement Exams What we’re really doing is standardizing variations. An incoming freshman took her college’s placement exams in French and mathematics. She scored: French: 82 Overall mean: 72, SD: 8 Math: 86 Overall mean: 68, SD: 12 On which exam did she do better compared with other freshmen? Explain!
  • 9.
    Standardizing Variations Sports: Joe runs the 100 meter dash 2 seconds faster than average for his school. (mean: 12s, SD: 1s) Jane jumps 3 feet further in the long jump than average for her school. (mean: 24ft, SD: 2ft) Who’s better at their sport? We need to compare them to the mean for their sport, and then measure how far away from the mean they are, in terms of the spread of the distribution for their sport.
  • 10.
    Hmm…Interesting… What makesa z-score interesting? Points far away from the rest of the data are generally more interesting. Is a z-score of 1 interesting? Standard deviation is usually > IQR for symmetric, so more than 50% of data is within 1 SD of mean. What about a z-score of 3? That’s pretty far out! (remember- 1.5IQR was an outlier. How often do we expect to see big z-scores? To answer this, need to model the data distribution.
  • 11.
    What’s a densitycurve? A: A MODEL that describes a distribution. Gives the overall pattern Area under curve = 1.0 Lots of options for shape
  • 12.
    The Normal ModelYou’ve heard of the “bell curve” IQ, grading on a curve In Statistics, called the Normal Model. What is it? The Normal Model is an idealized description, a model , of a distribution that is: Symmetric Unimodal Bell-shaped Warning: Many sets of data follow a normal model, but many do not.
  • 13.
    Not Everyone’s Normal,but a lot are… The Normal Model is actually a good description for things like: SAT scores Psych tests IQ scores Things in biology, like height and weight Chance outcomes Works well to model roughly symmetric, unimodal distributions. Need to meet Nearly Normal Condition to use Normal Model!!
  • 14.
    Remember it’s aModel We use special notation for the model:  tells us the center of the model , the mean.  tells us the standard deviation of the model Convention: We’ll use Greek letters for models. These numbers are NOT calculated from data. Parameters The mean is located at the center of the symmetric curve and is the same ( approximately ) as the median. Changing  without changing  moves the normal curve along the horizontal axis without changing its spread.
  • 15.
    So what’s theNormal Model good for? In a Normal Model, the area under the curve over an interval represents the proportion of observations in that interval. We can find how much of the data we expect to be Above a given value/z-score Below a given value Between 2 given values Example: Women’s heights are N(64.5”,2.5”) What proportion of women should be taller than 64.5”? 64.5 67 62
  • 16.
    The Standard NormalModel and Another z-score formula… So you might ask, how do we find that area?? Integrate! Calculus! Just kidding. But you could. Every Normal Model is different- centered at a different  with a different  . Different centers, different spreads If we calculate the z-score for all of our data points, we standardize the curve. Do the same thing with the Model and we get:
  • 17.
    Standard Normal ModelBecause all Normal distributions share the same properties, we can STANDARDIZE our data to turn any Normal Curve in the standard Normal Curve, N(0,1) N(0,1) Inflection point – distance of 1  Same formula, new form
  • 18.
    68-95-99.7 Rule Thereis a nice approximation for the proportion of values under the Normal Model. You saw this in action in the activity. This works for any Normal model, not just the Standard Normal Model. Approximately 68% of the observations fall within 1  of  What proportion is between  and  +1  ? What proportion is outside 1  of  ? 
  • 19.
    68-95-99.7 Rule Whatpercent is outside 3  of  ? What percent is between z=-1 and z=2? But remember, this is just an approximation! Only useful for z = 1,2,3 (positive or negative)
  • 20.
    Trees A forestermeasured 27 trees, finding a mean of 10.4 inches and a SD of 4.7 inches. The trees provide an accurate description for the forest, Normal model. What size are the central 95%? What percent are < 1 inch? What percent are between 5.7 and 10.4 inches?
  • 21.
    But Be ExactDon’t use the 68-95-99.7 Rule except for problems with z=1,2,3, where exact answers not needed. You CAN use: Z-table, Normal Curve Applet, JMP For all of these problems, draw a picture! What percent of a standard Normal model is found: z > -2.05 z < -0.33 1.2 < z < 1.8 | z | < 1.28
  • 22.
    IQs Based onthe Normal model N(100,16) describing IQ scores, what percent of people’s IQs do you expect to be Over 80? Under 90? Between 112 and 132?
  • 23.
    Example: Gestation timein malnourished mothers What are the effects of better maternal care on gestation time and premies? The goal is to obtain pregnancies of 240 days (8 months) or longer.       What improvement did we get by adding better food?
  • 24.
    Reversing the procedureIn a standard Normal model, what value(s) of z cut(s) off the region described? The lowest 12% The highest 30% The highest 7% The middle 50% Tip : When using the table, remember to use the area to the left of the z you’re looking for.
  • 25.
    Body temps Mostpeople think that the normal adult temp is 98.6. But in 1992, a more accurate figure was reported to be 98.2, with a SD of 0.7. What fraction of people should be expected to have body temps above 98.6? Below what body temp are the coolest 20% of all people?
  • 26.
    Example: Women’s heightsmean µ = 64.5&quot; standard deviation  = 2.5&quot; proportion = area under curve=0.25 Women’s heights follow the N (64.5 ″ ,2.5 ″ ) distribution. What is the 25 th percentile for women’s heights?

Editor's Notes

  • #24 Now, this will become more apparent later on in the class, but the cool thing about standardizing is that it allows you to compare across different scales. Remember we started out the day using gestation time as an example. Women who are malnourished risk have premature babies, and studies are being done to see whether different diet and vitamin supplements work better. Let’s say the goal is to get them to carry the baby at least 240 days (8 months). For treatment 1, say vitamins only, get normal distribution with mean 250, sd is 20. Treatment 2 is vitamins plus a meals on wheels program. Mean is 266, sd 15 . The mean is increased, but the spread has changed too. You can eyeball this and see that more of the women in treatment two are above our goal of 240 days, but how much of an improvement is it?