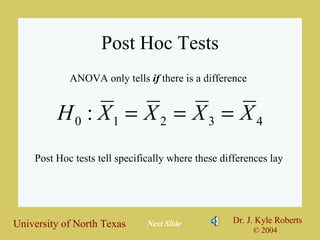
Unit 6:  Analysis of Variance (ANOVA) Lesson 2:  Computing Post Hoc Tests and Effect Sizes EDER 6010:  Statistics for Educational Research Dr. J. Kyle Roberts University of North Texas I know they’re different, but where?? Next Slide
Post Hoc Tests ANOVA only tells  if  there is a difference Post Hoc tests tell specifically where these differences lay Next Slide
Running Post Hocs in SPSS 2 Variables: Grouping Variable Score Variable Next Slide 5 3 8 7 7 1 5 7 7 2 3 8 8 5 9 7 8 6 7 9 White Hispanic Black Asian
Running an ANOVA in SPSS Analyze  Compare Means  One-Way ANOVA Next Slide
SPSS Output for Post Hoc Tests Next Slide
Effect Size Measures Next Slide Eta-squared – the percent variance accounted for by the factor (way) of the dependent variable How good is our way at describing the variation in the dependent variable?
Effect Size  2  = .513 Percent variance explained Next Slide Score variable SS = 101.80 Ethnicity SS = 52.20
Unit 6:  Analysis of Variance (ANOVA) Lesson 2:  Computing Post Hoc Tests and Effect Sizes EDER 6010:  Statistics for Educational Research Dr. J. Kyle Roberts University of North Texas I know they’re different, but where??

Unit 6 lesson 2

  • 1.
    Unit 6: Analysis of Variance (ANOVA) Lesson 2: Computing Post Hoc Tests and Effect Sizes EDER 6010: Statistics for Educational Research Dr. J. Kyle Roberts University of North Texas I know they’re different, but where?? Next Slide
  • 2.
    Post Hoc TestsANOVA only tells if there is a difference Post Hoc tests tell specifically where these differences lay Next Slide
  • 3.
    Running Post Hocsin SPSS 2 Variables: Grouping Variable Score Variable Next Slide 5 3 8 7 7 1 5 7 7 2 3 8 8 5 9 7 8 6 7 9 White Hispanic Black Asian
  • 4.
    Running an ANOVAin SPSS Analyze  Compare Means  One-Way ANOVA Next Slide
  • 5.
    SPSS Output forPost Hoc Tests Next Slide
  • 6.
    SPSS Output forPost Hoc Tests Next Slide
  • 7.
    Effect Size MeasuresNext Slide Eta-squared – the percent variance accounted for by the factor (way) of the dependent variable How good is our way at describing the variation in the dependent variable?
  • 8.
    Effect Size 2 = .513 Percent variance explained Next Slide Score variable SS = 101.80 Ethnicity SS = 52.20
  • 9.
    Unit 6: Analysis of Variance (ANOVA) Lesson 2: Computing Post Hoc Tests and Effect Sizes EDER 6010: Statistics for Educational Research Dr. J. Kyle Roberts University of North Texas I know they’re different, but where??