SlideShare a Scribd company logo
1 of 6
Name ___________________________________ Date __________________
Mrs. Labuski / Mrs. Portsmore Period __________ Unit 12 Lesson 5B Measure of
Variability OC 7-3
VOCABULARY DEFINITION EXAMPLE
interquartile
range (IQR)
a measure of variability.
the difference of the upper
quartile and the lower quartile.
see below
mean
absolute
deviation
(MAD)
Another measure of variability.
The mean distance between each
data value and the mean of the
data set.
see below
Find the IQR for the data sets from yesterday’s notes.
A.
B.
Find the IQR for the data sets.
A IQR = Upper quartile – Lower quartile =
61.5 – 57 = 4.5
B IQR = Upper quartile – Lower quartile =
52 – 46 = 6
Compare the IQRs. How do the IQRs describe the distribution of the heights in each group?
The IQR in B is greater; the heights in the middle half of B are more spread out than in
A.
Find the MAD for the data sets in A.
60, 58, 54, 56, 63, 61, 65, 61, 62, 59, 56, 58
Step 1 Find the mean. Round to the nearest whole number.
Step 2 Complete the table.
Step 3 To calculate the MAD, find the mean of the values in the second row of the table. Round
to the nearest whole number.
Find the MAD for the data sets in B.
46, 47, 48, 48, 56, 48, 46, 52, 57, 52, 45
Step 1 Find the mean. Round to the nearest whole
number.
Step 2 Complete the table.
Step 3 To calculate the MAD, find the mean of the values in the second row of the table. Round
to the nearest whole number.
Compare the MADs. How do the MADs describe the distribution of the heights in each group?
The MAD in B is greater; in general, the heights in B are farther from the mean than the
heights in A.
Name ___________________________________ Date __________________
Mrs. Labuski / Mrs. Portsmore Period __________ Unit 12 Lesson 5B Measure of
Variability OC 7-3
VOCABULARY DEFINITION EXAMPLE
interquartile
range (IQR)
see below
mean
absolute
deviation
(MAD)
see below
Find the IQR for the data sets from yesterday’s notes.
A.
B.
A IQR = Upper quartile – Lower quartile =
___________ – ___________ = ___________
B IQR = Upper quartile – Lower quartile =
___________ – ___________ = ___________
Compare the IQRs. How do the IQRs describe the distribution of the heights in each group?
_____________________________________________________________________________
_____________________________________________________________________________
Find the MAD for the data sets in A.
60, 58, 54, 56, 63, 61, 65, 61, 62, 59, 56, 58
Step 1 Find the mean. Round to the nearest whole number.
Step 2 Complete the table.
Step 3 To calculate the MAD, find the mean of the values in the second row of the table. Round
to the nearest whole number.
Find the MAD for the data sets in B.
46, 47, 48, 48, 56, 48, 46, 52, 57, 52, 45
Step 1 Find the mean. Round to the nearest whole number.
Step 2 Complete the table.
Step 3 To calculate the MAD, find the mean of the values in the second row of the table.
Round to the nearest whole number.
Compare the MADs. How do the MADs describe the distribution of the heights in each group?
_____________________________________________________________________________
_____________________________________________________________________________

More Related Content

Viewers also liked

English 2 - Module 1 lesson 1.3
English 2 - Module 1 lesson 1.3English 2 - Module 1 lesson 1.3
English 2 - Module 1 lesson 1.3Mondstrahl
 
Module 1 lesson 1.1
Module 1 lesson 1.1Module 1 lesson 1.1
Module 1 lesson 1.1Mondstrahl
 
English 2- Module 6 lesson 1
English 2-  Module 6 lesson 1English 2-  Module 6 lesson 1
English 2- Module 6 lesson 1Mondstrahl
 
English 2 - Module 2 lesson 1.1
English 2 - Module 2 lesson 1.1English 2 - Module 2 lesson 1.1
English 2 - Module 2 lesson 1.1Mondstrahl
 
Module 1 lesson 1.2
Module 1 lesson 1.2Module 1 lesson 1.2
Module 1 lesson 1.2Mondstrahl
 
Box And Whisker Plots
Box And Whisker PlotsBox And Whisker Plots
Box And Whisker PlotsWendiBrown
 
Measures of variability and range for ungrouped data
Measures of variability and range for ungrouped dataMeasures of variability and range for ungrouped data
Measures of variability and range for ungrouped dataSamanie M
 
Measures of variability
Measures of variabilityMeasures of variability
Measures of variabilityMark Santos
 
Lesson Plan- Measures of Central tendency of Data
Lesson Plan- Measures of Central tendency of DataLesson Plan- Measures of Central tendency of Data
Lesson Plan- Measures of Central tendency of DataElton John Embodo
 
Standard deviation
Standard deviationStandard deviation
Standard deviationKen Plummer
 
Standard deviation (3)
Standard deviation (3)Standard deviation (3)
Standard deviation (3)Sonali Prasad
 
Lesson plan 9th grade junior high school
Lesson plan 9th grade junior high schoolLesson plan 9th grade junior high school
Lesson plan 9th grade junior high schoolRahma Siska Utari
 
Mathematics 10 Learner’s Material Unit 4
Mathematics 10 Learner’s Material Unit 4Mathematics 10 Learner’s Material Unit 4
Mathematics 10 Learner’s Material Unit 4PRINTDESK by Dan
 
Writing a playscript
Writing a playscriptWriting a playscript
Writing a playscriptfknights
 

Viewers also liked (20)

English 2 - Module 1 lesson 1.3
English 2 - Module 1 lesson 1.3English 2 - Module 1 lesson 1.3
English 2 - Module 1 lesson 1.3
 
Module 1 lesson 1.1
Module 1 lesson 1.1Module 1 lesson 1.1
Module 1 lesson 1.1
 
English 2- Module 6 lesson 1
English 2-  Module 6 lesson 1English 2-  Module 6 lesson 1
English 2- Module 6 lesson 1
 
English 2 - Module 2 lesson 1.1
English 2 - Module 2 lesson 1.1English 2 - Module 2 lesson 1.1
English 2 - Module 2 lesson 1.1
 
essay writing
essay writingessay writing
essay writing
 
Module 1 lesson 1.2
Module 1 lesson 1.2Module 1 lesson 1.2
Module 1 lesson 1.2
 
Box And Whisker Plots
Box And Whisker PlotsBox And Whisker Plots
Box And Whisker Plots
 
Measures of variability and range for ungrouped data
Measures of variability and range for ungrouped dataMeasures of variability and range for ungrouped data
Measures of variability and range for ungrouped data
 
Lesson plan (quadrilaterals)
Lesson plan (quadrilaterals)Lesson plan (quadrilaterals)
Lesson plan (quadrilaterals)
 
Measures of variability
Measures of variabilityMeasures of variability
Measures of variability
 
Measures of Variation
Measures of VariationMeasures of Variation
Measures of Variation
 
Measures of Variability
Measures of VariabilityMeasures of Variability
Measures of Variability
 
Quartile Deviation
Quartile DeviationQuartile Deviation
Quartile Deviation
 
Mathematics K to 12 Curriculum Guide
Mathematics K to 12 Curriculum GuideMathematics K to 12 Curriculum Guide
Mathematics K to 12 Curriculum Guide
 
Lesson Plan- Measures of Central tendency of Data
Lesson Plan- Measures of Central tendency of DataLesson Plan- Measures of Central tendency of Data
Lesson Plan- Measures of Central tendency of Data
 
Standard deviation
Standard deviationStandard deviation
Standard deviation
 
Standard deviation (3)
Standard deviation (3)Standard deviation (3)
Standard deviation (3)
 
Lesson plan 9th grade junior high school
Lesson plan 9th grade junior high schoolLesson plan 9th grade junior high school
Lesson plan 9th grade junior high school
 
Mathematics 10 Learner’s Material Unit 4
Mathematics 10 Learner’s Material Unit 4Mathematics 10 Learner’s Material Unit 4
Mathematics 10 Learner’s Material Unit 4
 
Writing a playscript
Writing a playscriptWriting a playscript
Writing a playscript
 

More from mlabuski

Quiz week 1 & 2 study guide
Quiz week 1 & 2 study guideQuiz week 1 & 2 study guide
Quiz week 1 & 2 study guidemlabuski
 
Quiz week 1 & 2 practice
Quiz week 1 & 2 practiceQuiz week 1 & 2 practice
Quiz week 1 & 2 practicemlabuski
 
Welcome to social studies
Welcome to social studiesWelcome to social studies
Welcome to social studiesmlabuski
 
Team orion supply list 15 16
Team orion supply list 15 16Team orion supply list 15 16
Team orion supply list 15 16mlabuski
 
Literature letter graphic organizer
Literature letter graphic organizerLiterature letter graphic organizer
Literature letter graphic organizermlabuski
 
Team orion supply list 15 16
Team orion supply list 15 16Team orion supply list 15 16
Team orion supply list 15 16mlabuski
 
Literature letters revised
Literature letters revisedLiterature letters revised
Literature letters revisedmlabuski
 
Final exam review sheet # 2 2015
Final exam review sheet # 2 2015Final exam review sheet # 2 2015
Final exam review sheet # 2 2015mlabuski
 
Final exam review sheet # 3 2015
Final exam review sheet # 3 2015Final exam review sheet # 3 2015
Final exam review sheet # 3 2015mlabuski
 
Final exam review sheet # 1 2015
Final exam review sheet # 1 2015Final exam review sheet # 1 2015
Final exam review sheet # 1 2015mlabuski
 
Lessons 12 13 merged
Lessons 12 13 mergedLessons 12 13 merged
Lessons 12 13 mergedmlabuski
 
Mod 5 lesson 12 13
Mod 5 lesson 12 13Mod 5 lesson 12 13
Mod 5 lesson 12 13mlabuski
 
G6 m5-c-lesson 13-t
G6 m5-c-lesson 13-tG6 m5-c-lesson 13-t
G6 m5-c-lesson 13-tmlabuski
 
G6 m5-c-lesson 13-s
G6 m5-c-lesson 13-sG6 m5-c-lesson 13-s
G6 m5-c-lesson 13-smlabuski
 
G6 m5-c-lesson 12-t
G6 m5-c-lesson 12-tG6 m5-c-lesson 12-t
G6 m5-c-lesson 12-tmlabuski
 
G6 m5-c-lesson 12-s
G6 m5-c-lesson 12-sG6 m5-c-lesson 12-s
G6 m5-c-lesson 12-smlabuski
 
Mod 5 lesson 9
Mod 5 lesson 9Mod 5 lesson 9
Mod 5 lesson 9mlabuski
 
G6 m5-b-lesson 9-t
G6 m5-b-lesson 9-tG6 m5-b-lesson 9-t
G6 m5-b-lesson 9-tmlabuski
 
G6 m5-b-lesson 9-s
G6 m5-b-lesson 9-sG6 m5-b-lesson 9-s
G6 m5-b-lesson 9-smlabuski
 
Mod 5 lesson 8
Mod 5 lesson 8Mod 5 lesson 8
Mod 5 lesson 8mlabuski
 

More from mlabuski (20)

Quiz week 1 & 2 study guide
Quiz week 1 & 2 study guideQuiz week 1 & 2 study guide
Quiz week 1 & 2 study guide
 
Quiz week 1 & 2 practice
Quiz week 1 & 2 practiceQuiz week 1 & 2 practice
Quiz week 1 & 2 practice
 
Welcome to social studies
Welcome to social studiesWelcome to social studies
Welcome to social studies
 
Team orion supply list 15 16
Team orion supply list 15 16Team orion supply list 15 16
Team orion supply list 15 16
 
Literature letter graphic organizer
Literature letter graphic organizerLiterature letter graphic organizer
Literature letter graphic organizer
 
Team orion supply list 15 16
Team orion supply list 15 16Team orion supply list 15 16
Team orion supply list 15 16
 
Literature letters revised
Literature letters revisedLiterature letters revised
Literature letters revised
 
Final exam review sheet # 2 2015
Final exam review sheet # 2 2015Final exam review sheet # 2 2015
Final exam review sheet # 2 2015
 
Final exam review sheet # 3 2015
Final exam review sheet # 3 2015Final exam review sheet # 3 2015
Final exam review sheet # 3 2015
 
Final exam review sheet # 1 2015
Final exam review sheet # 1 2015Final exam review sheet # 1 2015
Final exam review sheet # 1 2015
 
Lessons 12 13 merged
Lessons 12 13 mergedLessons 12 13 merged
Lessons 12 13 merged
 
Mod 5 lesson 12 13
Mod 5 lesson 12 13Mod 5 lesson 12 13
Mod 5 lesson 12 13
 
G6 m5-c-lesson 13-t
G6 m5-c-lesson 13-tG6 m5-c-lesson 13-t
G6 m5-c-lesson 13-t
 
G6 m5-c-lesson 13-s
G6 m5-c-lesson 13-sG6 m5-c-lesson 13-s
G6 m5-c-lesson 13-s
 
G6 m5-c-lesson 12-t
G6 m5-c-lesson 12-tG6 m5-c-lesson 12-t
G6 m5-c-lesson 12-t
 
G6 m5-c-lesson 12-s
G6 m5-c-lesson 12-sG6 m5-c-lesson 12-s
G6 m5-c-lesson 12-s
 
Mod 5 lesson 9
Mod 5 lesson 9Mod 5 lesson 9
Mod 5 lesson 9
 
G6 m5-b-lesson 9-t
G6 m5-b-lesson 9-tG6 m5-b-lesson 9-t
G6 m5-b-lesson 9-t
 
G6 m5-b-lesson 9-s
G6 m5-b-lesson 9-sG6 m5-b-lesson 9-s
G6 m5-b-lesson 9-s
 
Mod 5 lesson 8
Mod 5 lesson 8Mod 5 lesson 8
Mod 5 lesson 8
 

IQR and MAD Lesson

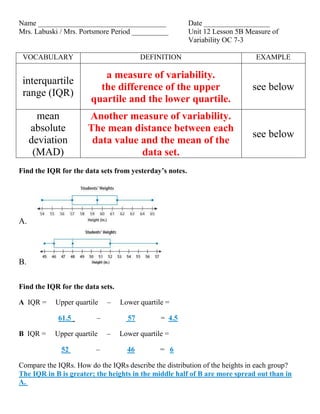
  • 1. Name ___________________________________ Date __________________ Mrs. Labuski / Mrs. Portsmore Period __________ Unit 12 Lesson 5B Measure of Variability OC 7-3 VOCABULARY DEFINITION EXAMPLE interquartile range (IQR) a measure of variability. the difference of the upper quartile and the lower quartile. see below mean absolute deviation (MAD) Another measure of variability. The mean distance between each data value and the mean of the data set. see below Find the IQR for the data sets from yesterday’s notes. A. B. Find the IQR for the data sets. A IQR = Upper quartile – Lower quartile = 61.5 – 57 = 4.5 B IQR = Upper quartile – Lower quartile = 52 – 46 = 6 Compare the IQRs. How do the IQRs describe the distribution of the heights in each group? The IQR in B is greater; the heights in the middle half of B are more spread out than in A.
  • 2. Find the MAD for the data sets in A. 60, 58, 54, 56, 63, 61, 65, 61, 62, 59, 56, 58 Step 1 Find the mean. Round to the nearest whole number. Step 2 Complete the table. Step 3 To calculate the MAD, find the mean of the values in the second row of the table. Round to the nearest whole number.
  • 3. Find the MAD for the data sets in B. 46, 47, 48, 48, 56, 48, 46, 52, 57, 52, 45 Step 1 Find the mean. Round to the nearest whole number. Step 2 Complete the table. Step 3 To calculate the MAD, find the mean of the values in the second row of the table. Round to the nearest whole number. Compare the MADs. How do the MADs describe the distribution of the heights in each group? The MAD in B is greater; in general, the heights in B are farther from the mean than the heights in A.
  • 4. Name ___________________________________ Date __________________ Mrs. Labuski / Mrs. Portsmore Period __________ Unit 12 Lesson 5B Measure of Variability OC 7-3 VOCABULARY DEFINITION EXAMPLE interquartile range (IQR) see below mean absolute deviation (MAD) see below Find the IQR for the data sets from yesterday’s notes. A. B. A IQR = Upper quartile – Lower quartile = ___________ – ___________ = ___________ B IQR = Upper quartile – Lower quartile = ___________ – ___________ = ___________ Compare the IQRs. How do the IQRs describe the distribution of the heights in each group? _____________________________________________________________________________ _____________________________________________________________________________
  • 5. Find the MAD for the data sets in A. 60, 58, 54, 56, 63, 61, 65, 61, 62, 59, 56, 58 Step 1 Find the mean. Round to the nearest whole number. Step 2 Complete the table. Step 3 To calculate the MAD, find the mean of the values in the second row of the table. Round to the nearest whole number.
  • 6. Find the MAD for the data sets in B. 46, 47, 48, 48, 56, 48, 46, 52, 57, 52, 45 Step 1 Find the mean. Round to the nearest whole number. Step 2 Complete the table. Step 3 To calculate the MAD, find the mean of the values in the second row of the table. Round to the nearest whole number. Compare the MADs. How do the MADs describe the distribution of the heights in each group? _____________________________________________________________________________ _____________________________________________________________________________