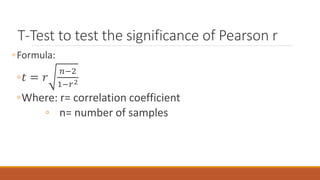
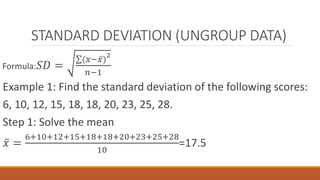
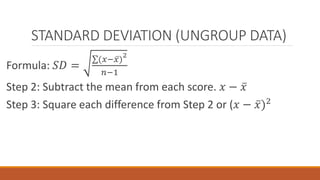
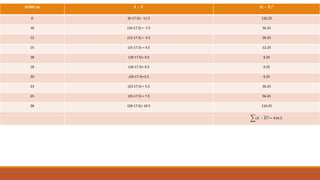
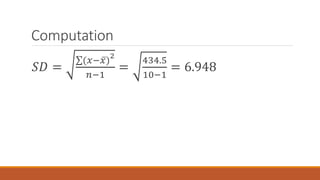
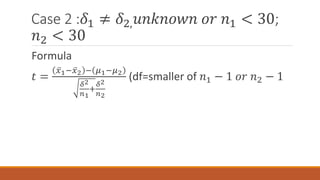
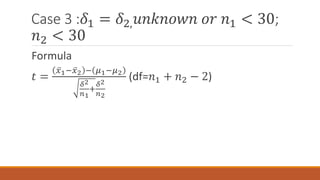
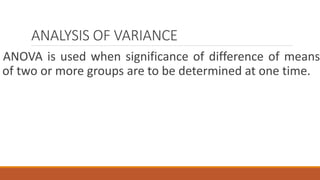
This document discusses strategies for analyzing collected data, including descriptive and inferential statistics. Descriptive statistics like measures of central tendency (mean, median, mode) and dispersion (range, standard deviation) are used to summarize and describe data. Inferential statistics like t-tests, ANOVA, and tests of correlation can analyze relationships, differences between groups, and make generalizations from samples to populations. The document provides formulas and examples of how to calculate and interpret various statistical measures.
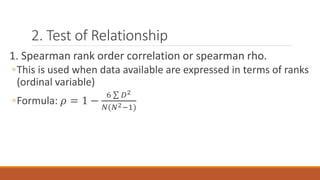
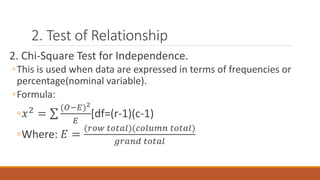
An Overview of Chapter 3 - Research Methodologyschool
This powerpoint presentation contains a brief overview of the contents of Chapter 3 or Research Methodology. You can also find a sample that shows the different components of Chapter 3.
Kindly hit the like and subscribe buttons, thank you.
Chapter 2. Identifying the inquiry and stating the problem (Practical Researc...Cristy Ann Subala
The learner...
1. designs a research useful in daily life. CS_RS12-Id-e-1
2. writes a research title. CS_RS12-Id-e-2
3. describes background of research. CS_RS12-Id-e-3
4. states research questions. CS_RS12-Id-e-4
5. indicates scope and delimitation of study. CS_RS12-Id-e-5
6. cites benefits and beneficiaries of study . CS_RS12-Id-e-6
7. presents written statement of the problem . CS_RS12-Id-e-7
1. Illustrate the t-distribution.
2. Construct the t-distribution.
3. Identify regions under the t-distribution corresponding to different values.
4. Identify percentiles using the t-table.
Visit the website for more services it can offer: https://cristinamontenegro92.wixsite.com/onevs
Practical Research 2 (Quantitative Research)Nheru Veraflor
Introduction to Practical Research 2 (Quantitative Research) for Senior High School. This includes lesson on Scientific Process, Characteristic of Quantitative Research and Types of Variables.
STANDARD DEVIATION (2018) (STATISTICS)sumanmathews
THIS IS A QUICK AND EASY METHOD TO LEARN STANDARD DEVIATION FOR DISCRETE AND GROUPED FREQUENCY DISTRIBUTION.
IT GIVES A STEP BY STEP, SIMPLE EXPLANATION OF PROBLEMS WITH FORMULAE.
SO WATCH THE ENTIRE VIDEO TODAY.
Please Subscribe to this Channel for more solutions and lectures
http://www.youtube.com/onlineteaching
Chapter 3: Describing, Exploring, and Comparing Data
3.1: Measures of Center
Please Subscribe to this Channel for more solutions and lectures
http://www.youtube.com/onlineteaching
Chapter 9: Inferences from Two Samples
9.2: Two Means, Independent Samples
In general, a factorial experiment involves several variables.
One variable is the response variable, which is sometimes called the outcome variable or the dependent variable.
The other variables are called factors.
How to Create Map Views in the Odoo 17 ERPCeline George
The map views are useful for providing a geographical representation of data. They allow users to visualize and analyze the data in a more intuitive manner.
Synthetic Fiber Construction in lab .pptxPavel ( NSTU)
Synthetic fiber production is a fascinating and complex field that blends chemistry, engineering, and environmental science. By understanding these aspects, students can gain a comprehensive view of synthetic fiber production, its impact on society and the environment, and the potential for future innovations. Synthetic fibers play a crucial role in modern society, impacting various aspects of daily life, industry, and the environment. ynthetic fibers are integral to modern life, offering a range of benefits from cost-effectiveness and versatility to innovative applications and performance characteristics. While they pose environmental challenges, ongoing research and development aim to create more sustainable and eco-friendly alternatives. Understanding the importance of synthetic fibers helps in appreciating their role in the economy, industry, and daily life, while also emphasizing the need for sustainable practices and innovation.
How to Make a Field invisible in Odoo 17Celine George
It is possible to hide or invisible some fields in odoo. Commonly using “invisible” attribute in the field definition to invisible the fields. This slide will show how to make a field invisible in odoo 17.
Instructions for Submissions thorugh G- Classroom.pptxJheel Barad
This presentation provides a briefing on how to upload submissions and documents in Google Classroom. It was prepared as part of an orientation for new Sainik School in-service teacher trainees. As a training officer, my goal is to ensure that you are comfortable and proficient with this essential tool for managing assignments and fostering student engagement.
How to Split Bills in the Odoo 17 POS ModuleCeline George
Bills have a main role in point of sale procedure. It will help to track sales, handling payments and giving receipts to customers. Bill splitting also has an important role in POS. For example, If some friends come together for dinner and if they want to divide the bill then it is possible by POS bill splitting. This slide will show how to split bills in odoo 17 POS.
The French Revolution, which began in 1789, was a period of radical social and political upheaval in France. It marked the decline of absolute monarchies, the rise of secular and democratic republics, and the eventual rise of Napoleon Bonaparte. This revolutionary period is crucial in understanding the transition from feudalism to modernity in Europe.
For more information, visit-www.vavaclasses.com
This is a presentation by Dada Robert in a Your Skill Boost masterclass organised by the Excellence Foundation for South Sudan (EFSS) on Saturday, the 25th and Sunday, the 26th of May 2024.
He discussed the concept of quality improvement, emphasizing its applicability to various aspects of life, including personal, project, and program improvements. He defined quality as doing the right thing at the right time in the right way to achieve the best possible results and discussed the concept of the "gap" between what we know and what we do, and how this gap represents the areas we need to improve. He explained the scientific approach to quality improvement, which involves systematic performance analysis, testing and learning, and implementing change ideas. He also highlighted the importance of client focus and a team approach to quality improvement.
3. INTRODUCTION
When the necessary data have been collected, the next step
is to organize the raw data for data analysis.
It is important that the researcher is assured of the quality
of the data for accuracy, consistency, completeness and
systematic arrangement to facilitate coding and tabulation.
4. Purpose of Data Analysis Plan
1. describe data sets
2. determine the degree of relationship of variables.
3. determine the differences between variables.
4. predict outcomes
5. compare variables.
5. DATA ANALYSIS STRATEGIES
1. Exploratory Data Analysis
◦This type of data analysis is used when it is not clear
what to expect from the data. This strategy uses
numerical and visual presentations such as graphs.
6. DATA ANALYSIS STRATEGIES
2. Descriptive Data Analysis
◦This type of data analysis is used to described, show or
summarize data in a meaningful way, leading to a simple
interpretation of data.
◦The commonly used data analysis tools for descriptive
statistics are frequency, percentage, measures of central
tendency and measures of dispersion.
7. DATA ANALYSIS STRATEGIES
3. Inferential Data Analysis
◦Inferential statistics tests hypothesis about a set of data to
reach conclusions or make generalizations beyond merely
describing the data.
◦Inferential statistics include test of significant difference
such as t-test, Analysis of variance (ANOVA) and test of
relationship such as Pearson Product Moment of
Correlation, Spearman rho, linear regression and chi-
square test.
8. DESCRIPTIVE DATA ANALYSIS
1. MEASURES OF CENTRAL TENDENCY
◦A. Mean –often called the arithmetic average of a set of
data.
◦The symbol 𝑋 (x bar) is used to denote the arithmetic
mean.
◦Formula: 𝑋 =
𝑥
𝑛
9. DESCRIPTIVE DATA ANALYSIS
MEAN FOR UNGROUPED DATA
◦1. Find the mean of the measurement 18, 26, 27, 29 30.
◦Formula: 𝑋 =
𝑥
𝑛
=
18+26+27+29+30
5
=
130
5
=26
10. Example 2: Find the mean of the
following.
SCORES IN NATIONAL ACHIEVMENT TEST
90 95 96 87 110
102 95 98 87 117
115 96 91 95 95
93 105 86 103 106
11. Mean of Grouped Data
When the observations are grouped into classes.
𝑋 =
𝑓𝑥
𝑛
Where: f= frequency
◦ x= numerical value or item in a set of data.
n = number of observations in the data set.
12. Example 1: Find the mean of the height of 50
senior high school students summarized as
follows.
Heights( in inches) Frequency Height x frequency
56 6 336
57 15 855
58 12 696
59 8 472
60 5 300
61 2 122
62 2 124
𝑓 = 50 𝑓𝑥 = 2905
14. Example 2: Solve for the mean of the
data below.
Solve for the mean of the data below.
Class Frequency (f) Class Midpoint (x) fx
76-80 3 78 234
71-75 5 73 365
66-70 6 68 408
61-65 8 63 504
56-60 10 58 580
51-55 7 53 371
46-50 7 48 336
41-45 3 43 129
36-40 1 38 38
TOTAL 50 2965
16. Measures of Dispersion
Refers to the extent of spread of the scores.
The measures of dispersion are the range, average
deviation, standard deviation and variance.
17. The RANGE
It is the difference between the highest score and the
lowest score in a set of data.
Example: Find the range of the following data:
6, 10, 12, 15, 18, 18, 20, 23, 25, 28
The range is 22.
18. AVERAGE DEVIATION
This measure of spread is defined as the absolute difference
or deviation between the values in a set of data and the
mean, divided by the total number of values in the set of
data.
19. AVERAGE DEVIATION (UNGROUPED
DATA)
Formula:
◦𝐴𝐷 =
𝑥− 𝑥
𝑛
◦Example: Find the average deviation of the following
scores 20, 25, 35, 40, 45.
◦𝐴𝐷 =
20−33 + 25−33 + 35−33 + 40−33 + 45−33
5
◦𝐴𝐷 =
−13 + −8 + 2 + 7 + 12
5
=8.4
20. EXAMPLE 2
A set of observations consists of 22, 60, 75, 85, 98.
Find the average deviation.
21. STANDARD DEVIATION
The standard deviation (SD) is a measure of the spread
or variation of data about the mean.
SD is computed by calculating the average distance that
the average value is from the mean.
22. STANDARD DEVIATION (UNGROUP DATA)
Formula: 𝑆𝐷 =
(𝑥− 𝑥)
2
𝑛−1
Example 1: Find the standard deviation of the following scores:
6, 10, 12, 15, 18, 18, 20, 23, 25, 28.
Step 1: Solve the mean
𝑥 =
6+10+12+15+18+18+20+23+25+28
10
=17.5
23. STANDARD DEVIATION (UNGROUP DATA)
Formula: 𝑆𝐷 =
(𝑥− 𝑥)
2
𝑛−1
Step 2: Subtract the mean from each score. 𝑥 − 𝑥
Step 3: Square each difference from Step 2 or (𝑥 − 𝑥)2
26. INTERPRETATION OF THE STANDARD
DEVIATION
1. Approximately 68% of the scores in the sample falls within one
standard deviation of the mean.
2. Approximately 95% of the scores in the sample falls within two
standard deviations of the mean.
3. Approximately, 99% of the scores in the sample falls within three
standard deviation of the mean.
29. INFERENTIAL STATISTICS
It refers to statistical measures and techniques that
allow us to use samples to make generalizations about
the population from which the samples were drawn.
30. 1. Test of Significant Difference (t-test)
Between means
For independent samples (when the respondents consists
of two different groups as boys and girls, working mothers
and non-working mothers, healthy and malnourished
children and the like.
34. ANALYSIS OF VARIANCE
ANOVA is used when significance of difference of means
of two or more groups are to be determined at one time.
35. 2. Test of Relationship
1. Spearman rank order correlation or spearman rho.
◦This is used when data available are expressed in terms of ranks
(ordinal variable)
◦Formula: 𝜌 = 1 −
6 𝐷2
𝑁(𝑁2−1)
36. 2. Test of Relationship
2. Chi-Square Test for Independence.
◦This is used when data are expressed in terms of frequencies or
percentage(nominal variable).
◦Formula:
◦𝑥2
=
(𝑂−𝐸)2
𝐸
[df=(r-1)(c-1)
◦Where: 𝐸 =
(𝑟𝑜𝑤 𝑡𝑜𝑡𝑎𝑙)(𝑐𝑜𝑙𝑢𝑚𝑛 𝑡𝑜𝑡𝑎𝑙)
𝑔𝑟𝑎𝑛𝑑 𝑡𝑜𝑡𝑎𝑙
37. 2. Test of Relationship
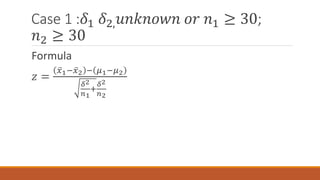
4. Pearson Product Moment Coefficient of Correlation
◦This is used when data are expressed in terms of scores such as
weights and heights in a test (ratio or interval)
◦Formula:
◦𝑟 =
𝑛 𝑥𝑦− 𝑥 𝑦
[𝑛 𝑥2−( 𝑥)
2
][𝑛 𝑦2−( 𝑦)
2
]
38. T-Test to test the significance of Pearson r
◦Formula:
◦𝑡 = 𝑟
𝑛−2
1−𝑟2
◦Where: r= correlation coefficient
◦ n= number of samples