Downloaded 816 times

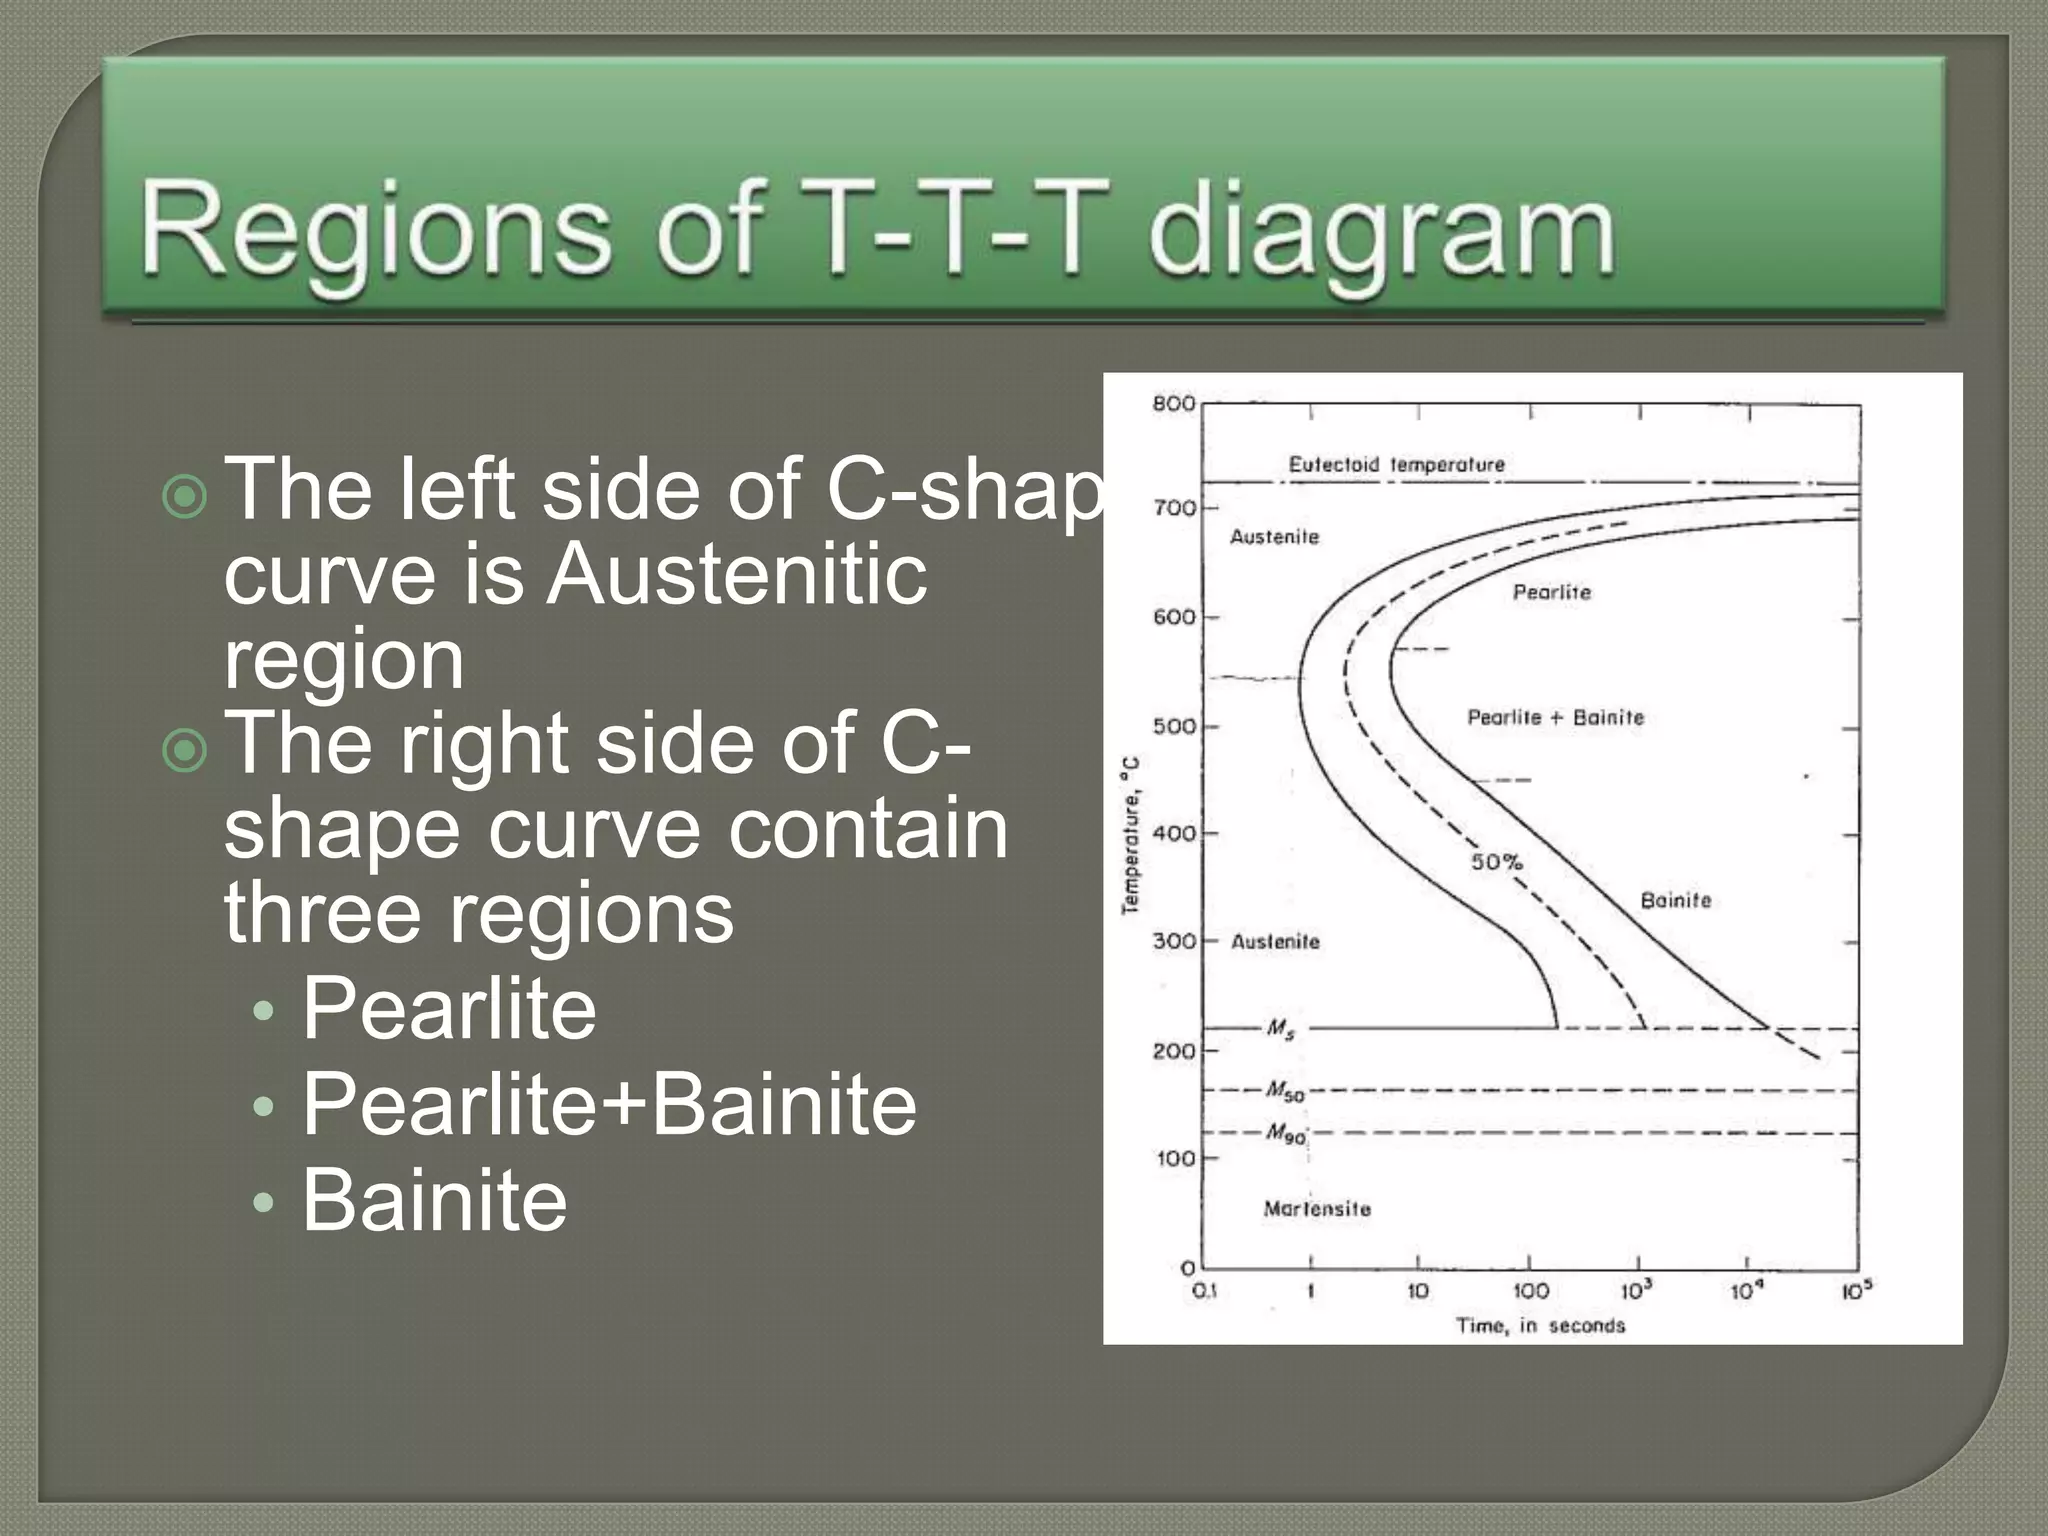
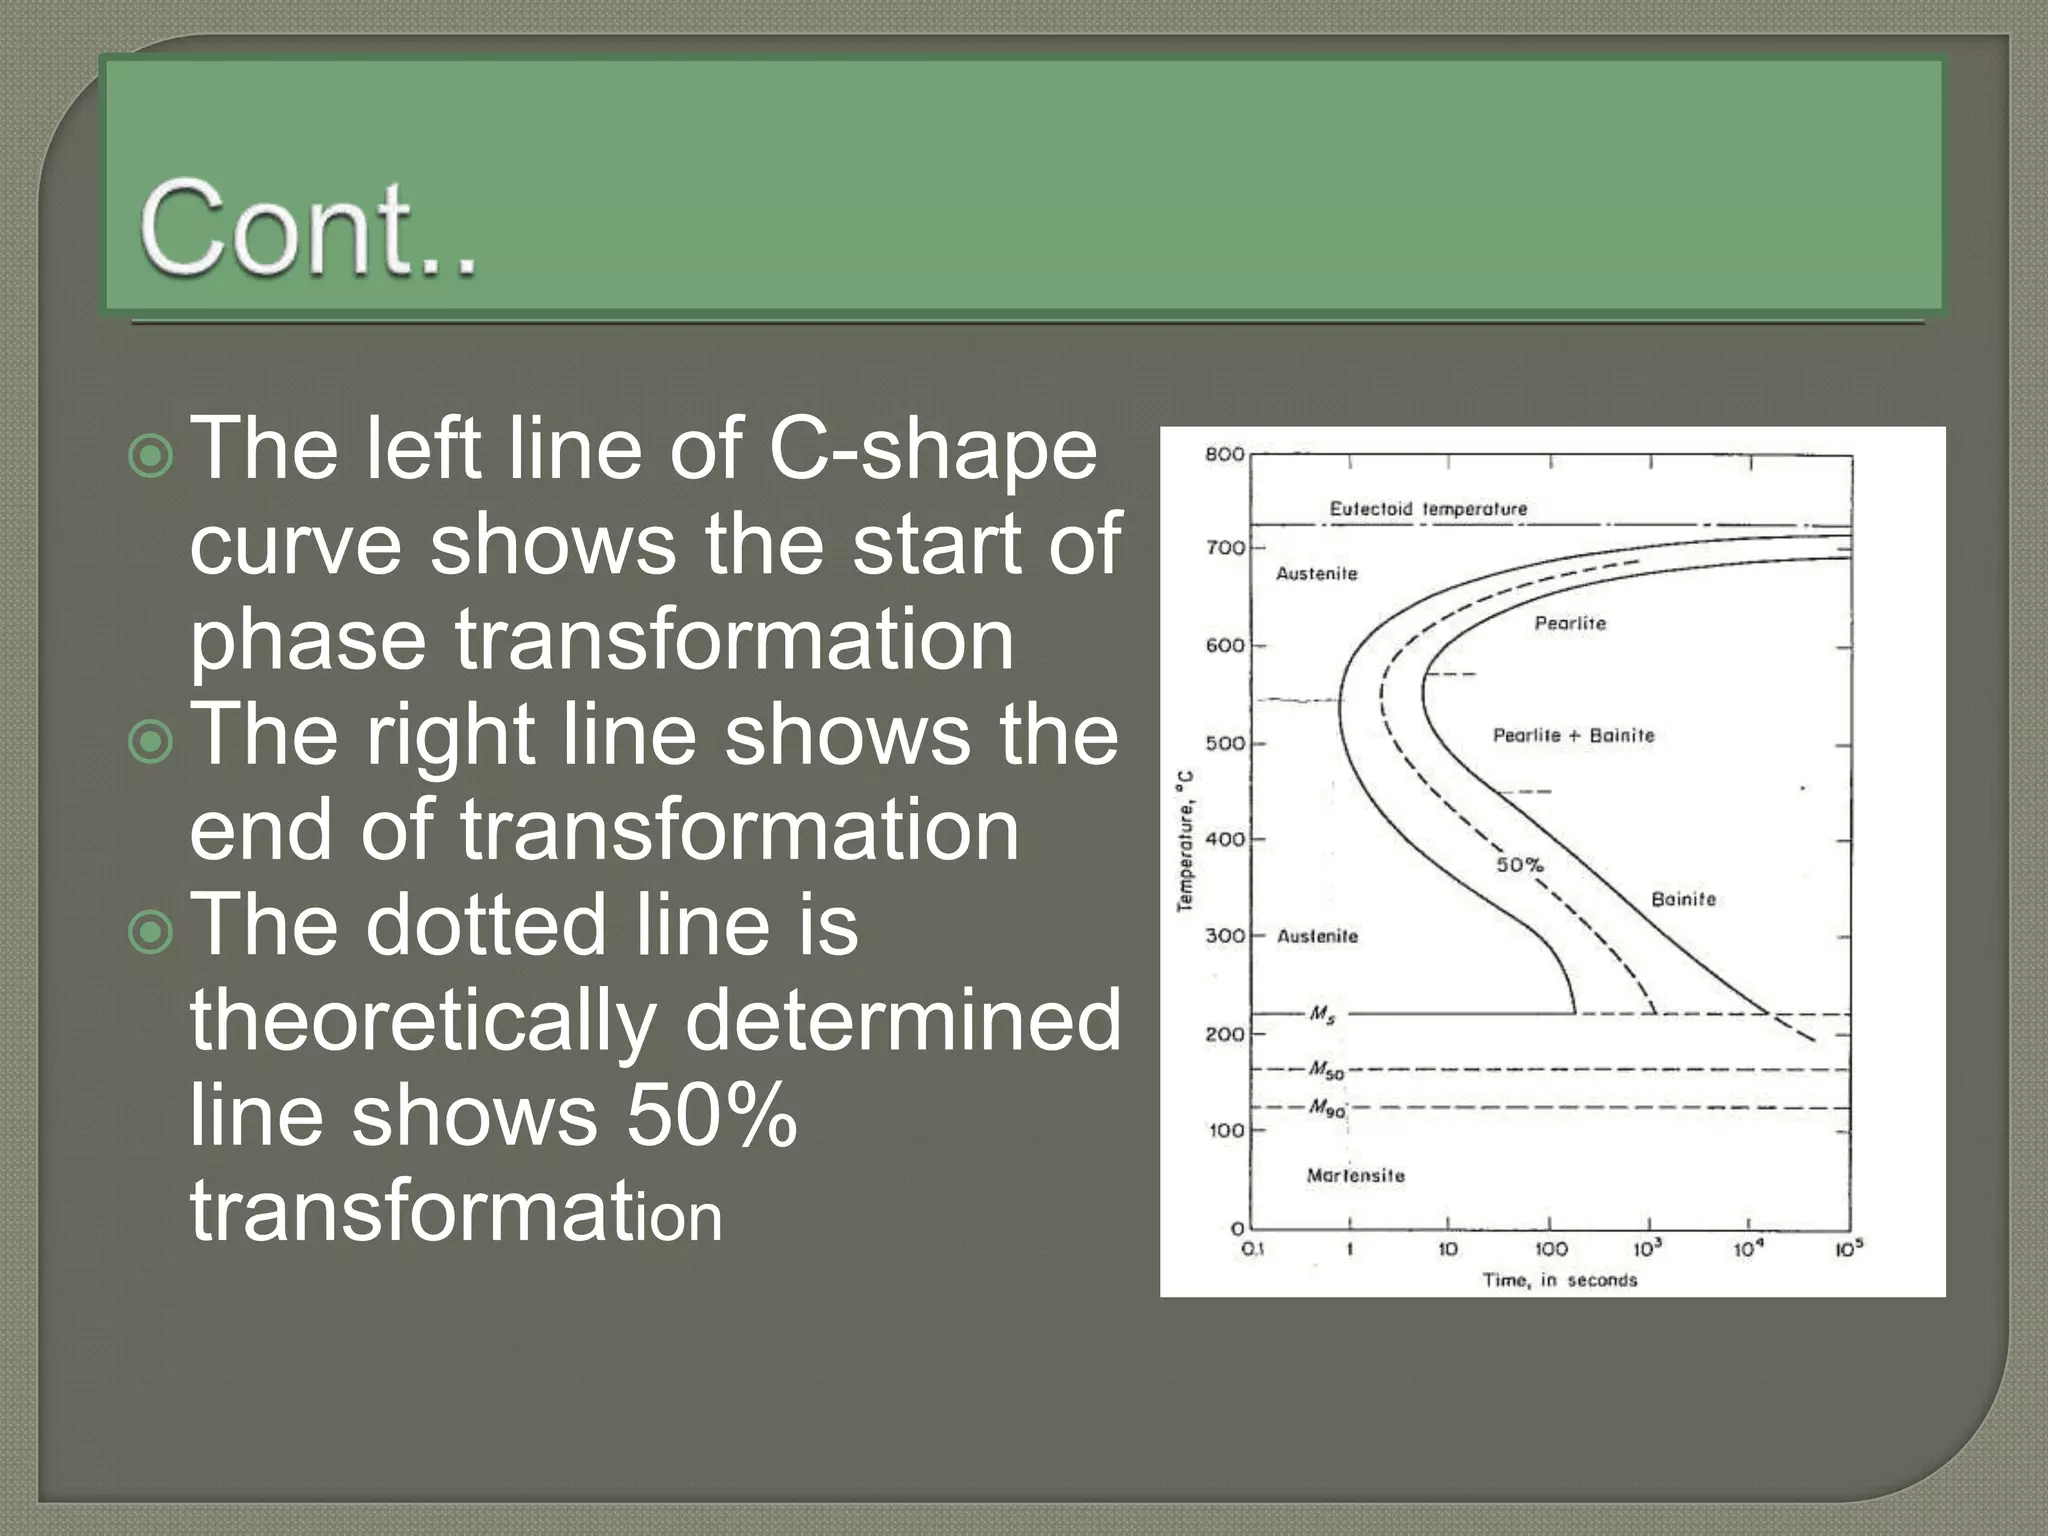
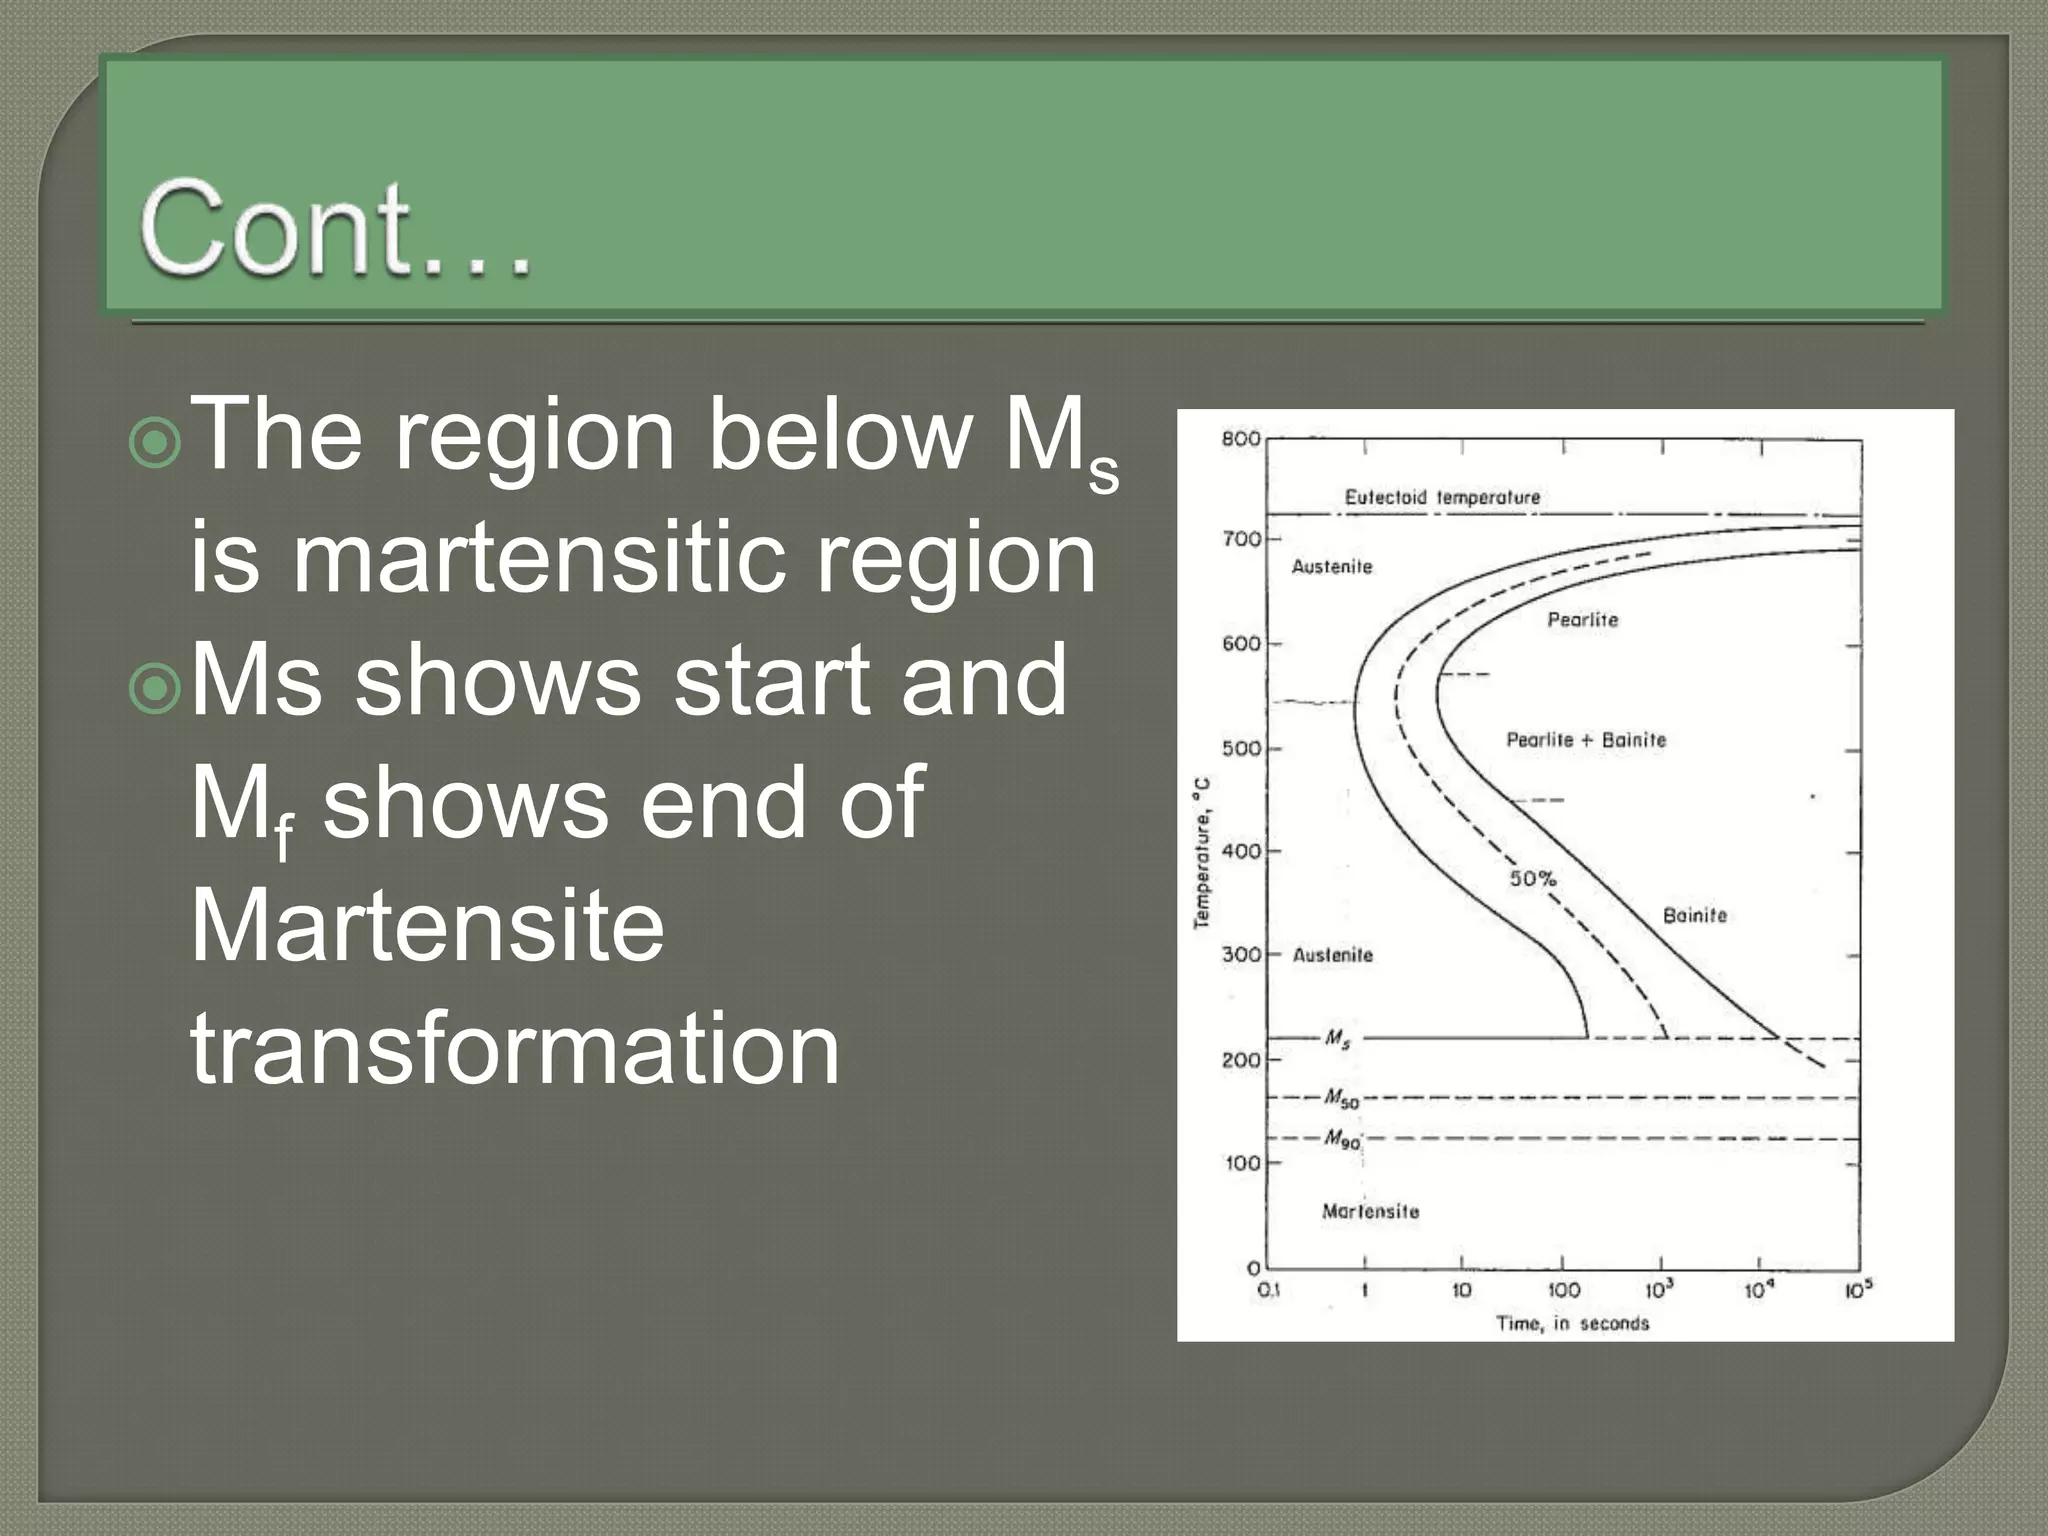
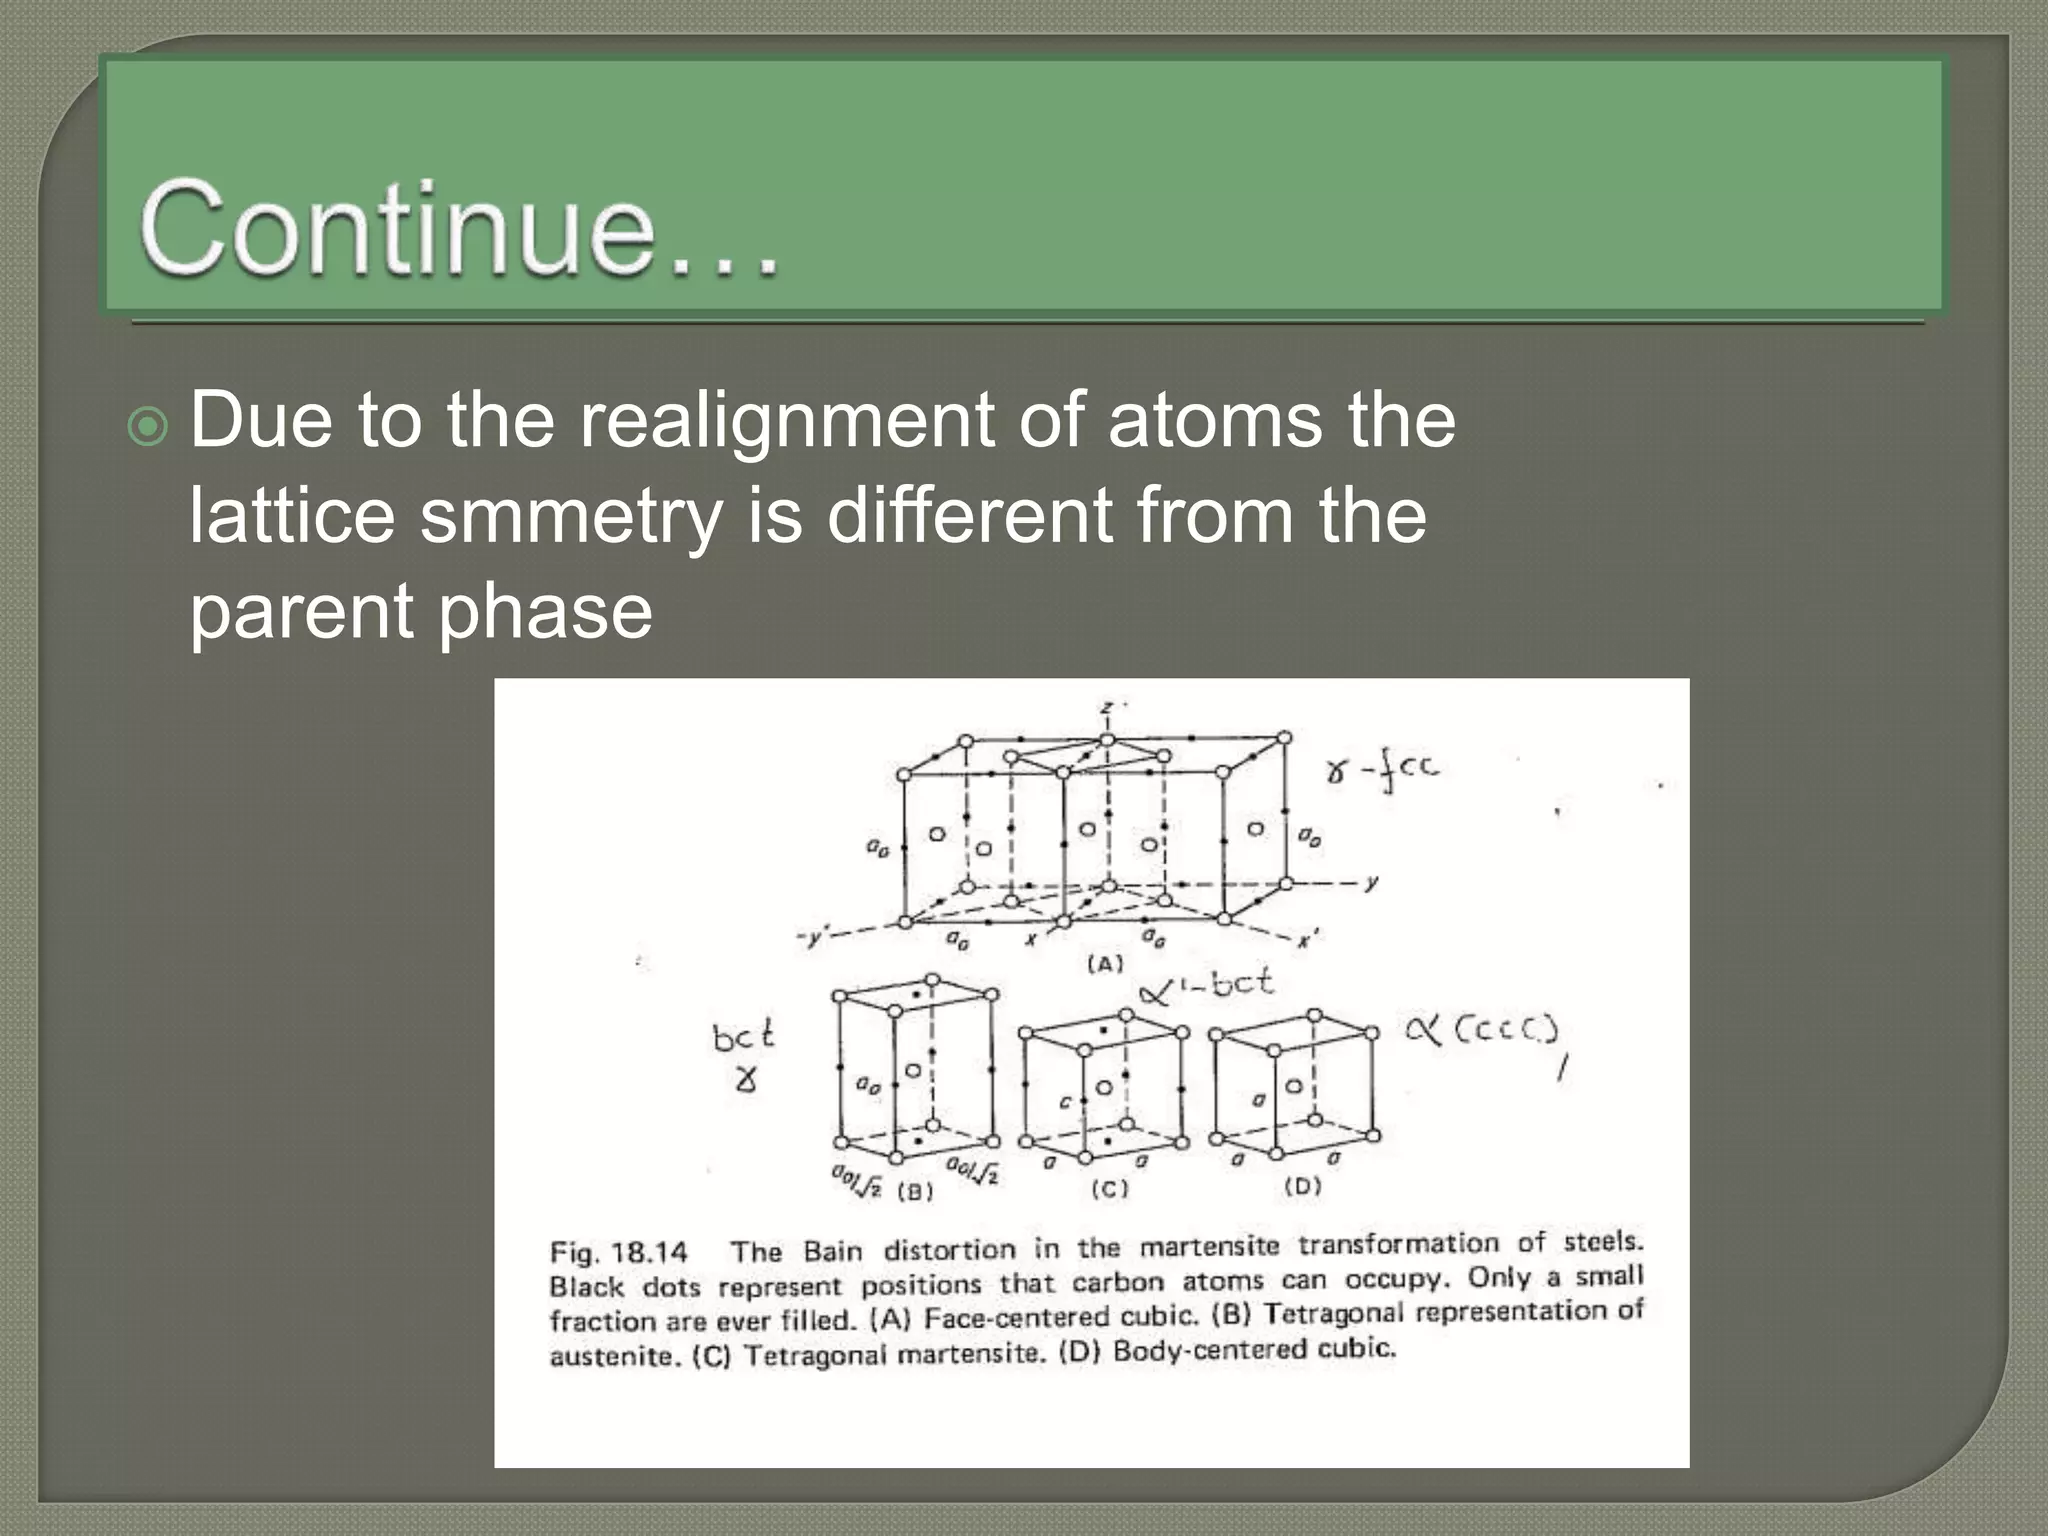
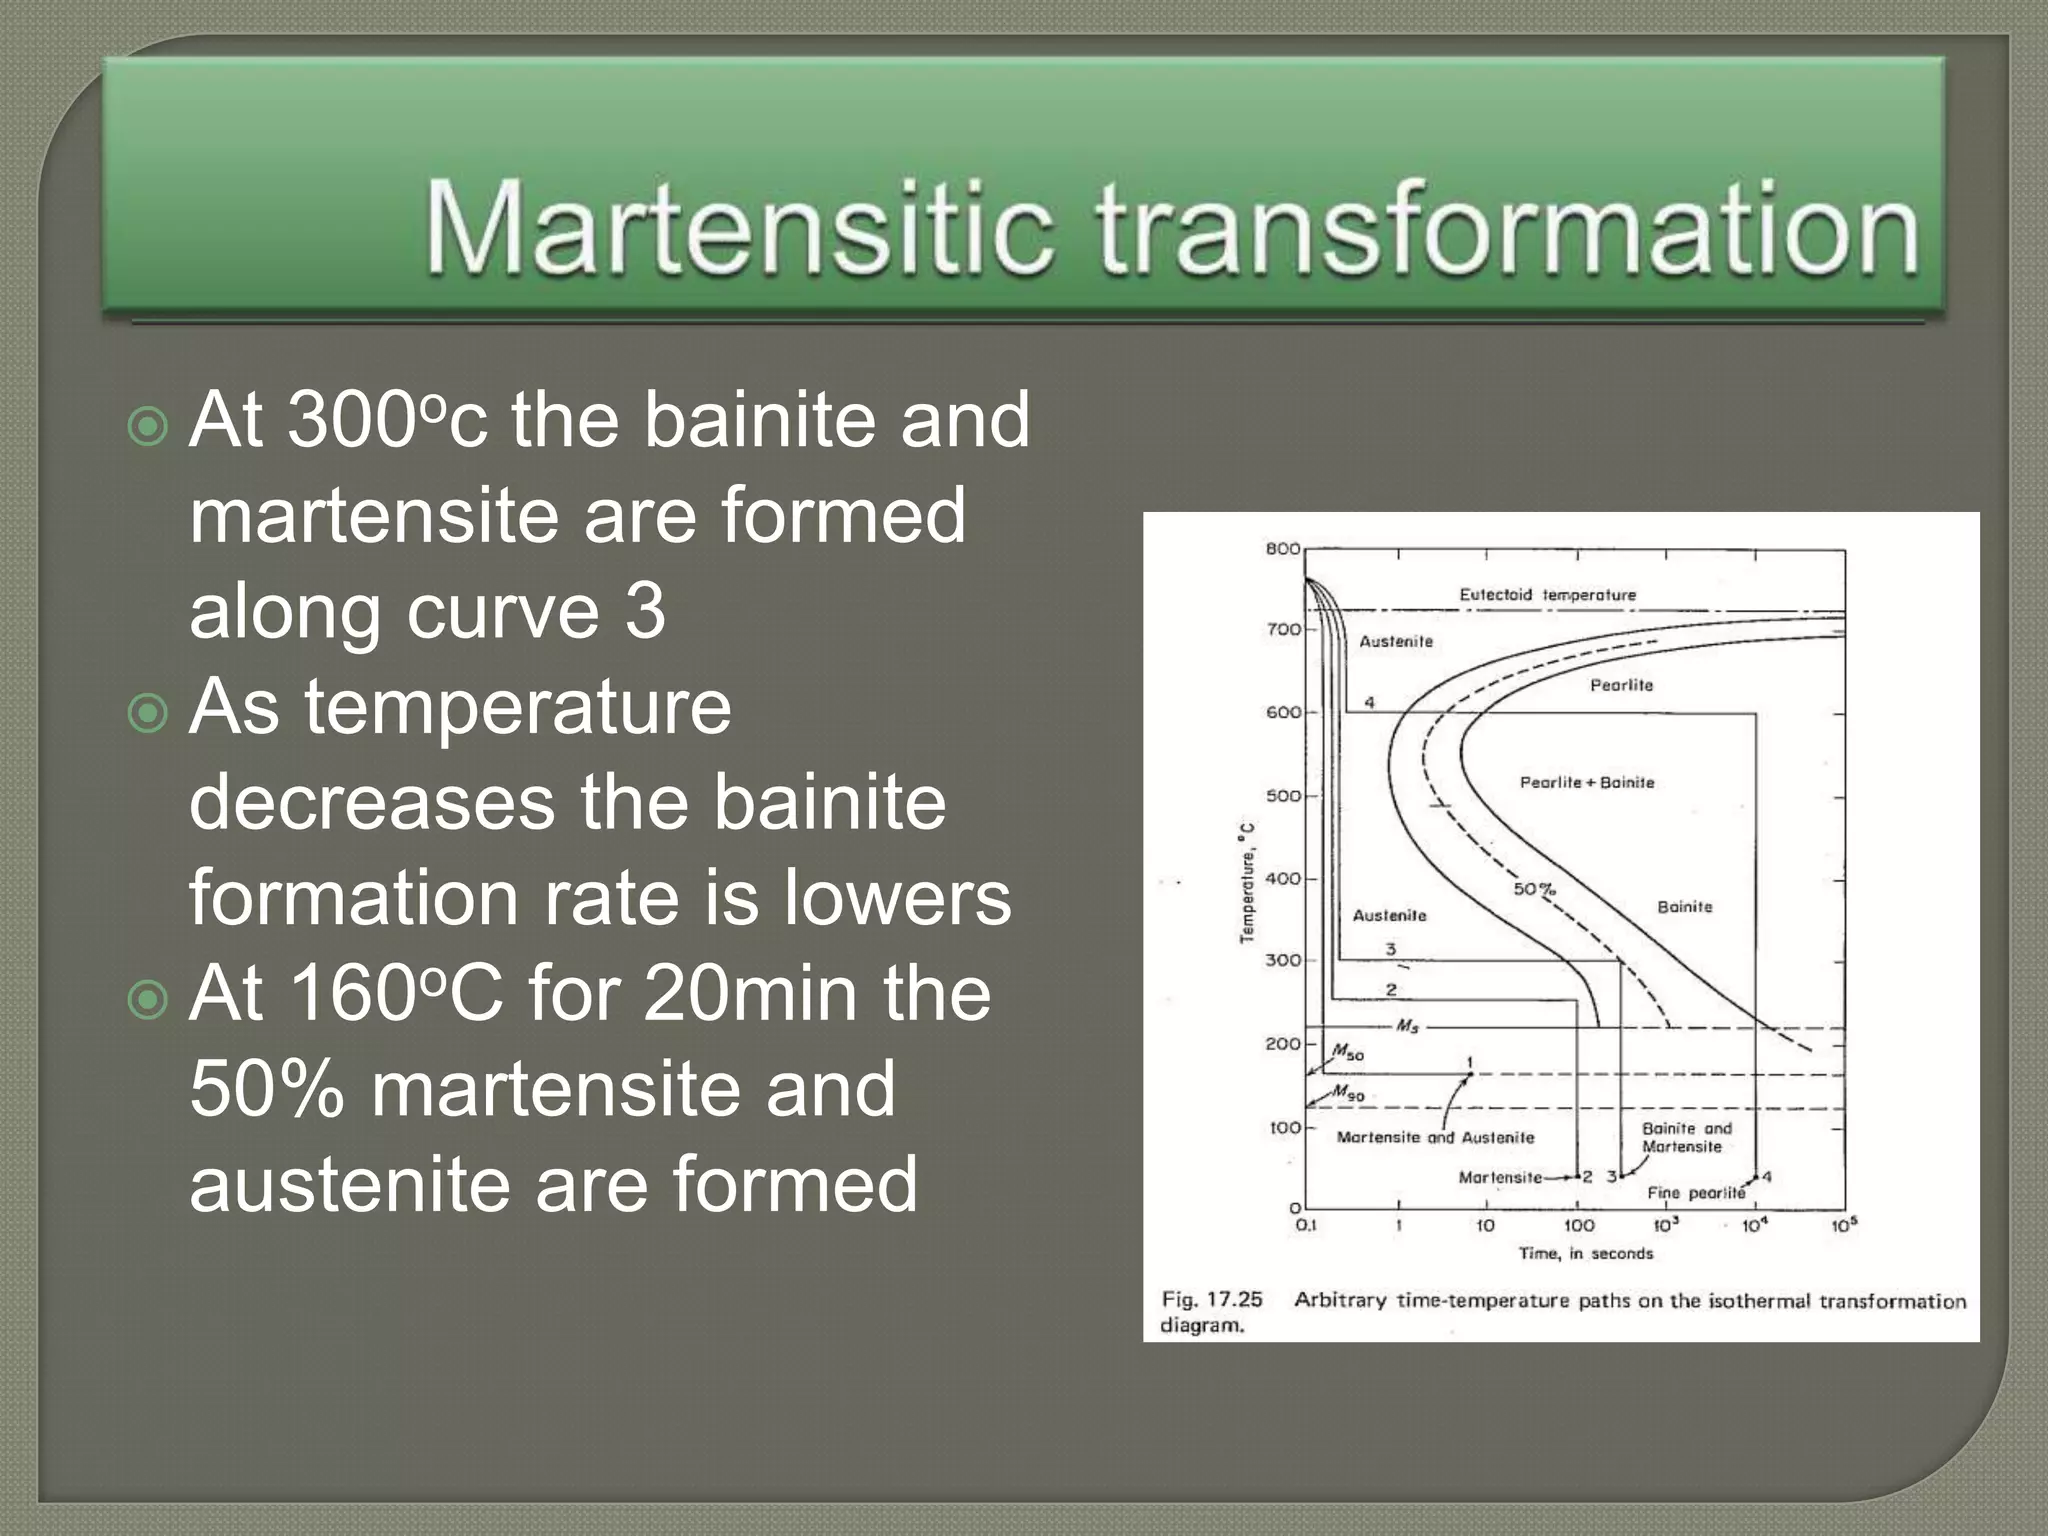
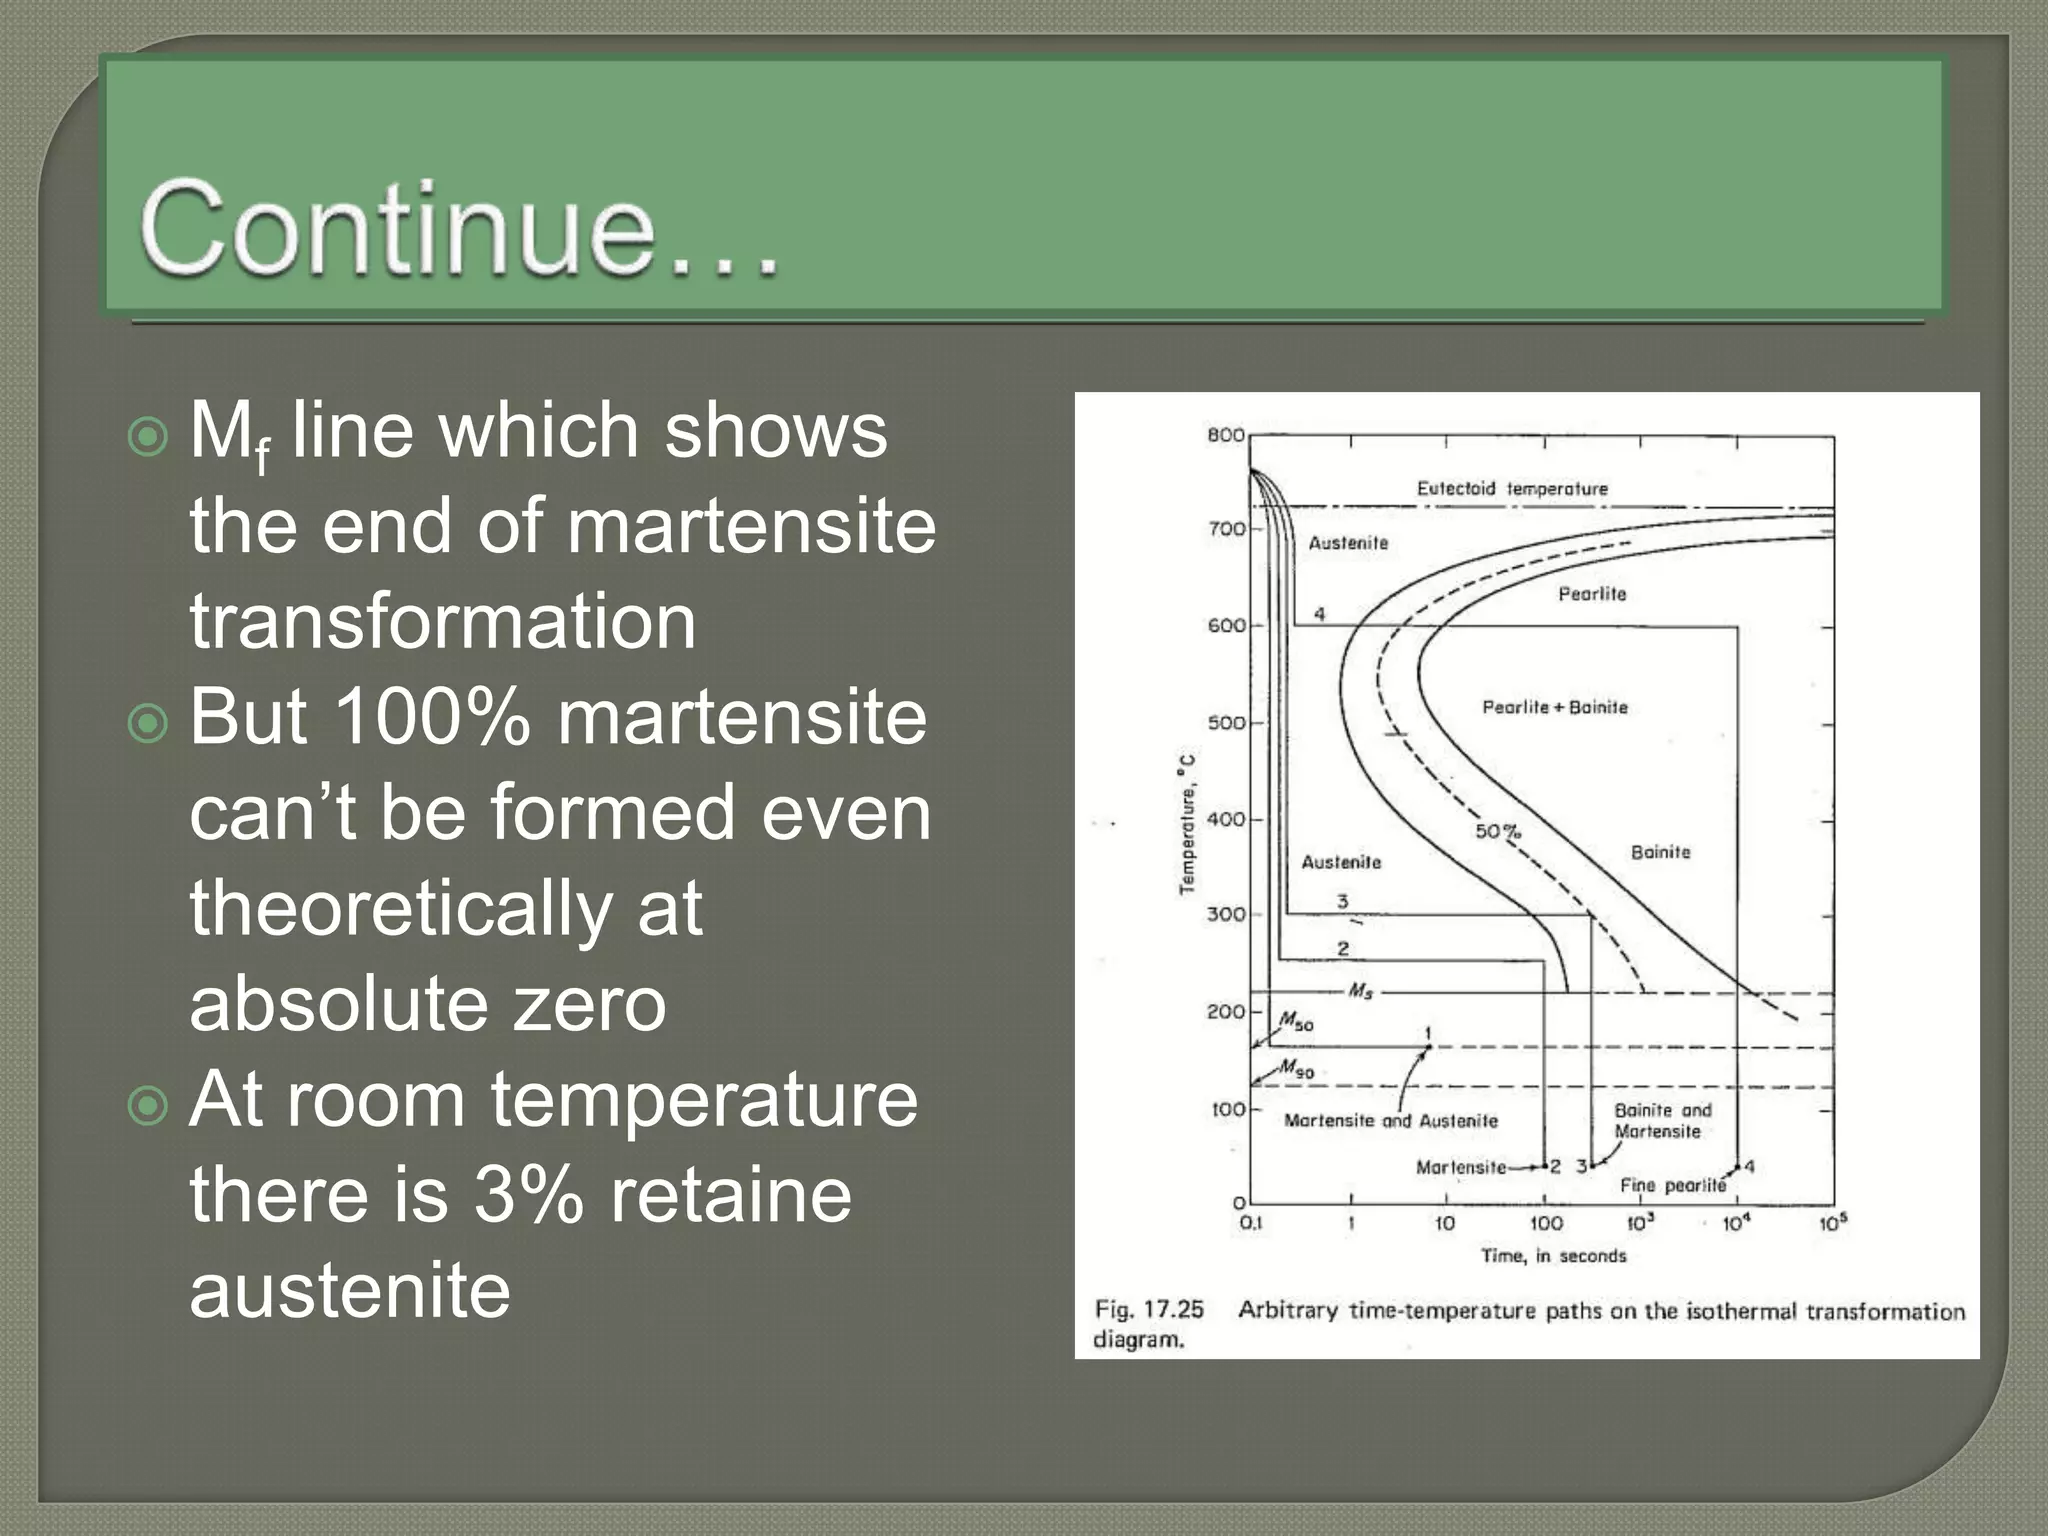
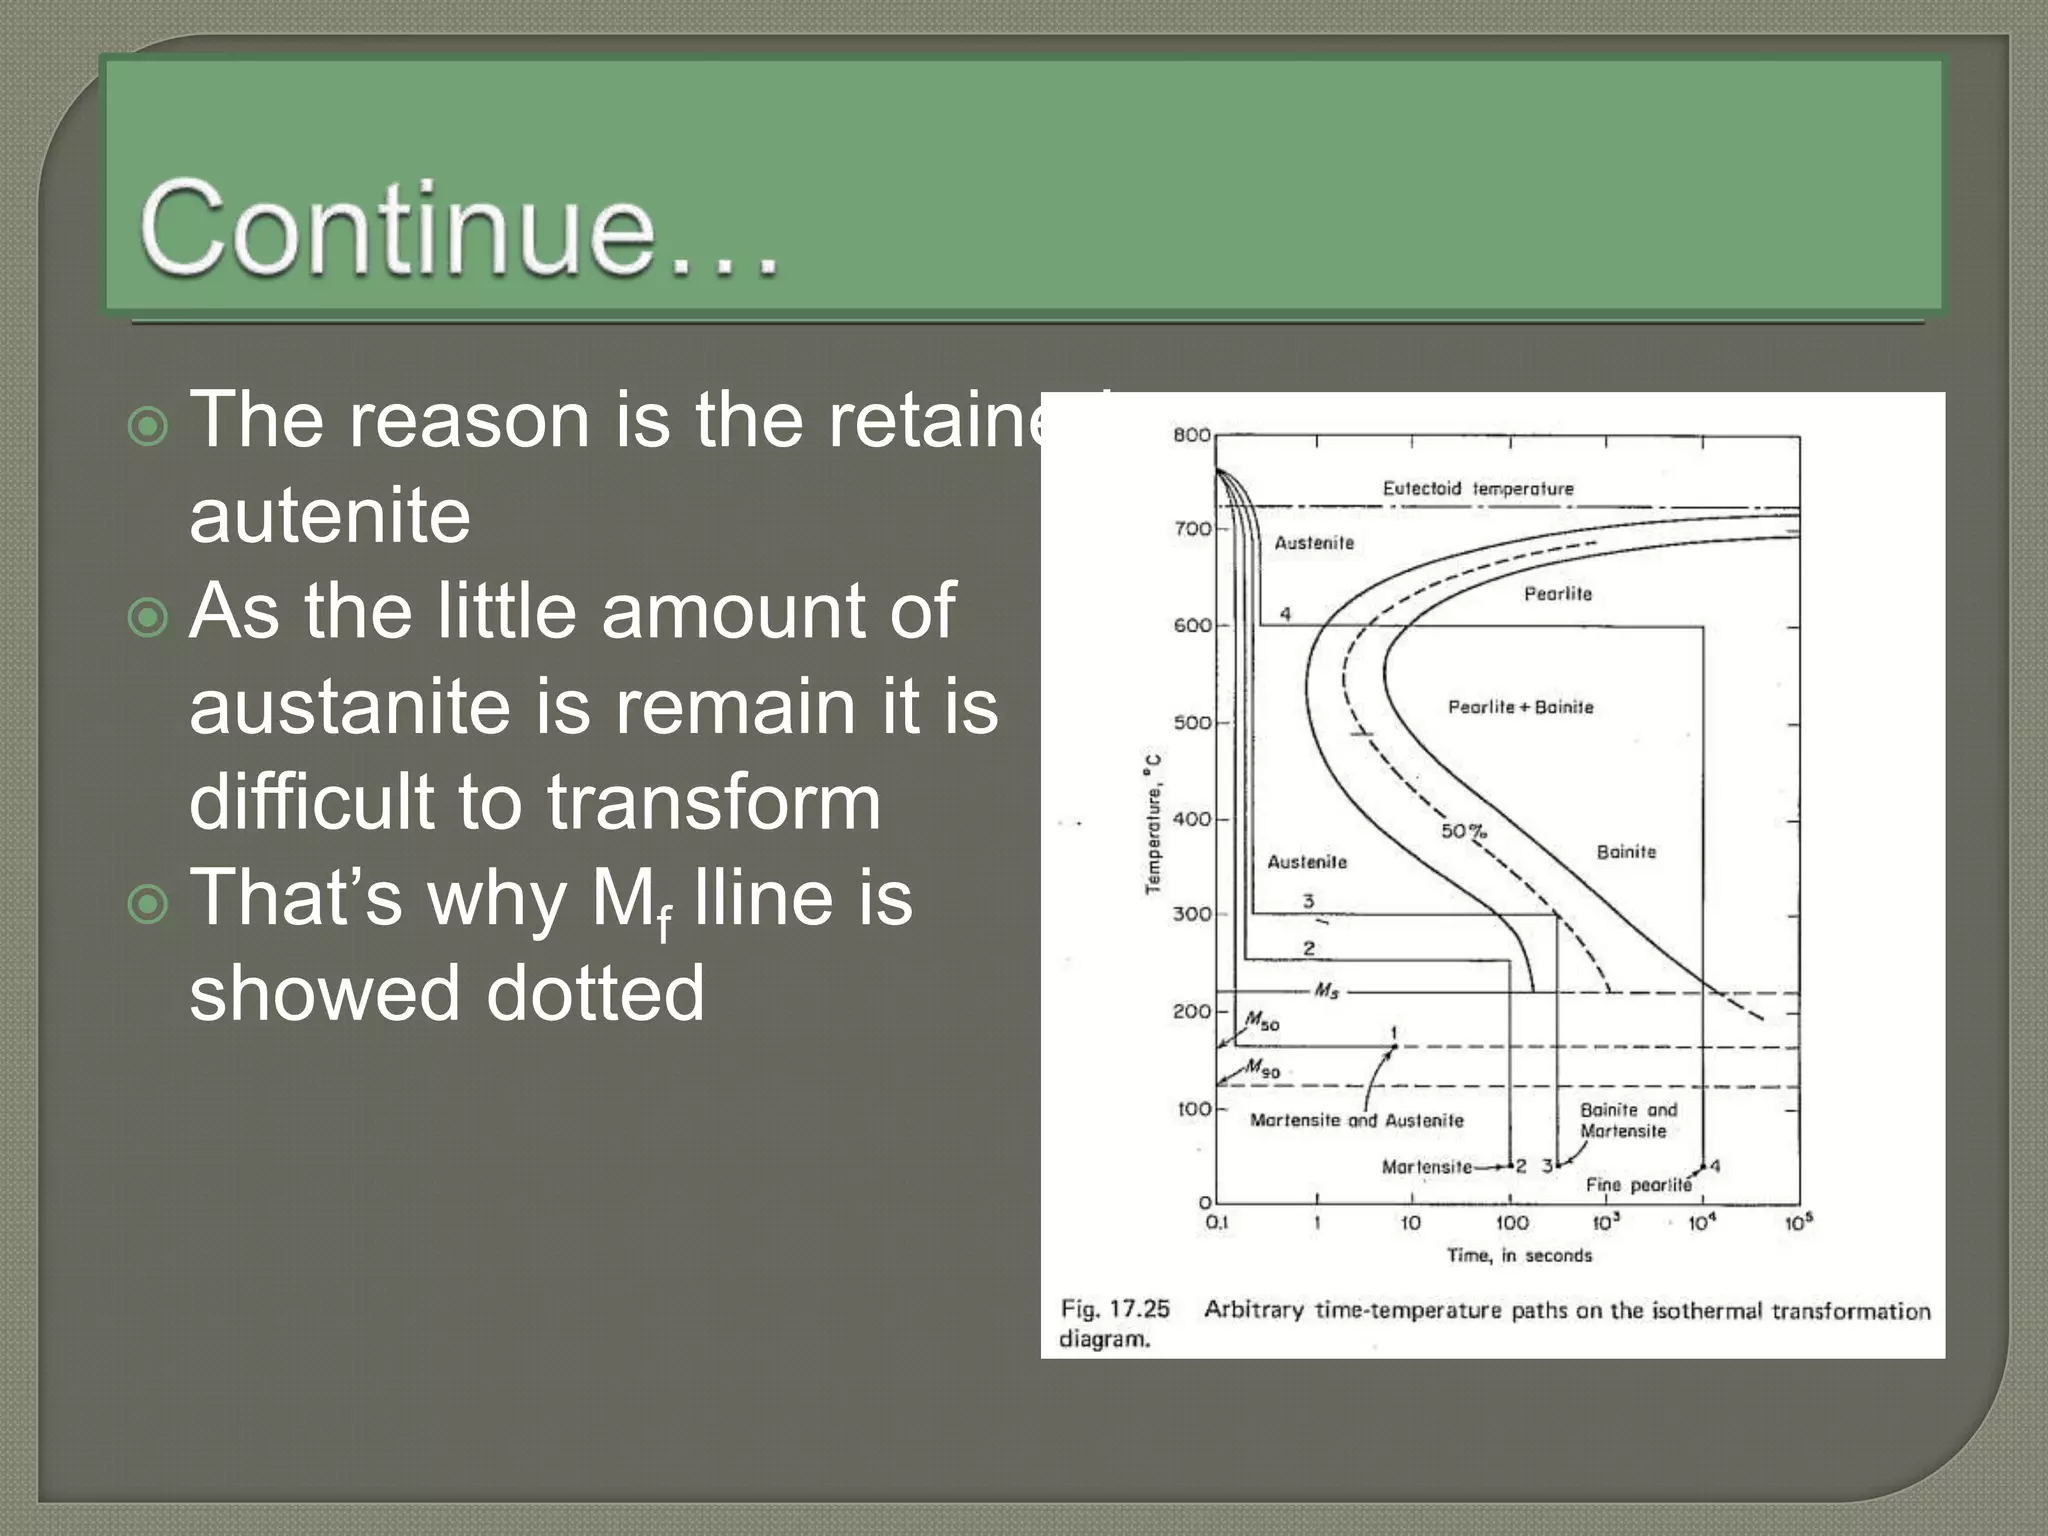
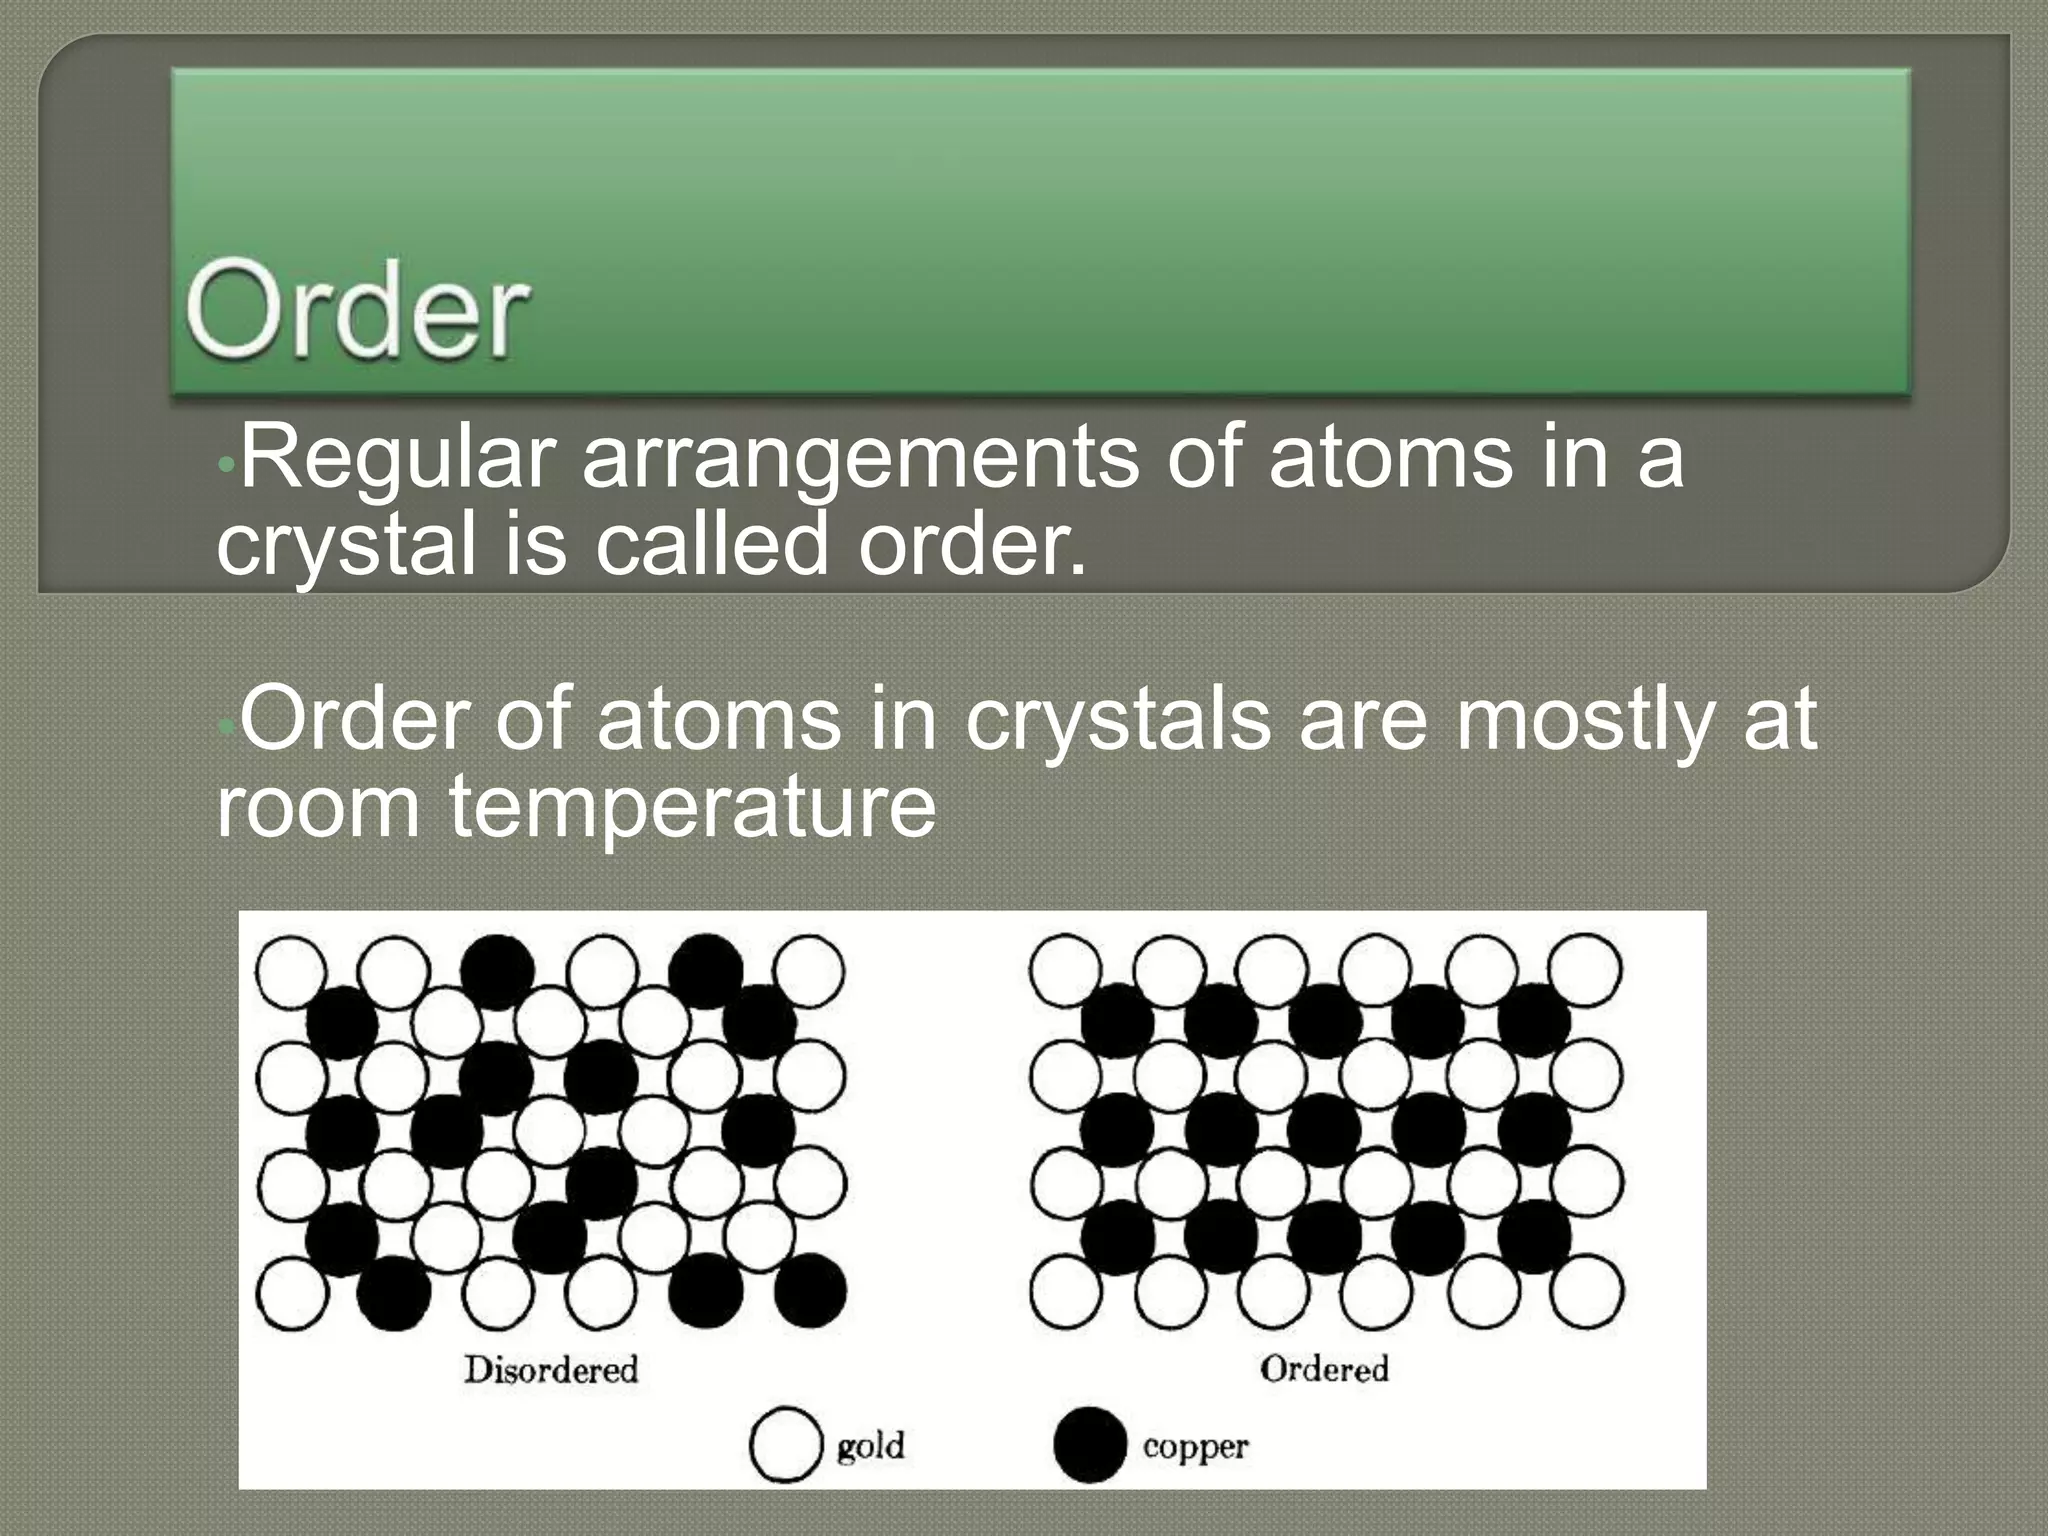
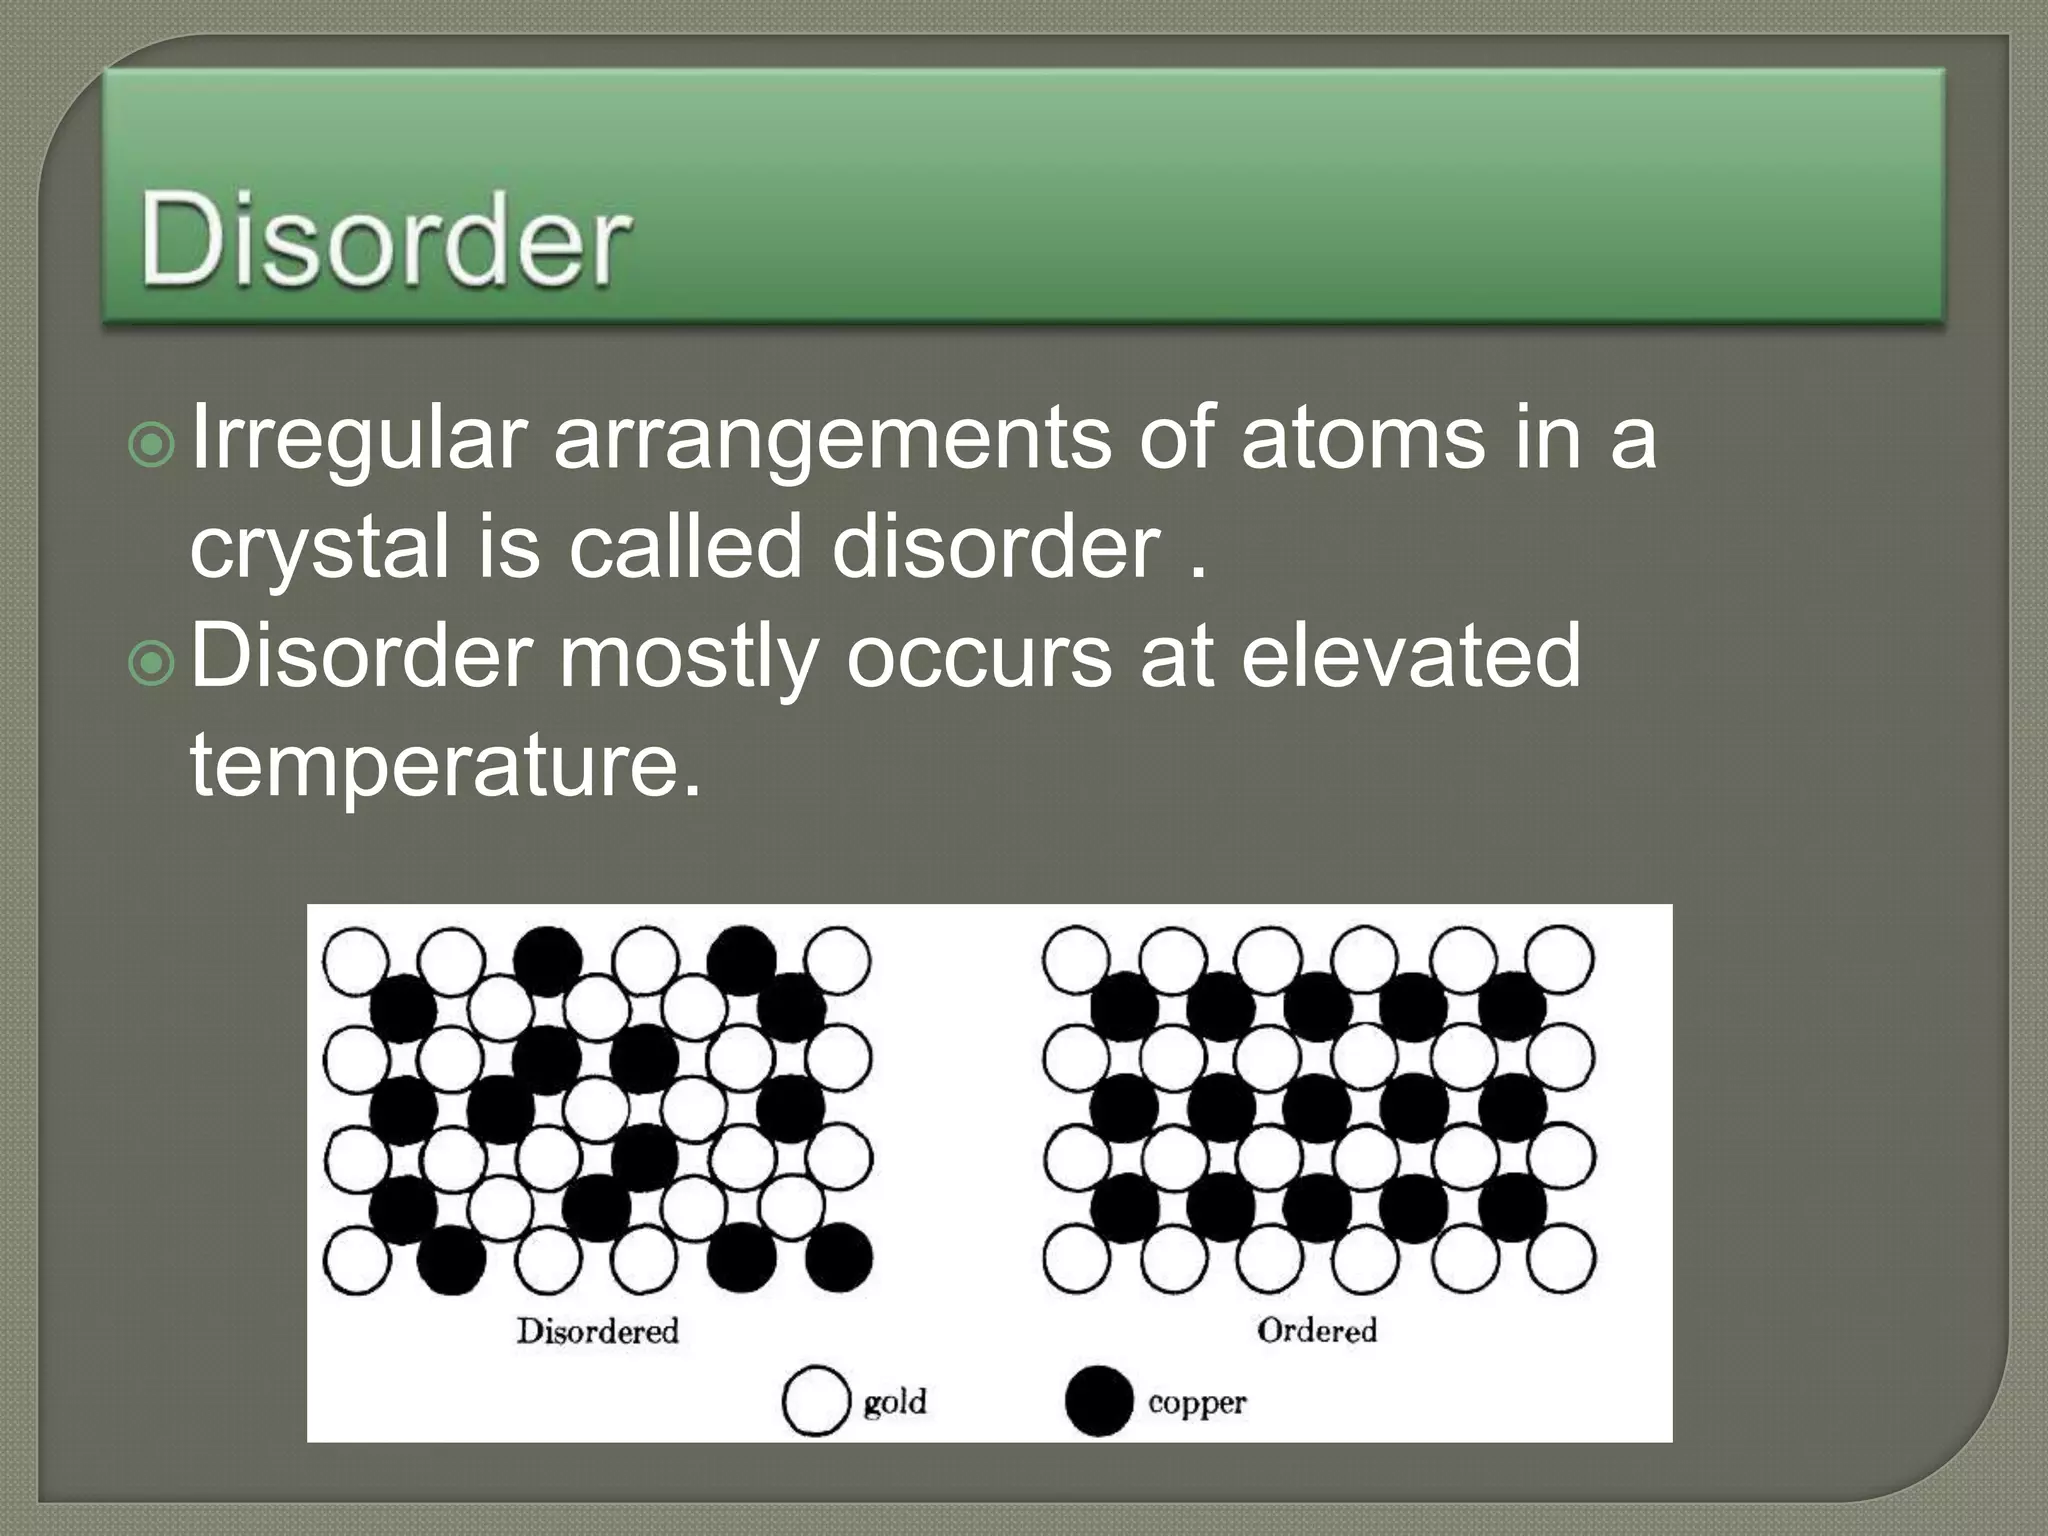


The document discusses TTT diagrams and phase transformations in steel. It explains that TTT diagrams plot transformation over time and temperature, showing the different phases formed. The C-shaped curve represents the austenitic, pearlitic, bainitic, and martensitic regions. Ms and Mf lines mark the start and end of martensite formation. Martensite has a body-centered tetragonal crystal structure formed by atomic realignment without diffusion. The document also discusses order and disorder in alloy solutions above and below the critical temperature.


