
Recommended
More Related Content
What's hot
What's hot (20)
Viewers also liked
Similar to Chapter 10: Phase Transformations and Structures
Similar to Chapter 10: Phase Transformations and Structures (20)
Chapter 10: Phase Transformations and Structures
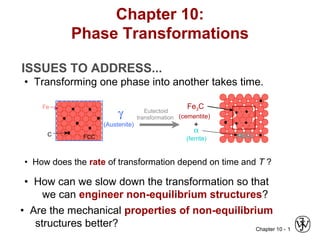
- 1. Chapter 10 - 1 ISSUES TO ADDRESS... • Transforming one phase into another takes time. • How does the rate of transformation depend on time and T ? • How can we slow down the transformation so that we can engineer non-equilibrium structures? • Are the mechanical properties of non-equilibrium structures better? Fe γ (Austenite) Eutectoid transformation C FCC Fe3C (cementite) α (ferrite) + (BCC) Chapter 10: Phase Transformations
- 2. Chapter 10 - 2 Phase Transformation and Structure Processing Structure Properties Phase Transformation Altering Structure Changing Temperature (on phase diagram)
- 3. Chapter 10 - 3 Phase Transformations Nucleation – nuclei (seeds) act as template to grow crystals – for nucleus to form: rate of addition of atoms to nucleus must be faster than rate of loss – once nucleated, grow until reach equilibrium Driving force to nucleate increases as we increase ∆T – supercooling (eutectic, eutectoid) Small supercooling few nuclei - large crystals Large supercooling rapid nucleation - many nuclei, small crystals
- 4. Chapter 10 - 4 Solidification: Nucleation Processes • Homogeneous nucleation – nuclei form in the bulk of liquid metal – requires supercooling (typically 80-300°C max) • Heterogeneous nucleation – much easier since stable “nucleus” is already present Could be wall of mold or impurities in the liquid phase – allows solidification with only 0.1-10ºC supercooling
- 5. Chapter 10 - 5 Rate of Phase Transformations Kinetics - measure approach to equilibrium vs. time • Hold temperature constant & measure conversion vs. time sound waves – one sample electrical conductivity – follow one sample X-ray diffraction – have to do many samples How is conversion measured?
- 6. Chapter 10 - 6 Rate of Phase Transformation Avrami rate equation => y = 1- exp (-ktn ) – k & n fit for specific sample (from experiments) All out of material - done log t Fractiontransformed,y Fixed T fraction transformed time 0.5 By convention r = 1 / t0.5 maximum rate reached – now amount unconverted decreases so rate slows t0.5 rate increases as surface area increases & nuclei grow
- 7. Chapter 10 - 7 Rate of Phase Transformations • In general, rate increases as T ↑ r = 1/t0.5 = A e -Q/RT – R = gas constant – T = temperature (K) – A = preexponential factor – Q = activation energy Arrhenius expression • r often small: equilibrium not possible! 135°C 119°C 113°C 102°C 88°C 43°C 1 10 102 104 ∆T supercooling
- 8. Chapter 10 - 8 Eutectoid Transformation Rate Course pearlite formed at higher T - softer Fine pearlite formed at low T - harder Diffusive flow of C needed α α γ γ α • Growth of pearlite from austenite: γα α α α α α pearlite growth direction Austenite (γ) grain boundary cementite (Fe3C) Ferrite (α) γ • Recrystallization rate increases with ∆T. 675°C (∆T smaller) 0 50 y(%pearlite) 600°C (∆T larger) 650°C 100
- 9. Chapter 10 - 9 • Reaction rate is a result of nucleation and growth of crystals. • Examples: Nucleation and Growth % Pearlite 0 50 100 Nucleation regime Growth regime log(time)t0.5 Nucleation rate increases with ∆T Growth rate increases with T T just below TE Nucleation rate low Growth rate high γ pearlite colony T moderately below TE γ Nucleation rate medium. Growth rate medium. Nucleation rate high T way below TE γ Growth rate low
- 10. Chapter 10 -10 Transformations & Undercooling • Can make it occur at: ...727ºC (cool it slowly) ...below 727ºC (“undercool” it!) • Eutectoid transf. (Fe-C System): γ ⇒ α + Fe3C 0.76 wt% C 0.022 wt% C 6.7 wt% C Fe3C(cementite) 1600 1400 1200 1000 800 600 400 0 1 2 3 4 5 6 6.7 L γ (austenite) γ+L γ +Fe3C α +Fe3C L+Fe3C δ (Fe) Co, wt%C 1148°C T(°C) α ferrite 727°C Eutectoid: Equil. Cooling: Ttransf. = 727ºC ∆T Undercooling by ∆Ttransf. < 727°C 0.76 0.022
- 11. Chapter 10 -11 Isothermal Transformation Diagrams • Fe-C system, Co = 0.76 wt% C • Transformation at T = 675°C. 100 50 0 1 102 104 T = 675°C y, %transformed time (s) 400 500 600 700 1 10 102 103 104 105 0%pearlite 100% 50% Austenite (stable) TE (727°C)Austenite (unstable) Pearlite T(°C) time (s) isothermal transformation at 675°C
- 12. Chapter 10 -12 • Eutectoid composition, Co = 0.76 wt% C • Begin at T > 727°C • Rapidly cool to 625°C and hold isothermally. Effect of Cooling History in Fe-C System 400 500 600 700 0%pearlite 100% 50% Austenite (stable) TE (727°C) Austenite (unstable) Pearlite T(°C) 1 10 102 103 104 105 time (s) γ γ γ γ γ γ
- 13. Chapter 10 -13 Transformations with Proeutectoid Materials Hypereutectoid composition – proeutectoid cementite α CO = 1.13 wt% C TE (727°C) T(°C) time (s) A A A + C P 1 10 102 103 104 500 700 900 600 800 A + P Adapted from Fig. 10.16, Callister 7e. Adapted from Fig. 9.24, Callister 7e. Fe3C(cementite) 1600 1400 1200 1000 800 600 400 0 1 2 3 4 5 6 6.7 L γ (austenite) γ+L γ +Fe3C α+Fe3C L+Fe3C δ (Fe) Co, wt%C T(°C) 727°C ∆T 0.76 0.022 1.13
- 14. Chapter 10 -14 Non-Equilibrium Structure of Fe-C • Bainite: − α lathes (strips) with long rods of Fe3C - Needles of Fe3C in α - Very fine structure --diffusion controlled. Obtained from moderate cooling i.e. no enough time for diffusion Fe3C (cementite) 5 µm α (ferrite)
- 15. Chapter 10 -15 • Spheroidite: --α grains with spherical Fe3C --diffusion dependent. --heat bainite or pearlite for long times --reduces interfacial area (driving force) Spheroidite: Fe-C System 60 µm α (ferrite) (cementite) Fe3C
- 16. Chapter 10 -16 • Martensite: --γ (FCC) to Martensite (BCT) NON-Equilibrium single phase Hard and Brittle • γ to M transformation.. -- is rapid! -- % transf. depends on T only. Martensite: Fe-C System Martensite needles Austenite 60µm x x x x x x potential C atom sites Fe atom sites (involves single atom jumps)
- 17. Chapter 10 -17 γ (FCC) α (BCC) + Fe3C Martensite Formation slow cooling tempering quench M (BCT) M = martensite is body centered tetragonal (BCT) Diffusionless transformation BCT if C > 0.15 wt% BCT few slip planes hard, brittle
- 18. Chapter 10 -18 Mechanical Prop: Effect Of Carbon Content Increasing wt% C: TS and YS increase %EL decreases . • Effect of wt% C Co < 0.76 wt% C Hypoeutectoid Pearlite (med) ferrite (soft) Co > 0.76 wt% C Hypereutectoid Pearlite (med) Cementite (hard) 300 500 700 900 1100 YS(MPa) TS(MPa) wt% C 0 0.5 1 hardness 0.76 Hypo Hyper wt% C 0 0.5 1 0 50 100 %EL Impactenergy(Izod,ft-lb) 0 40 80 0.76 Hypo Hyper
- 19. Chapter 10 -19 Mechanical Prop: Effect Of Size • Fine vs coarse pearlite vs spheroidite • Hardness: • %RA: fine > coarse > spheroidite fine < coarse < spheroidite 80 160 240 320 wt%C 0 0.5 1 Brinellhardness fine pearlite coarse pearlite spheroidite Hypo Hyper 0 30 60 90 wt%C Ductility(%RA) fine pearlite coarse pearlite spheroidite Hypo Hyper 0 0.5 1
- 20. Chapter 10 -20 Mechanical Prop: Effect Of Structure Type • Fine Pearlite vs Martensite: • Hardness: fine pearlite << martensite. 0 200 wt% C 0 0.5 1 400 600 Brinellhardness martensite fine pearlite Hypo Hyper
- 21. Chapter 10 -21 Tempering Martensite • reduces brittleness of martensite, • reduces internal stress caused by quenching. • decreases TS, YS but increases %RA • produces extremely small Fe3C particles surrounded by α. 9µm YS(MPa) TS(MPa) 800 1000 1200 1400 1600 1800 30 40 50 60 200 400 600 Tempering T (°C) %RA TS YS %RA
- 22. Chapter 10 -22 Summary: Processing Options Austenite (γ) Bainite (α + Fe3C plates/needles) Pearlite (α + Fe3C layers + a proeutectoid phase) Martensite (BCT phase diffusionless transformation) Tempered Martensite (α + very fine Fe3C particles) slow cool moderate cool rapid quench reheat reheat Spheroidite The most ductile
- 23. Chapter 10 -23 Summary: Structures versus Mechanical Properties Strength Ductility Martensite T Martensite bainite fine pearlite coarse pearlite spheroidite General Trends
- 24. Chapter 10 -24 Annealing: Heat to Tanneal, then cool slowly. Based on discussion in Section 11.7, Callister 7e. Thermal Processing of Metals Types of Annealing • Process Anneal: Negate effect of cold working by (recovery/ recrystallization) • Stress Relief: Reduce stress caused by: -plastic deformation -nonuniform cooling -phase transform. • Normalize (steels): Deform steel with large grains, then normalize to make grains small. • Full Anneal (steels): Make soft steels for good forming by heating to get γ, then cool in furnace to get coarse P. • Spheroidize (steels): Make very soft steels for good machining. Heat just below TE & hold for 15-25 h.
- 25. Chapter 10 -25 a) Annealing b) Quenching Heat Treatments c) c) Tempered Martensite Adapted from Fig. 10.22, Callister 7e. time (s) 10 10 3 10 5 10 -1 400 600 800 T(°C) Austenite (stable) 200 P B TE 0% 100% 50% A A M + A M + A 0% 50% 90% a)b)
- 26. Chapter 10 -26 Hardenability--Steels • Ability to form martensite • Jominy end quench test to measure hardenability. • Hardness versus distance from the quenched end. Adapted from Fig. 11.11, Callister 7e. (Fig. 11.11 adapted from A.G. Guy, Essentials of Materials Science, McGraw-Hill Book Company, New York, 1978.) Adapted from Fig. 11.12, Callister 7e. 24°C water specimen (heated to γ phase field) flat ground Rockwell C hardness tests Hardness,HRC Distance from quenched end
- 27. Chapter 10 -27 • The cooling rate varies with position. Adapted from Fig. 11.13, Callister 7e. (Fig. 11.13 adapted from H. Boyer (Ed.) Atlas of Isothermal Transformation and Cooling Transformation Diagrams, American Society for Metals, 1977, p. 376.) Why Hardness Changes W/Position distance from quenched end (in) Hardness,HRC 20 40 60 0 1 2 3 600 400 200 A → M A → P 0.1 1 10 100 1000 T(°C) M(start) Time (s) 0 0% 100% M(finish) M artensite M artensite + Pearlite Fine Pearlite Pearlite
- 28. Chapter 10 -28 Hardenability vs Alloy Composition • Jominy end quench results, C = 0.4 wt% C • "Alloy Steels" (4140, 4340, 5140, 8640) --contain Ni, Cr, Mo (0.2 to 2wt%) --these elements shift the "nose". --martensite is easier to form. Adapted from Fig. 11.14, Callister 7e. (Fig. 11.14 adapted from figure furnished courtesy Republic Steel Corporation.) Cooling rate (°C/s) Hardness,HRC 20 40 60 100 20 30 40 50 Distance from quenched end (mm) 210100 3 4140 8640 5140 1040 50 80 100 %M4340 T(°C) 10 -1 10 10 3 10 50 200 400 600 800 Time (s) M(start) M(90%) shift from A to B due to alloying BA TE
- 29. Chapter 10 -29 • Effect of quenching medium: Medium air oil water Severity of Quench low moderate high Hardness low moderate high • Effect of geometry: When surface-to-volume ratio increases: --cooling rate increases --hardness increases Position center surface Cooling rate low high Hardness low high Quenching Medium & Geometry
- 30. Chapter 10 -30 0 10 20 30 40 50 wt% Cu L α+Lα α+θ θ θ+L 300 400 500 600 700 (Al) T(°C) composition range needed for precipitation hardening CuAl2 A Adapted from Fig. 11.24, Callister 7e. (Fig. 11.24 adapted from J.L. Murray, International Metals Review 30, p.5, 1985.) Precipitation Hardening • Particles impede dislocations. • Ex: Al-Cu system • Procedure: Adapted from Fig. 11.22, Callister 7e. --Pt B: quench to room temp. --Pt C: reheat to nucleate small θ crystals within α crystals. • Other precipitation systems: • Cu-Be • Cu-Sn • Mg-Al Temp. Time --Pt A: solution heat treat (get α solid solution) Pt A (sol’n heat treat) B Pt B C Pt C (precipitate θ)
- 31. Chapter 10 -31 • 2014 Al Alloy: • TS peaks with precipitation time. • Increasing T accelerates process. Adapted from Fig. 11.27 (a) and (b), Callister 7e. (Fig. 11.27 adapted from Metals Handbook: Properties and Selection: Nonferrous Alloys and Pure Metals, Vol. 2, 9th ed., H. Baker (Managing Ed.), American Society for Metals, 1979. p. 41.) Precipitate Effect on TS, %EL precipitation heat treat time tensilestrength(MPa) 200 300 400 100 1min 1h 1day 1mo 1yr 204°C non-equil. solidsolution manysmall precipitates“aged” fewerlarge precipitates “overaged” 149°C • %EL reaches minimum with precipitation time. %EL(2insample) 10 20 30 0 1min 1h 1day 1mo 1yr 204°C 149°C precipitation heat treat time
- 32. Chapter 10 -32 Metal Alloy Crystal Stucture Alloys • substitutional alloys – can be ordered or disordered – disordered solid solution – ordered - periodic substitution example: CuAu FCC Cu Au
- 33. Chapter 10 -33 • Interstitial alloys (compounds) – one metal much larger than the other – smaller metal goes in ordered way into interstitial “holes” in the structure of larger metal – Ex: Cementite – Fe3C Metal Alloy Crystal Stucture
- 34. Chapter 10 -34 Metal Alloy Crystal Stucture • Consider FCC structure --- what types of holes are there? Octahedron - octahedral site = OH Tetrahedron - tetrahedral site = TD
- 35. Chapter 10 -35 Metal Alloy Crystal Stucture • Interstitials such as H, N, B, C • FCC has 4 atoms per unit cell metal atoms 2 1 2 1 2 1 2 1 TD sites 4 3 4 1 ,4 3 4 1 , 4 3 4 1 ,4 3 4 1 , 8 TD sites OH sites 2 1 2 1 2 1 2 1 2 1 4 OH sites
- 36. Chapter 10 -36 • Steels: increase TS, Hardness (and cost) by adding --C (low alloy steels) --Cr, V, Ni, Mo, W (high alloy steels) --ductility usually decreases w/additions. • Non-ferrous: --Cu, Al, Ti, Mg, Refractory, and noble metals. • Fabrication techniques: --forming, casting, joining. • Hardenability --increases with alloy content. • Precipitation hardening --effective means to increase strength in Al, Cu, and Mg alloys. Summary
Editor's Notes
- In Chapter 9 we looked at the equilibrium phase diagram . This indicated phase structure if we wait long enough. But due to slow diffusion may not reach equilibrium We need to consider time- kinetics - energy of phase boundaries may be high. – also nucleation Transformation rate How fast do the phase transformations occur? First need nuclei (seeds) to form for the rest of the material to crystallize
- S.A. = surface area