Downloaded 351 times

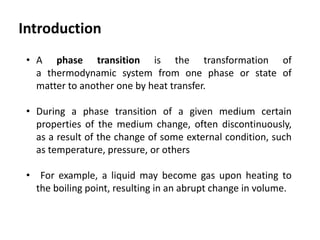

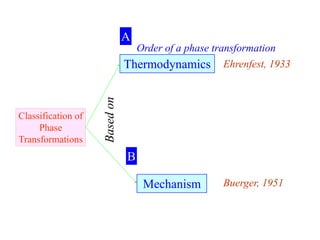
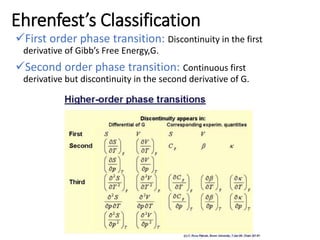
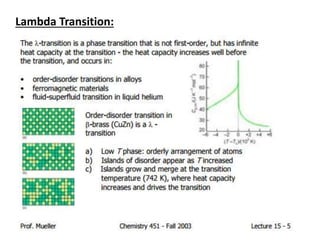

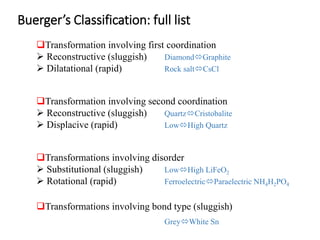
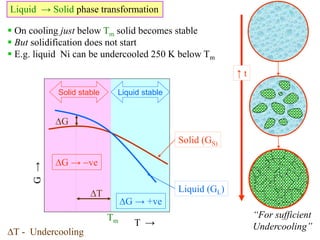
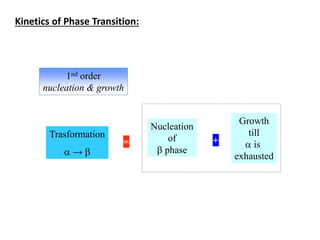
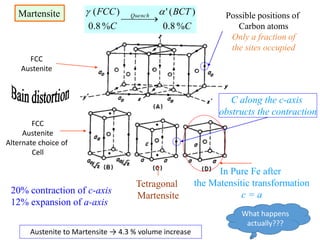
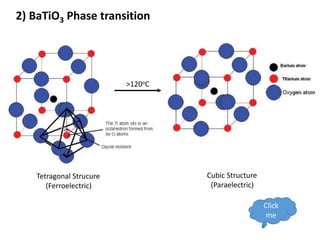
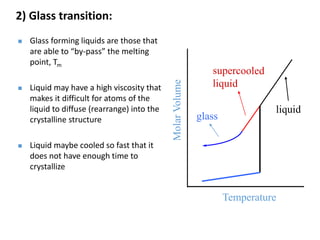
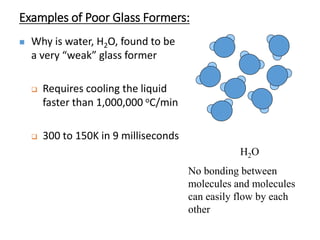
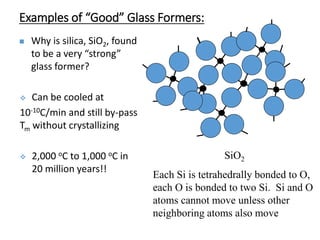
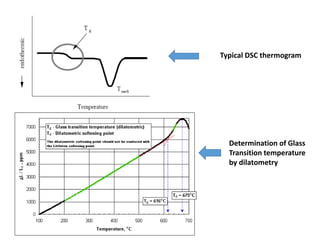

Phase transitions can be classified based on their order, mechanism, and thermodynamics. First order transitions involve a discontinuity in the first derivative of Gibbs free energy. Second order transitions have a continuous first derivative but discontinuity in the second derivative. Reconstructive transitions involve major structure reorganization while displacive transitions involve bond distortion. The kinetics of phase transitions involve nucleation and growth. Martensitic transformations occur via shear without diffusion. The BaTiO3 transition from cubic to tetragonal structure results in it becoming ferroelectric below 120°C. Glass transitions occur when liquids are cooled too fast to crystallize, becoming supercooled liquids called glasses.


![谷歌留痕技术 [ 𝙩𝙤𝙥 𝟮𝟯𝟯. 𝙘 𝙤𝙢 ]](https://cdn.slidesharecdn.com/ss_thumbnails/top233-260130174328-3833018c-thumbnail.jpg?width=640&height=640&fit=bounds)


