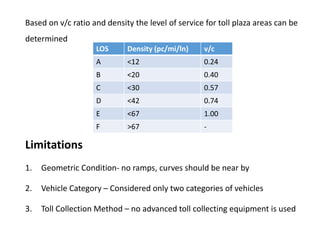
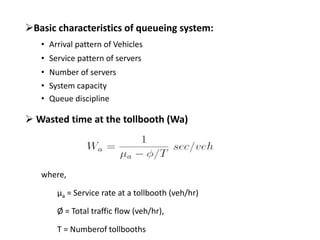
The document discusses various aspects of toll plaza design and operation. It describes how tolls are collected to recover construction and maintenance costs. It also discusses different toll collection methods like manual, coin machines, and electronic toll collection. The optimal number of toll booths is determined using queuing theory to minimize total delay time from queuing and merging. Level of service for toll plazas is based on density and volume-to-capacity ratios. Numerical examples calculate total delay times and the optimum number of toll booths given traffic flow and toll booth parameters.


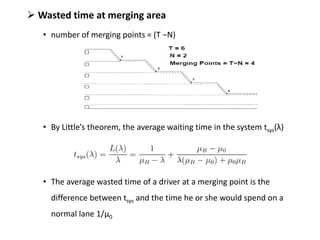
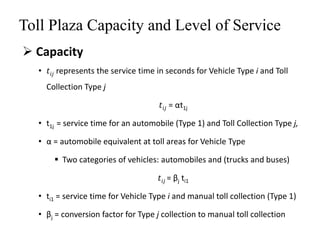
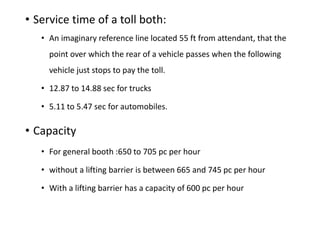
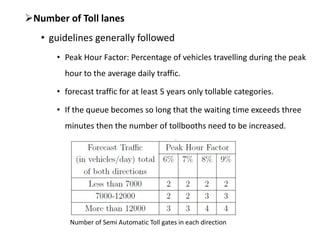
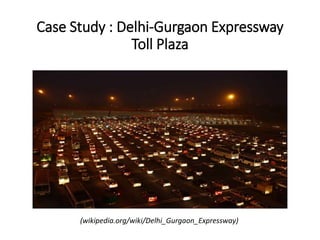
![Therefore the average wasted time of a driver
where
• μB = Service rate when merging of vehicles takes place (veh/hr)
• μ0 = Service rate when no merging of vehicles takes place (veh/hr),
• λ = Vehicle arrival rate = (k/T) × Ø (veh/hr)
• K = No. of conflicting lanes at a merging point. k has a range
between [2, T − N + 1]](https://image.slidesharecdn.com/tollplaza-170405093409/85/Toll-plaza-12-320.jpg)
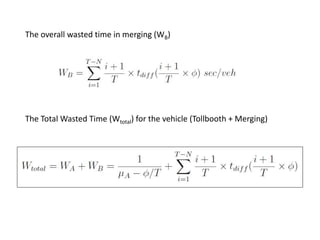
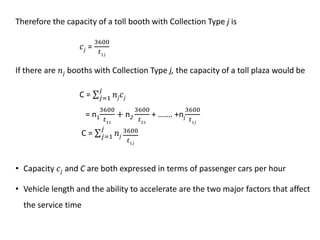
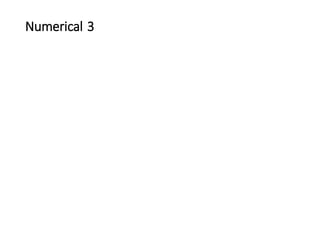
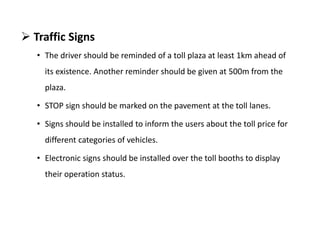
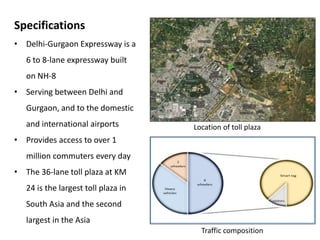
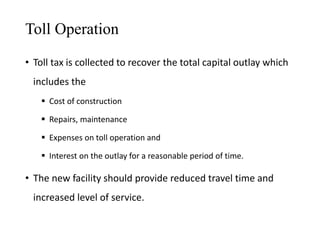
![• Wasted time at tollbooth
WA = 1/(400−(800/3) )=0.0075 hr/veh = 27 sec/veh.
• Wasted time at merging area
k= ranges between [2, T-N+1]. In this case (T=3) k lies between [2,3]
• When K=2
• λ at first merging point = ( 2/3 ) × 800 = 533.3veh/hr.
• Tdiff = 1.166 sec.
• WB for the 1st merging point = ( 2/3 ) × 1.166 = 0.777sec
• When K=3
• λ at second merging point = ( 3/3 ) × 800 = 800 veh/hr
• Tdiff = 2.48 sec.
• WB for the 2st merging point =( 3/3 )×2.48 = 2.48sec.
Total WB=0.777+2.48 = 3.257 sec/veh.
Wtotal= WA+WB= 27.0 + 3.257 = 30.257 sec.](https://image.slidesharecdn.com/tollplaza-170405093409/85/Toll-plaza-16-320.jpg)

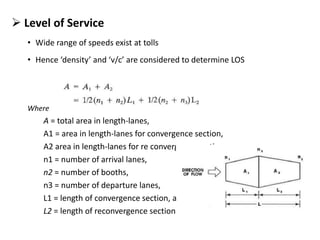
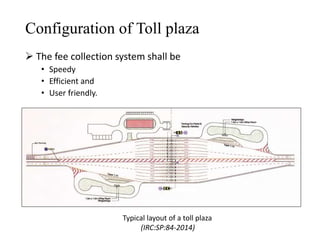
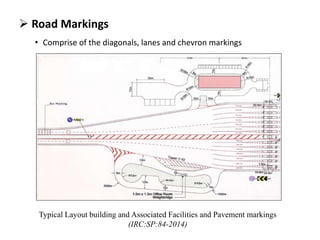
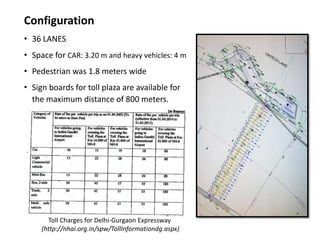
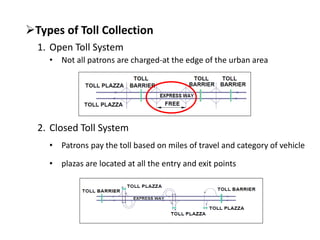
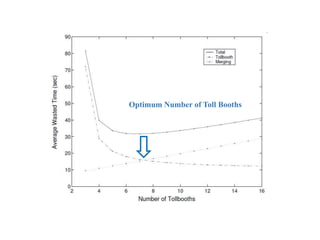
![• Let T=4;
• WA = 1/(350 900/4) = 0.008 hr/veh = 28.8 sec/veh.
• k ranges between [2, T −N +1] in this case (T=4) i.e. [2,4]
• at first merging point = (2/4) * 900 = 450 veh/hr.
• Tdiff=1.307 sec.
• Hence, WB = (2/4) * 1.307 + (3/4) * 3.046 + (4/4) * 8.018 = 6.176 sec.
• Wtotal = 28.8 + 6.176 = 34.976 sec.
k λ (veh/hr) Tdiff (sec) Weightage for WB
2 450 1.307 2/4
3 675 3.046 3/4
4 900 8.018 4/4
T WA WB Wtotal
4 28.8 6.176 34.976
6 18 13.839 31.839
8 15.15 16.805 31.955
10 13.846 19.815 33.661](https://image.slidesharecdn.com/tollplaza-170405093409/85/Toll-plaza-18-320.jpg)