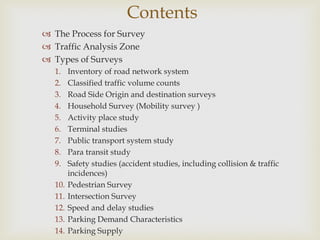
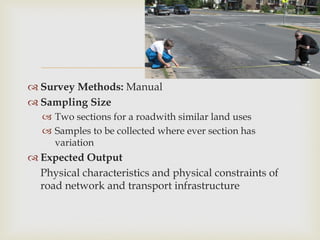
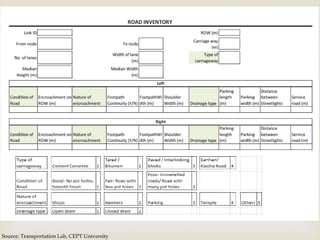
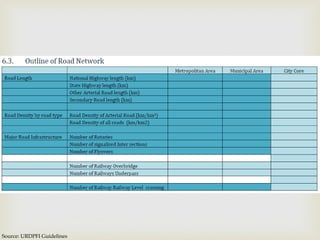
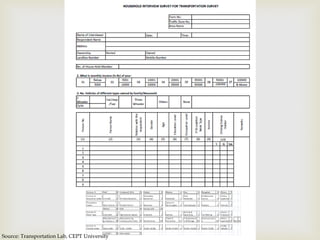
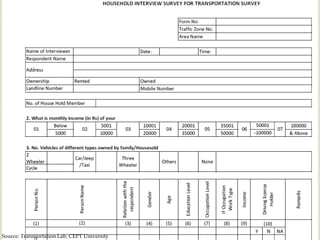
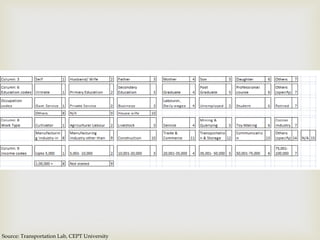
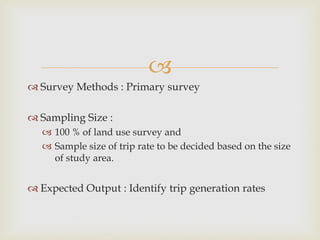
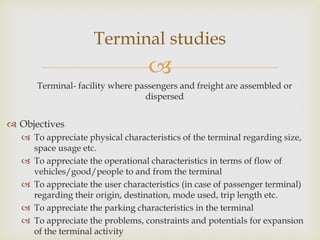
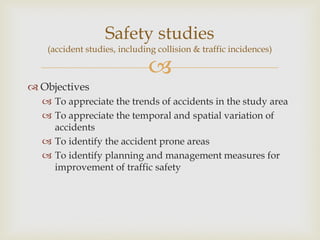
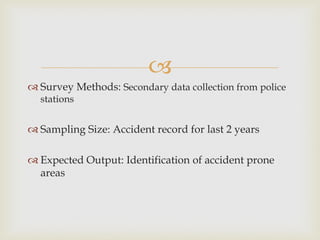
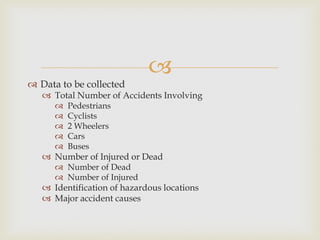
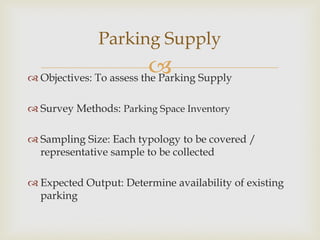
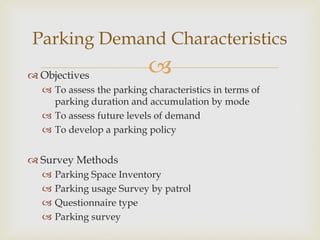
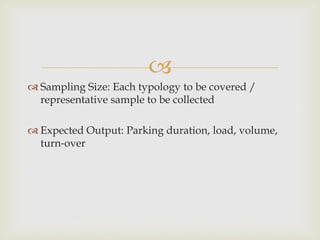
This document outlines various types of transportation surveys that are important for transportation planning, including road network inventory, traffic volume counts, origin-destination surveys, household surveys, economic activity surveys, public transportation studies, safety studies, and parking surveys. The objectives, methodology, sampling approach, and expected outputs are described for each type of survey. Conducting comprehensive transportation surveys is essential for developing an effective transportation plan.
Origin and Destination ( O-D) Study. defined all types very well with advantages and disadvantages. Introduction of OD, Objective of OD Study
Information required for OD
OD Survey Types
Methodology
Road Side Interview Method
License Plate Method
Tag on Car method
Home Interview method
postal method
online survey method
commercial and public vehilce method survey
OD MATRIX
Desire line diagram and Flow Line diagram
Conclusion and Reference.
Urban transportation system meaning ,travel demand functions with factors, design approaches & modeling , types of mass transit system with advantages -disadvantages or limitations , opportunities in mass transport , integrated approach for transit -transportation system
Our project is the complete study about both Spot speed studies and Speed delay time survey. This topic is a part of Transportation Engineering. This report helps you to understand this topic in detail. This report will also help you to make project on associated topics in traffic engineering. In spot speed, We discussed regarding various methods available to perform the test, Our team practically performed test and established a speed limit zone near a school. Coming to speed delay time survey, we conducted a survey at a selected stretch and came out with solutions to the problems faced by the vehicle users using that stretch.
Transportation planning is an integral part of overall urban planning and needs systematic approach.
Travel demand estimation is an important part of comprehensive transportation planning process.
However, planning does not end by predicting travel demand.
The ultimate aim of urban transport planning is to generate alternatives for improving transportation system to meet future demand and selecting the best alternative after proper evaluation.
In today’s world with the ever increasing traffic it is inherent that we immediately find an optimum solution for it so that we can move on from being a developing nation to a super power.
There is a great need to resolve our transportation issues at the earliest as connectivity is of grave importance. Finding a systematic and organized way around the current situation is only going to benefit us in the long run. Better connectivity reduces transportation costs immensely and saves time in traveling.
This presentation talks about the basics of transportation planning. The transportation jargons that are used like ROW, Carriage way etc. It also talks about the Road hierarchy, Intersections, Road Capacity and Level of Service.
This topic bearing Seminar Presentation of Advanced Road Transportation System and Its Planning. Its includes Road Plan, Traffic Control and its applications, spot speed, General Instruction and basic role of ARTS, Conclusion.
Title: Taking Pedestrian and Bicycle Counting Programs to the Next Level
Track: Connect
Format: 90 minute panel
Abstract: Panelists will provide practical guidance for pedestrian and bicycle counting programs based on findings from NCHRP Project 07-19, "Methods and Technologies for Collecting Pedestrian and Bicycle Volume Data."
Presenters:
Presenter: Robert Schneider University of Wisconsin-Milwaukee
Co-Presenter: RJ Eldridge Toole Design Group, LLC
Co-Presenter: Conor Semler Kittelson & Associates, Inc.
exit exam preparatiomn Login code: 92566. Do not give this code to anyone, even if they say they are from Telegram!
This code can be used to log in to your Telegram account. We never ask it for anything else.
If you didn't request this code by trying to log in on another device, simply ignore this message.
Frequency distribution, central tendency, measures of dispersionDhwani Shah
The presentation explains the theory of what is Frequency distribution, central tendency, measures of dispersion. It also has numericals on how to find CT for grouped and ungrouped data.
The presentation gives an introduction to statistics and tries to show the importance of statistics for planners. It talks about the various ways in which the data is categorized and also explains on how to select the chart type to be used depending on what kind of information you want to present.
The presentation talks about why is it necessary to carry out Financial appraisal and the different methods to analyse it. It also discusses the steps involved in a financial appraisal of a project.
This presentation gives an introduction to transportation planning. It talks about what is transportation and its need. It also talks about how transportation has evolved over the period of time and how the city structure and people's behavior changes with it.
Synthetic Fiber Construction in lab .pptxPavel ( NSTU)
Synthetic fiber production is a fascinating and complex field that blends chemistry, engineering, and environmental science. By understanding these aspects, students can gain a comprehensive view of synthetic fiber production, its impact on society and the environment, and the potential for future innovations. Synthetic fibers play a crucial role in modern society, impacting various aspects of daily life, industry, and the environment. ynthetic fibers are integral to modern life, offering a range of benefits from cost-effectiveness and versatility to innovative applications and performance characteristics. While they pose environmental challenges, ongoing research and development aim to create more sustainable and eco-friendly alternatives. Understanding the importance of synthetic fibers helps in appreciating their role in the economy, industry, and daily life, while also emphasizing the need for sustainable practices and innovation.
We all have good and bad thoughts from time to time and situation to situation. We are bombarded daily with spiraling thoughts(both negative and positive) creating all-consuming feel , making us difficult to manage with associated suffering. Good thoughts are like our Mob Signal (Positive thought) amidst noise(negative thought) in the atmosphere. Negative thoughts like noise outweigh positive thoughts. These thoughts often create unwanted confusion, trouble, stress and frustration in our mind as well as chaos in our physical world. Negative thoughts are also known as “distorted thinking”.
The Indian economy is classified into different sectors to simplify the analysis and understanding of economic activities. For Class 10, it's essential to grasp the sectors of the Indian economy, understand their characteristics, and recognize their importance. This guide will provide detailed notes on the Sectors of the Indian Economy Class 10, using specific long-tail keywords to enhance comprehension.
For more information, visit-www.vavaclasses.com
The Roman Empire A Historical Colossus.pdfkaushalkr1407
The Roman Empire, a vast and enduring power, stands as one of history's most remarkable civilizations, leaving an indelible imprint on the world. It emerged from the Roman Republic, transitioning into an imperial powerhouse under the leadership of Augustus Caesar in 27 BCE. This transformation marked the beginning of an era defined by unprecedented territorial expansion, architectural marvels, and profound cultural influence.
The empire's roots lie in the city of Rome, founded, according to legend, by Romulus in 753 BCE. Over centuries, Rome evolved from a small settlement to a formidable republic, characterized by a complex political system with elected officials and checks on power. However, internal strife, class conflicts, and military ambitions paved the way for the end of the Republic. Julius Caesar’s dictatorship and subsequent assassination in 44 BCE created a power vacuum, leading to a civil war. Octavian, later Augustus, emerged victorious, heralding the Roman Empire’s birth.
Under Augustus, the empire experienced the Pax Romana, a 200-year period of relative peace and stability. Augustus reformed the military, established efficient administrative systems, and initiated grand construction projects. The empire's borders expanded, encompassing territories from Britain to Egypt and from Spain to the Euphrates. Roman legions, renowned for their discipline and engineering prowess, secured and maintained these vast territories, building roads, fortifications, and cities that facilitated control and integration.
The Roman Empire’s society was hierarchical, with a rigid class system. At the top were the patricians, wealthy elites who held significant political power. Below them were the plebeians, free citizens with limited political influence, and the vast numbers of slaves who formed the backbone of the economy. The family unit was central, governed by the paterfamilias, the male head who held absolute authority.
Culturally, the Romans were eclectic, absorbing and adapting elements from the civilizations they encountered, particularly the Greeks. Roman art, literature, and philosophy reflected this synthesis, creating a rich cultural tapestry. Latin, the Roman language, became the lingua franca of the Western world, influencing numerous modern languages.
Roman architecture and engineering achievements were monumental. They perfected the arch, vault, and dome, constructing enduring structures like the Colosseum, Pantheon, and aqueducts. These engineering marvels not only showcased Roman ingenuity but also served practical purposes, from public entertainment to water supply.
Welcome to TechSoup New Member Orientation and Q&A (May 2024).pdfTechSoup
In this webinar you will learn how your organization can access TechSoup's wide variety of product discount and donation programs. From hardware to software, we'll give you a tour of the tools available to help your nonprofit with productivity, collaboration, financial management, donor tracking, security, and more.
Ethnobotany and Ethnopharmacology:
Ethnobotany in herbal drug evaluation,
Impact of Ethnobotany in traditional medicine,
New development in herbals,
Bio-prospecting tools for drug discovery,
Role of Ethnopharmacology in drug evaluation,
Reverse Pharmacology.
This is a presentation by Dada Robert in a Your Skill Boost masterclass organised by the Excellence Foundation for South Sudan (EFSS) on Saturday, the 25th and Sunday, the 26th of May 2024.
He discussed the concept of quality improvement, emphasizing its applicability to various aspects of life, including personal, project, and program improvements. He defined quality as doing the right thing at the right time in the right way to achieve the best possible results and discussed the concept of the "gap" between what we know and what we do, and how this gap represents the areas we need to improve. He explained the scientific approach to quality improvement, which involves systematic performance analysis, testing and learning, and implementing change ideas. He also highlighted the importance of client focus and a team approach to quality improvement.
The French Revolution, which began in 1789, was a period of radical social and political upheaval in France. It marked the decline of absolute monarchies, the rise of secular and democratic republics, and the eventual rise of Napoleon Bonaparte. This revolutionary period is crucial in understanding the transition from feudalism to modernity in Europe.
For more information, visit-www.vavaclasses.com
2. The Process for Survey
Traffic Analysis Zone
Types of Surveys
1. Inventory of road network system
2. Classified traffic volume counts
3. Road Side Origin and destination surveys
4. Household Survey (Mobility survey )
5. Activity place study
6. Terminal studies
7. Public transport system study
8. Para transit study
9. Safety studies (accident studies, including collision & traffic
incidences)
10. Pedestrian Survey
11. Intersection Survey
12. Speed and delay studies
13. Parking Demand Characteristics
14. Parking Supply
Contents
3.
The Process for Survey
1. Define the purpose
and usage
2. Define the data collection
Objectives and Constraints
3. Identify the target
population and area
4. Select Survey Mode
and Sampling
Procedure
5. Develop Survey
Questionnaire
6. Survey
Implementation
7. Post processing
4.
The area for which you want to carry out the
study/ propose a transportation plan.
Depending on the need for the study, your
area can be-
State
A particular region
City
Study Area
5.
Geographic areas dividing the planning region into
relatively similar areas of land use and land activity.
Zones represent the origins and destinations of travel
activity within the region.
Every household, place of employment, shopping
center, and other activity are first aggregated into
zones and then further simplified into a single node
called a centroid.
Traffic Analysis Zone
6.
TAZs serve as the primary unit of analysis in a travel
demand forecasting model. TAZs are where trips
begin and end.
The smaller the TAZs, the more accurate the
forecasts might be. It depend on what scale you want
to analyse- at state level, city level etc.
One should consider roadway network and physical
geography when delineating TAZ boundaries.
7.
Those zones outside the study area along the model
boundaries are defined as external zones. To
accurately reflect travel patterns within the study
area, the study area should be large enough so that
nearly all (over 90 percent) of the trips begin and end
within the study area.
Intrazonal trips are those that are short enough to
begin and end within the same zone and, thus are
not assigned to the roadway network.
8. A single movement from Origin to Destination for a
particular purpose is called a Trip.
People travel to reach their activities at different
destinations.
Trip
Home
Work
Schools
Shops
10.
Inventory of road network system
“Inventory” - a complete list of items
Review of existing transport infrastructure and
facilities, including:
Flyovers/ underpasses,
Major intersections,
Parking/ Pedestrian / NMV facilities,
Level Railway Crossings
Road Inventory
11.
Objectives
To appreciate the physical characteristics of the identified
road network in terms of right of‐ way, carriage way,
number of access points, surface type, etc.
To identify physical constraints and bottleneck points along
the identified road network.
To assess the capacity potential of the identified road
network
To understand the existing transport situation in order to
develop a rational land use and transport plan and mobility
improvement measures.
12.
Survey Methods: Manual
Sampling Size
Two sections for a roadwith similar land uses
Samples to be collected where ever section has
variation
Expected Output
Physical characteristics and physical constraints of
road network and transport infrastructure
17.
This survey is carried out to understand the variety of
vehicles that passes through a road over 24 hours a day/
to get Average Daily Traffic (ADT).
Objectives
To appreciate traffic characteristics in terms of size,
composition and variation – directional and temporal (wrt
time).
To appreciate the spatial distribution of traffic
To establish the level of service on the road network system
Classified Volume Counts (CVC)
18. Survey Methods
Manual Method
Video Photography
Using automatic devices like Sensors
Sensors
Manual Method
Video Photography
19.
Sampling Size
The traffic volume count surveys should be carried out
continuously for 24 hours of the day, for three to seven
days to get Average Daily Traffic (ADT)
Expected Output
Traffic Characteristic of the study area
Traffic volume
Spatial distribution of traffic
Circulation of traffic
22. Road Side Origin and destination surveys at
Cordon and
Screen lines
Road Side Origin and Destination
Surveys
An imaginary line
circumscribing the boundary
of the study area is termed as
the cordon line.
Imaginary lines along the
physical and natural barriers,
having road crossing points
within the study area, are
termed as screen lines.
23.
Objectives
To appreciate the traffic characteristics
To appreciate the desired patterns of passenger
and goods traffic
To assess the intensity of through and destined
traffic
To use in model validation
24. Survey Methods
Road Side Interview Method (RSI)
Registration Number Plate survey
RSI
Registration Number Plate survey
using surveillance camera
25.
Sampling Size: The survey should normally be
conducted for three consecutive days, on sample
basis, if possible during a representative week in the
year and must encompass the weekly market day
and one working day
Expected Output
Travel pattern
O‐D matrix to calibrate a transport demand model
28.
Objectives
To get the socio‐economic characteristics of the
household
To get the travel characteristics of the household (total
trips, purpose of trips, mode used, trip length, trip
origin and destination etc.)
To appreciate desired pattern of traffic
To get an opinion (of the residents of the study area)
regarding general transport problems of the city and
the probable areas of improvement.
Household Survey
(Mobility survey)
29.
Survey Methods: Household interviews
Sampling Size
Population Sampling rate
<50,000 1 in 5
50,000‐ 1,50,000 1 in 8
1,50,000 – 3,00,000 1 in 15
3,00,000‐ 5,00,000 1 in 20
>10,00,000 1 in 25
30.
Expected Output
Socio‐economic profile of the study area, number of
trips, purpose of trips, mode used, trip length, trip
origin and destination, vehicle ownership
36.
Objectives
To appreciate the activity pattern in terms of type and
intensity
To appreciate the employment levels by type of
activity
To appreciate the trip and other characteristics of
employees
To develop trip production and attraction rates by
type and intensity of activities
Activity place study/
Economic Activity Survey
37.
Survey Methods : Primary survey
Sampling Size :
100 % of land use survey and
Sample size of trip rate to be decided based on the size
of study area.
Expected Output : Identify trip generation rates
38.
39.
Terminal- facility where passengers and freight are assembled or
dispersed
Objectives
To appreciate physical characteristics of the terminal regarding size,
space usage etc.
To appreciate the operational characteristics in terms of flow of
vehicles/good/people to and from the terminal
To appreciate the user characteristics (in case of passenger terminal)
regarding their origin, destination, mode used, trip length etc.
To appreciate the parking characteristics in the terminal
To appreciate the problems, constraints and potentials for expansion
of the terminal activity
Terminal studies
40. Survey Methods
Inventory
User surveys
Operator Surveys
Sampling Size : Sample size to be decided based on the
size and characteristics of study area and availability of
users
Expected Output : Physical characteristics of the terminal,
operational characteristics in terms of flow of
vehicles/good/people, parking characteristics in the
terminal
41.
Objectives
To appreciate system and operational characteristics
To appreciate the performance and economic
characteristics
Survey Methods
Inventory
User surveys
Operator Surveys
Public transport system study
42.
Sampling Size: Sample size to be decided based on
the size and characteristic of study area
Expected Output : System and operational
characteristics
43.
Para transit
informal means of transit,
share autos, share taxis, maxi cabs etc moving people
across short distances
Objectives
To appreciate role and function of Para transit
To appreciate the system characteristics of Para transit
To appreciate characteristics Para transit users
Para transit study
44.
Survey Methods
Inventory
User surveys
Operator Surveys
Sampling Size : Sample size to be decided based on
the size and characteristic of study area
Expected Output: System and operational
characteristics
45. Bus Stand To Mayagara halli
Sr. No.
GPS
Point Start Time
Boarding
(No.)
Drop Off
(No.) Origin Destination Fare
1 2 3:46 12 0 Bus Stand B.G.S Rotery Hospital 5
2 3 3:48 9 3 B.G.S Rotery Hospital Gandhinagara 5
3 4 3:52 8 1 Gandhinagara S.P Office 5
4 5 3:57 8 0 S.P Office Vijay Nagar 5
5 6 4:04 7 3 Vijay Nagar Gausia Collage 5
6 7 4:11 6 1 Gausia Collage S B Doddi 5
7 8 4:21 6 1 S B Doddi Madapura 10
8 9 4:29 5 5 Madapura Mayagara halli 10
1 10 4:40 8 5 Mayagara halli Madapura 5
2 11 4:47 3 1 Madapura S B Doddi 5
3 12 4:55 3 0 S B Doddi Gausia Collage 5
4 13 5:00 4 0 Gausia Collage Vijay Nagar 5
5 14 5:09 5 0 Vijay Nagar S.P Office 5
6 15 5:13 7 0 S.P Office Gandhinagara 5
7 16 5:17 8 1 Gandhinagara B.G.S Rotery Hospital 10
8 17 5:24 7 7 B.G.S Rotery Hospital Bus Stand 10
46. Volume Counts
Along
Across
Objectives
To appreciate pedestrian characteristics in terms of size
composition and variation – directional and temporal.
To appreciate the spatial distribution
Safety: Continuity of street lighting for carriageway and
pavements
Comfort: Continuity of shade, provision of access ramps
Convenience: Presence of pedestrian pathfinding signage,
street furniture such as garbage bins, seating, drinking
water
Pedestrian Survey
47.
Survey Methods
Manual Counts
Video
Sampling Size: Day count will then give the Average
Daily Traffic (ADT)
Expected Output: number of pedestrians and need for
additional pedestrian facilities
49.
Intersection Survey
Intersection Turning Movement Survey
Queue length Survey
Objectives
Measures turning movements at key intersections
during the morning and evening peak hours.
A queue length survey at major bottlenecks can show
the severity of traffic congestion quantitatively.
Intersection Survey
50.
Survey Methods : Manual counts
Sampling Size
Directional movement of traffic in the peak hour
Counts for 2 hours each in the morning and evening
peak periods unless there exist extended peak hours.
Expected Output : Performance characteristics of an
Intersection
51.
52.
53.
Objectives
To get the journey and running speed along the road
network
To identify the bottleneck point
To quantity delays and identify factors causing delay
Speed and delay studies
54.
Survey Methods
Moving Observer method
Registration Number Method
Sampling Size: The average of around six runs
Expected Output: Journey and running speed, travel
time, delay causing factors
57.
Objectives
To appreciate the trends of accidents in the study area
To appreciate the temporal and spatial variation of
accidents
To identify the accident prone areas
To identify planning and management measures for
improvement of traffic safety
Safety studies
(accident studies, including collision & traffic incidences)
58.
Survey Methods: Secondary data collection from police
stations
Sampling Size: Accident record for last 2 years
Expected Output: Identification of accident prone
areas
59.
Data to be collected
Total Number of Accidents Involving
Pedestrians
Cyclists
2 Wheelers
Cars
Buses
Number of Injured or Dead
Number of Dead
Number of Injured
Identification of hazardous locations
Major accident causes
60. Objectives: To assess the Parking Supply
Survey Methods: Parking Space Inventory
Sampling Size: Each typology to be covered /
representative sample to be collected
Expected Output: Determine availability of existing
parking
Parking Supply
61. Objectives
To assess the parking characteristics in terms of
parking duration and accumulation by mode
To assess future levels of demand
To develop a parking policy
Survey Methods
Parking Space Inventory
Parking usage Survey by patrol
Questionnaire type
Parking survey
Parking Demand Characteristics
62.
Sampling Size: Each typology to be covered /
representative sample to be collected
Expected Output: Parking duration, load, volume,
turn‐over