Downloaded 104 times
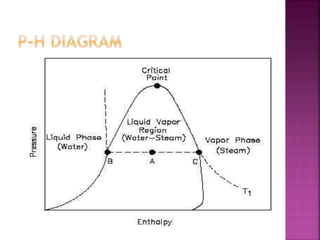

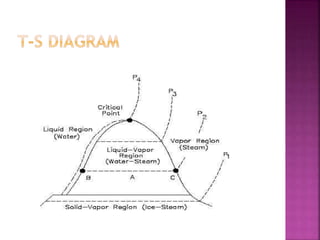


This document discusses different types of thermodynamic diagrams used to analyze thermodynamic processes and systems. It describes P-h, T-s, and H-T diagrams. A P-h diagram shows pressure vs enthalpy and can be used for any pure substance. It has liquid-vapor regions where two phases coexist. A T-s diagram, which is frequently used to analyze energy transfer systems, shows temperature vs entropy. It also has a liquid-vapor region where two phases coexist and the heat of a process equals the area under the T-s curve. Both P-h and T-s diagrams exhibit similar features and can be constructed for any pure substance.


