This document discusses various thermodynamic diagrams used for boiler calculations, including:
- Temperature-heat (T-Q) diagrams which show the heat transfer characteristics of heat exchangers and boiler components.
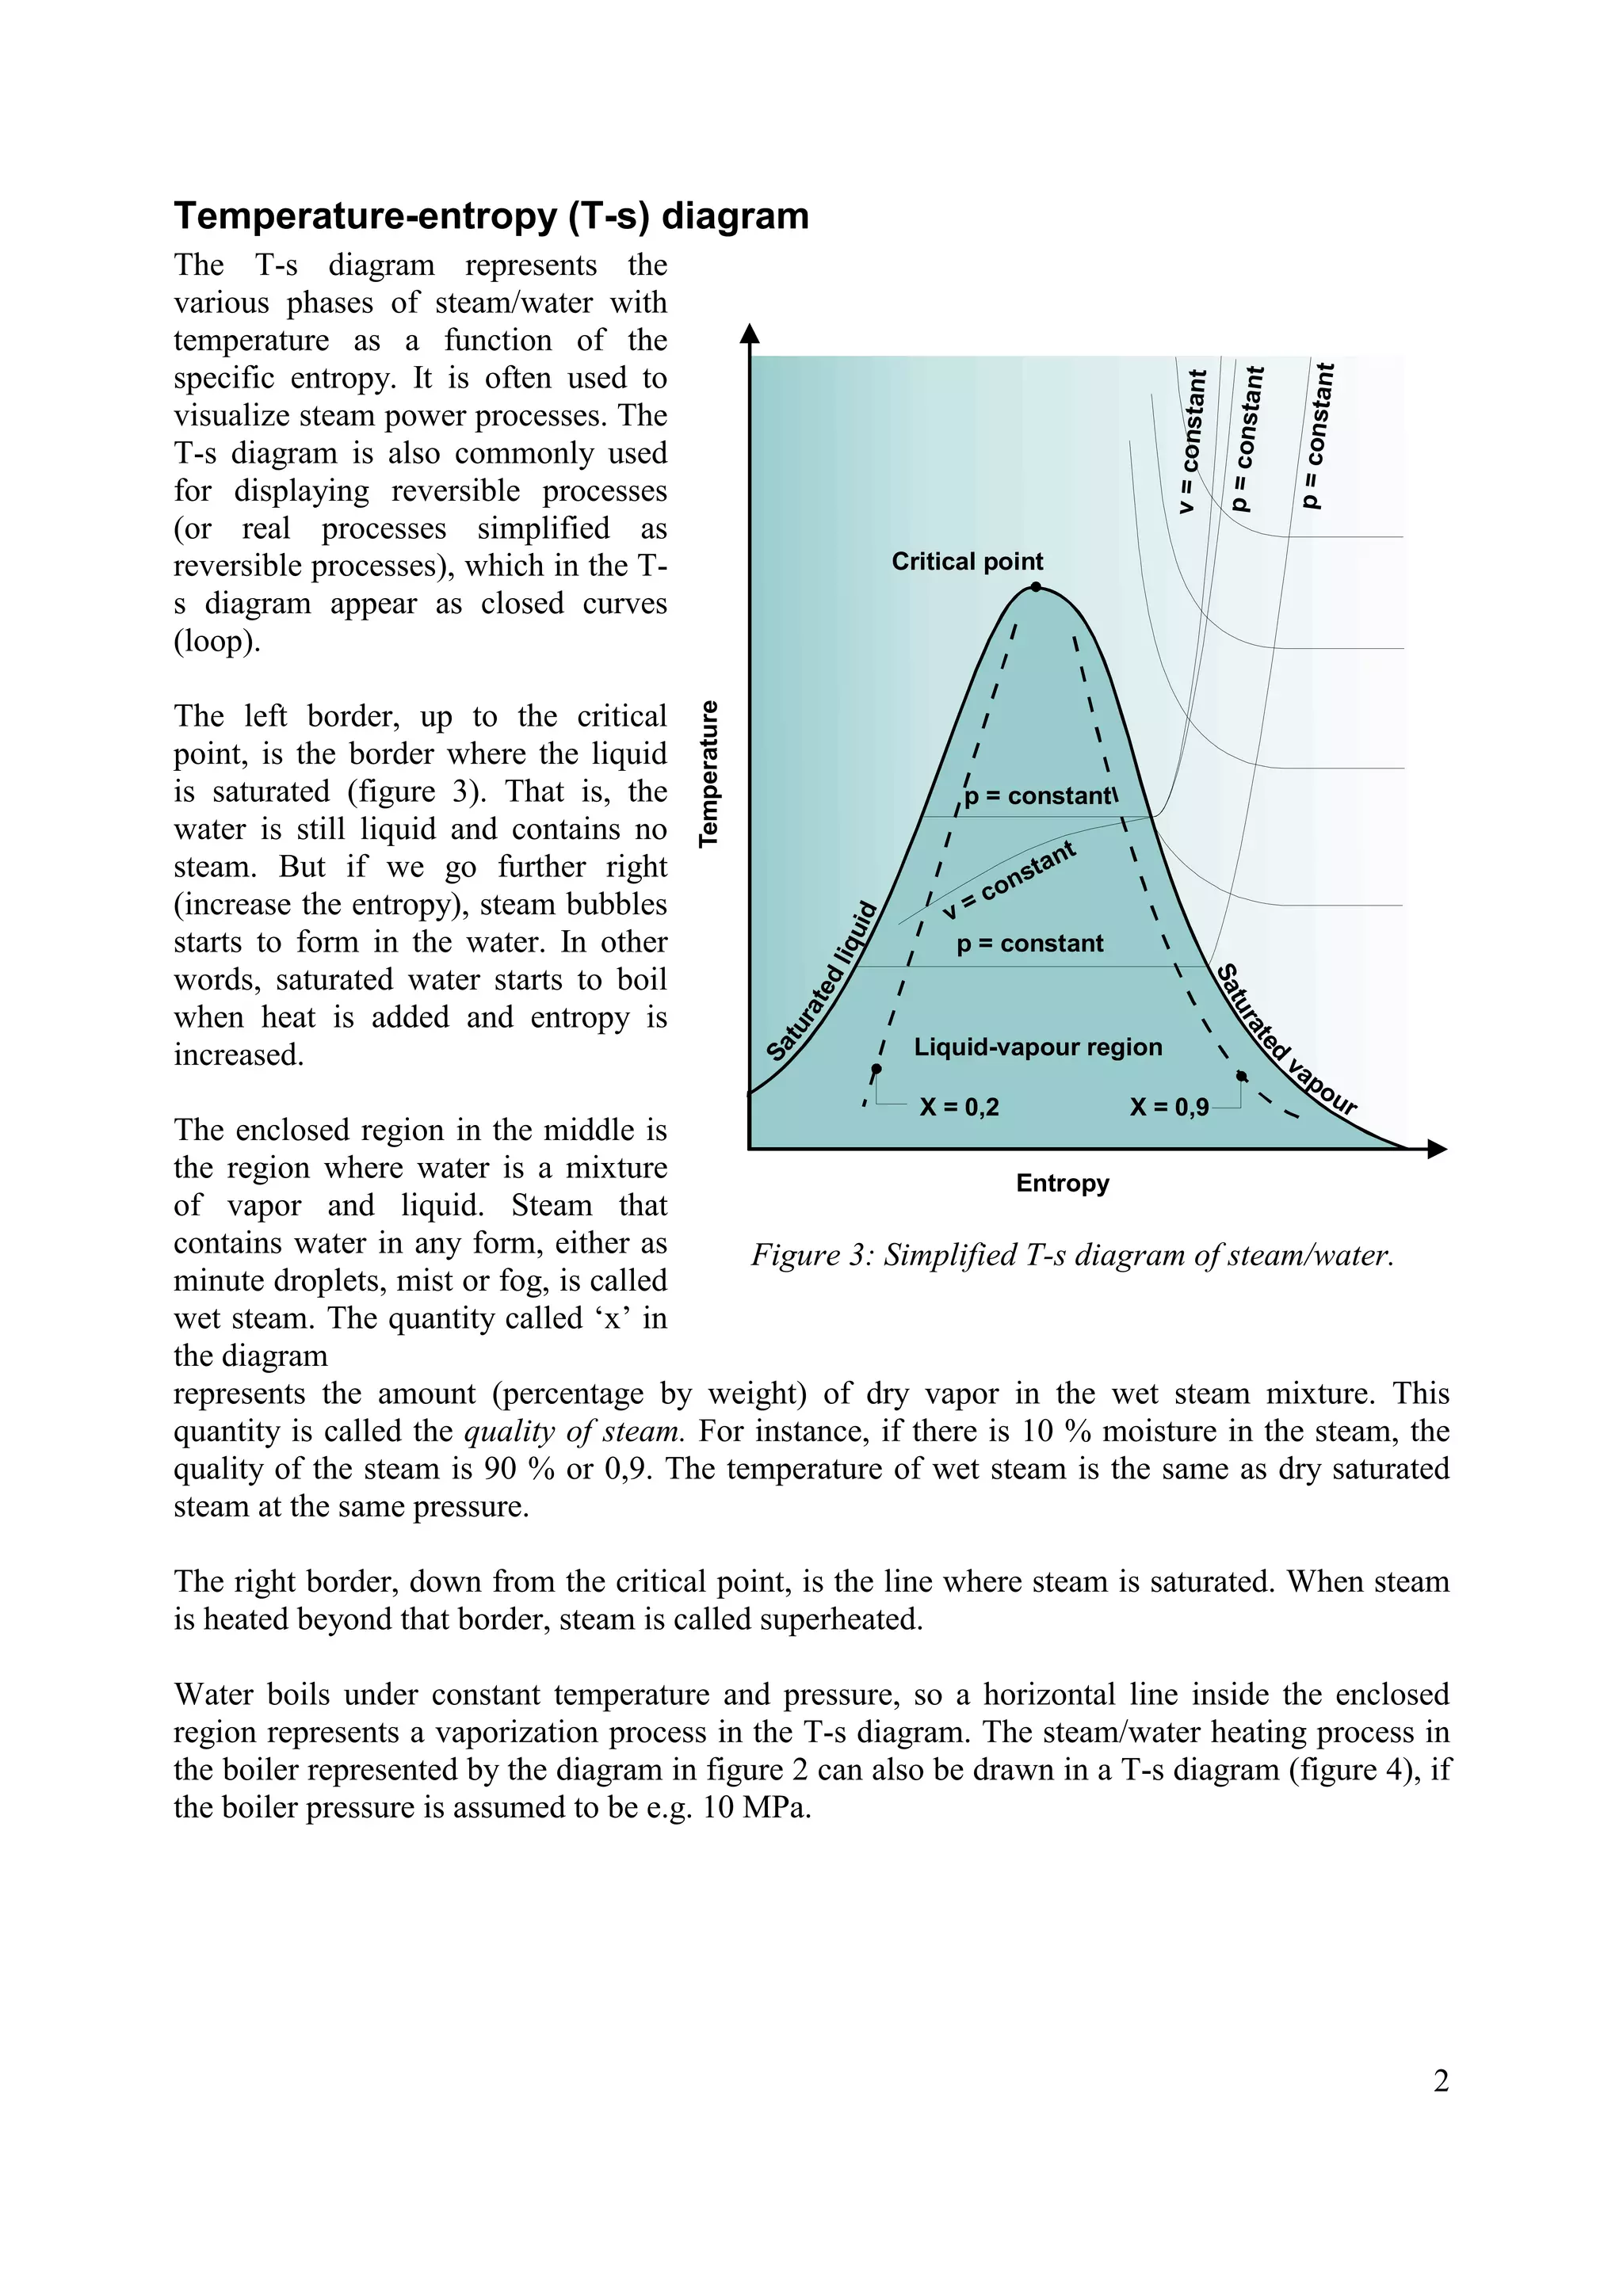
- Temperature-entropy (T-s) diagrams which represent the phases of steam/water and can display steam processes.
- Pressure-enthalpy (p-h) diagrams which make it easy to visualize the heat load shares on different boiler surfaces.
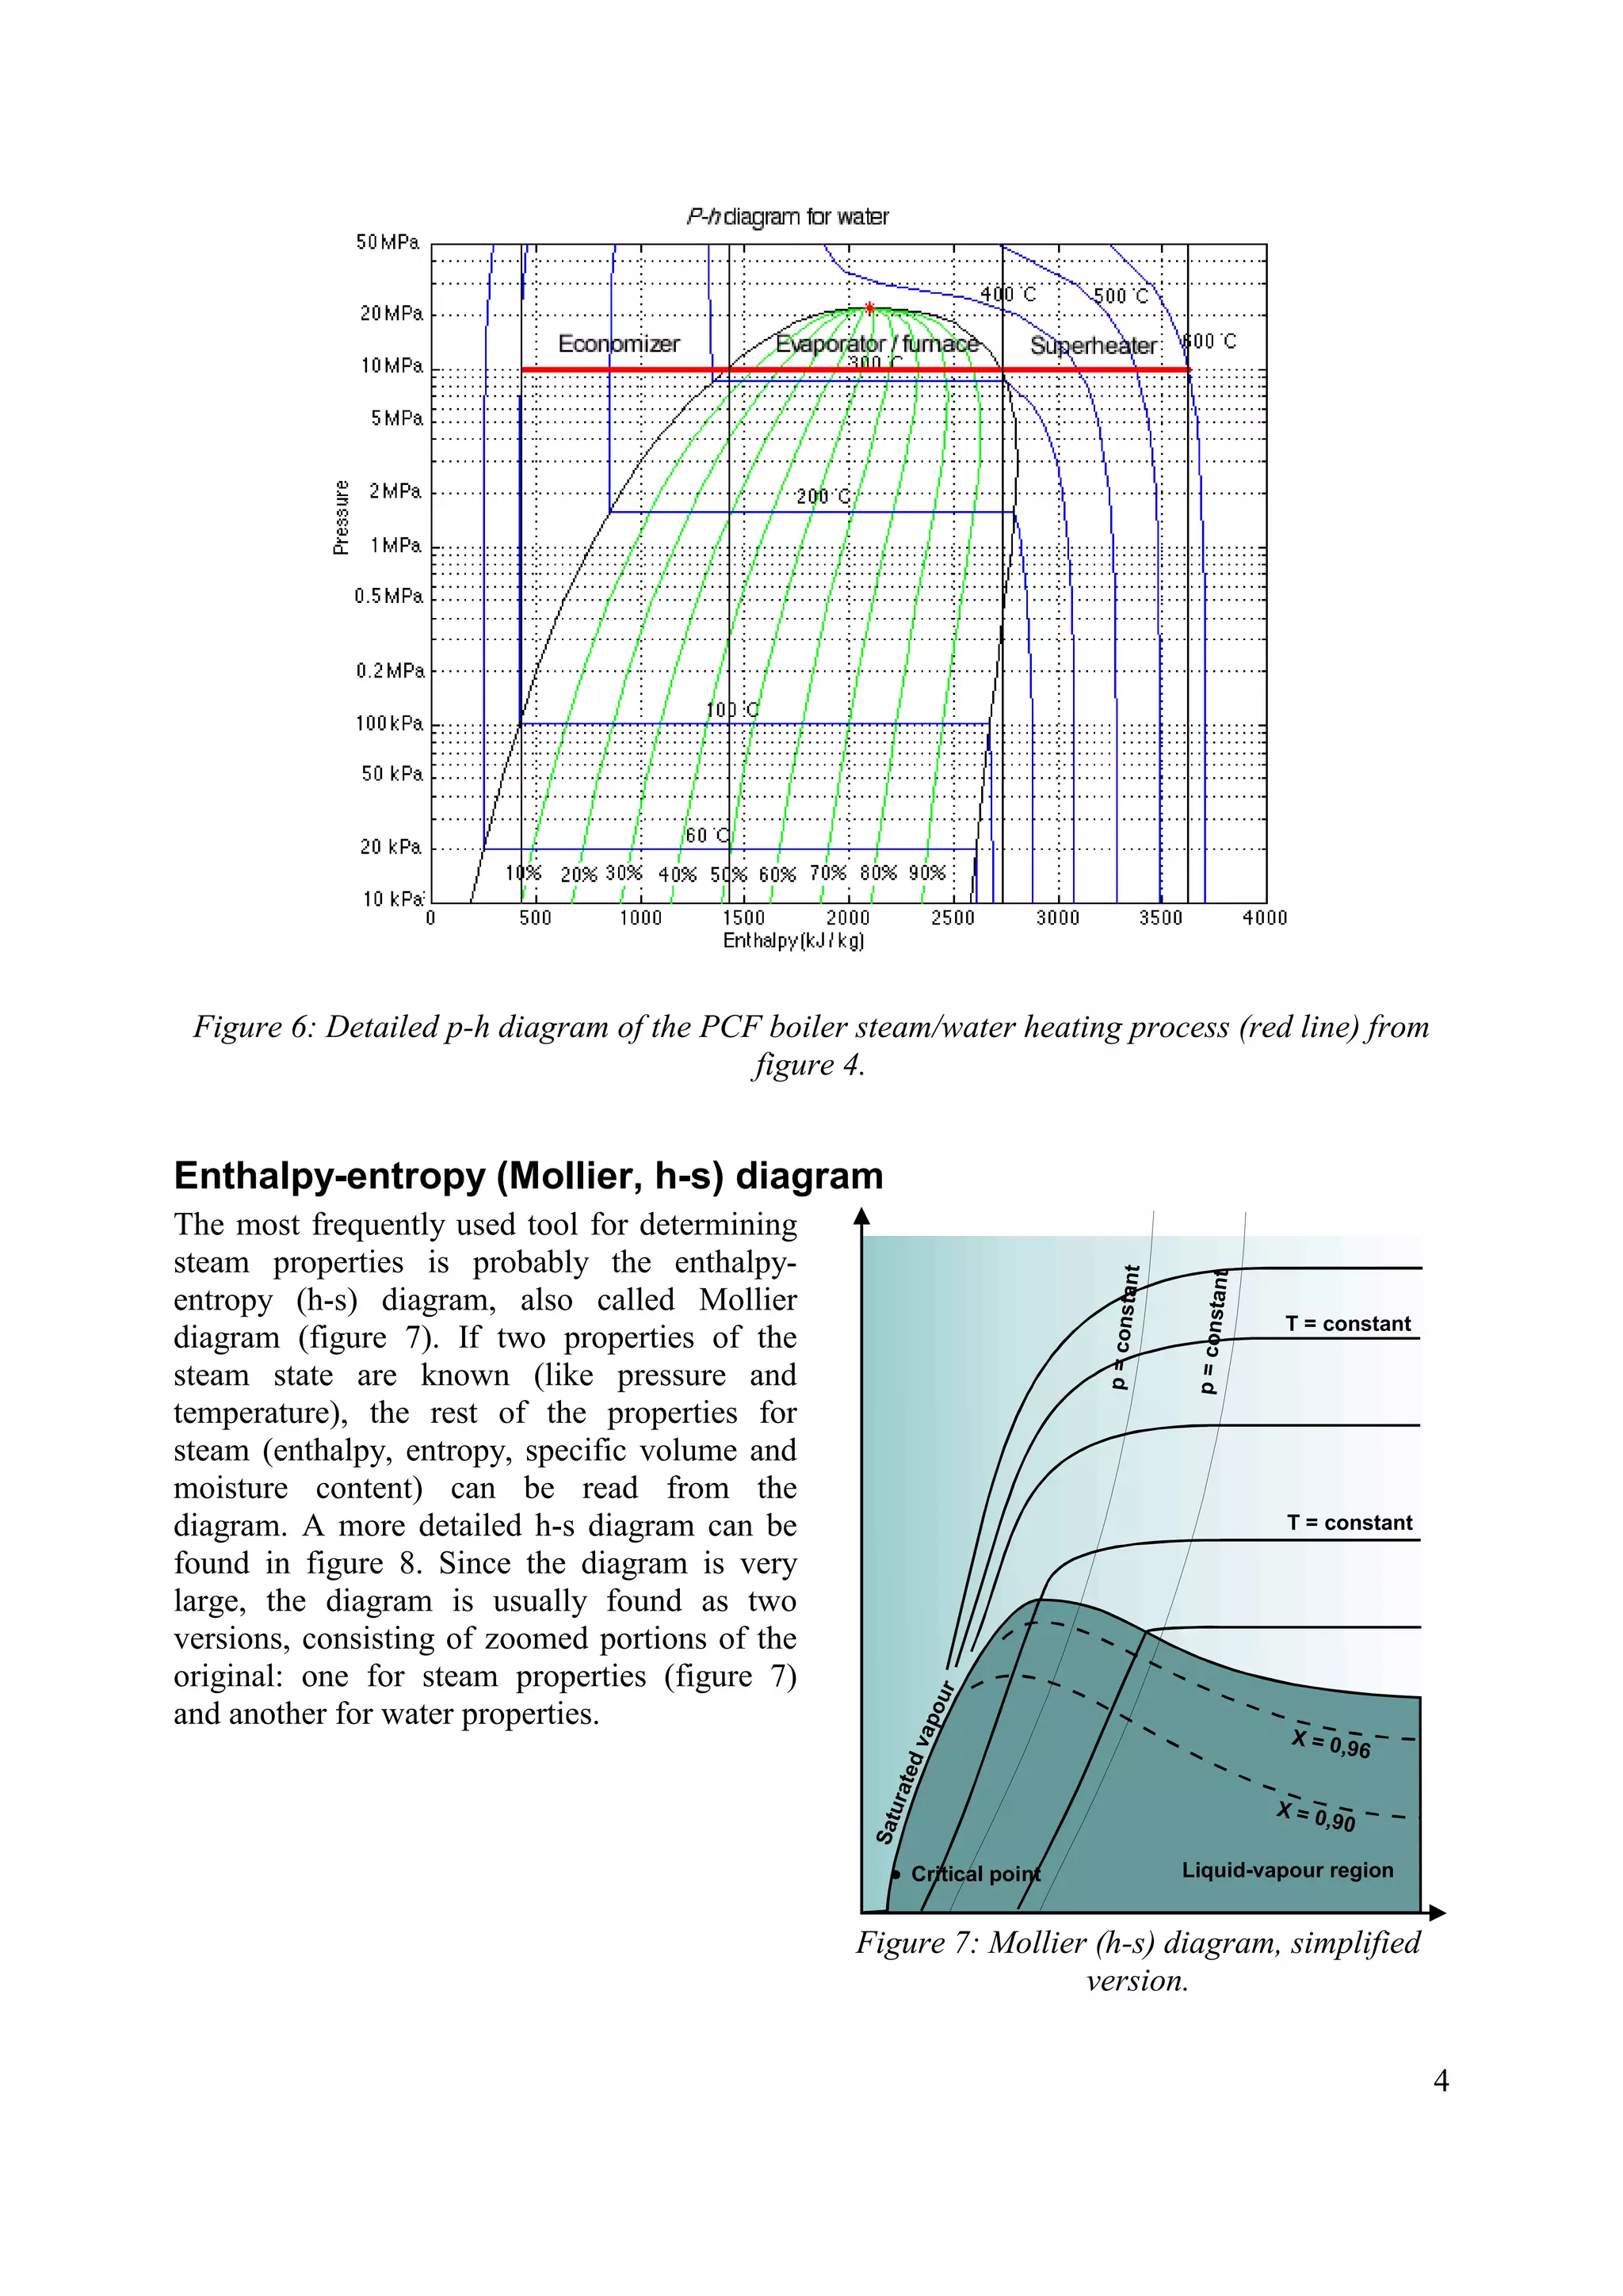
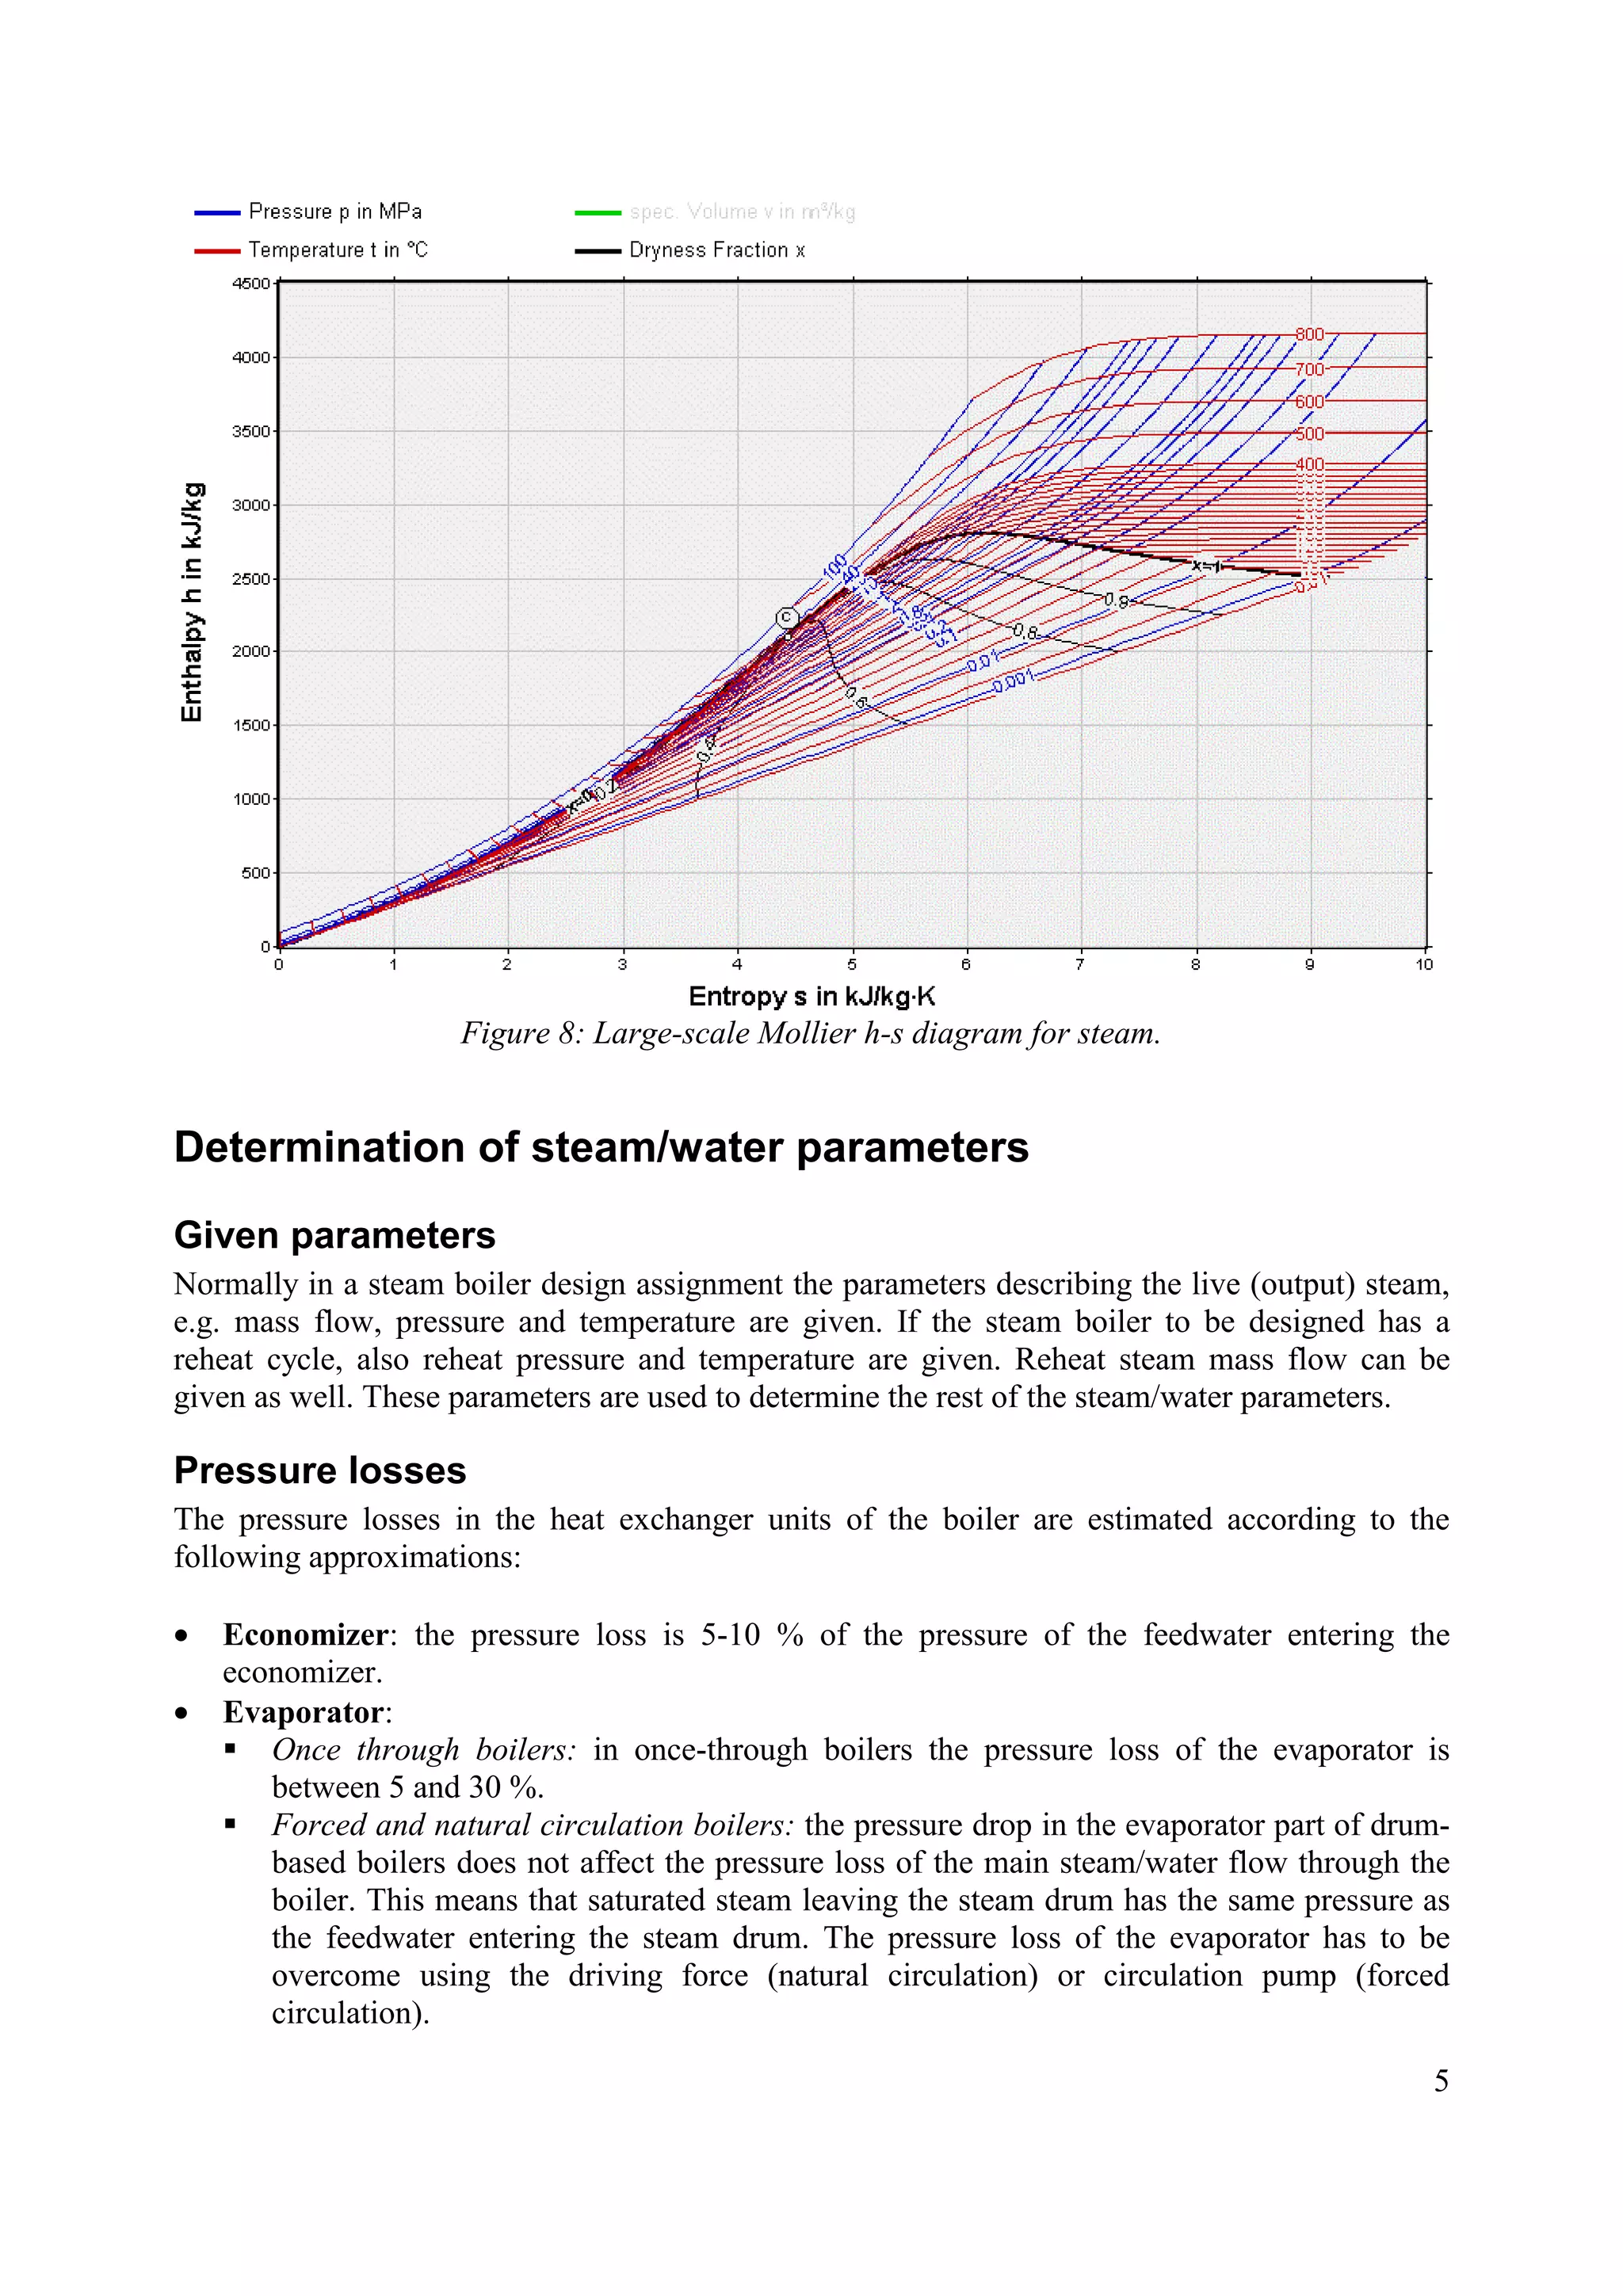
- Enthalpy-entropy (Mollier) diagrams which allow determining steam properties from two known parameters like pressure and temperature.
These diagrams provide useful visualization tools for designing and analyzing boiler performance and steam processes.


![1
Steam/water diagrams used in boiler calculations
Temperature-heat (T-Q) diagram
The T-Q diagram is a useful tool for designing heat exchangers. It can also be used to present the
heat transfer characteristics of an existing heat exchanger or heat exchanger network. The T-Q
diagram consists of two axes: The current stream temperature on the y-axis and the amount of
heat transferred on the x-axis. Sometimes the streams are marked with arrowheads to clarify the
direction of the streams, but these are not necessary: since heat cannot move from the colder
stream to the hotter stream according to the second law of thermodynamics, the directions of the
streams are explicitly determined: The hot stream transfers its heat to the cold stream, thus the
flow direction of the hot stream is towards lower temperature and the flow direction of the cold
stream is towards higher temperatures. For the same reason, the hot stream is always above the
cold stream in the T-Q diagram (figure 1).
Figure 1: Examples of T-Q diagrams for a parallel flow heat exchanger (left), and a counter (or
cross) flow heat exchanger (middle). The hot stream is marked with red color and the cold with
blue color.
When designing or
reviewing heat
exchanger networks, the
T-Q diagram gets useful.
The T-Q diagram is
therefore applied when
designing boilers;
especially the heat
exchanger surface
arrangement can be
clearly visualized with a
T-Q diagram (figure 2).
0
200
400
600
800
1000
1200
1400
1600
0 % 10 % 20 % 30 % 40 % 50 % 60 % 70 % 80 % 90 % 100 %
Share of heat load [%]
Temperature[°C]
Flue gas stream
Water/steam stream
Air stream
Furnace
Superheater Economizer
Air preheater
Figure 2: Example of a T-Q diagram representing the heat surfaces
in a PCF boiler.](https://image.slidesharecdn.com/boilercalculations-170214190017/75/Boiler-calculations-3-2048.jpg)
![3
Figure 4: Detailed T-s diagram of the PCF boiler steam/water heating process from figure 2
(note: color of the steam/water process line is changed from blue to red).
Pressure-enthalpy (p-h) diagram
Another tool used in boiler
calculation is the pressure-
enthalpy diagram for
steam/water (figure 5).
With the p-h diagram it is
easy to visualize the partial
shares of the total heat load
on different heat exchanger
surfaces in the boiler:
drawing the steam heating
process in the boiler onto
the p-h diagram will give a
horizontal line (if we
simplify the process and
set pressure losses to zero).
Figure 6 shows the same
boiler steam/water process
from figure 4, drawn in the
steam/water p-h diagram.
60 °C
100 °C
200 °C
300 °C
400 °C 500 °C 600 °C
0 500 1000 1500 2000 2500 3000 3500 4000
10 kPa
100 kPa
1 MPa
10 Mpa
20 MPa
50 MPa
Enthalpy [kJ/kg]
Pressure
Critical point
Saturatedvapor
Saturatedliquid
Figure 5: Simplified p-h diagram for steam/water.](https://image.slidesharecdn.com/boilercalculations-170214190017/75/Boiler-calculations-5-2048.jpg)

![7
Superheaters and reheaters
Reheating takes usually place in two stages.
The pressure before the reheater is the reheated
steam pressure added on the pressure loss in
the reheater. The steam goes through a high-
pressure turbine before it enters the reheater. In
the high-pressure turbine, the specific enthalpy
of steam decreases according to the isentropic
efficiency of the turbine. Isentropic efficiency
is normally between 0,8 and 0,9. A part of the
low-pressure steam coming from high-pressure
turbine continues to the high-pressure
feedwater heater (closed-type feedwater
heater). However, the mass flow rate of
reheated steam is still 85-90 % of that of the
live steam.
Superheating is often applied in three stages
having spray water groups between each other
to reduce steam temperature when necessary.
Between reheaters, the steam temperature is
controlled using other means. Spray water
group dimensioning is usually based on a
I II III
354
410
435
475
505
535
t °C
Heat load
Figure 9: An example of the heat load share of
superheater stages.
steam temperature decrease of 15-40 °C by water spraying. Spray water originates normally from
the feedwater line before the economizer. Thus the pressure difference is the pressure loss of the
heat transfer surfaces between the economizer inlet and the location of the spray water nozzle.
An example of a possible heat load share between the superheater stages is shown in figure 9.
Pressure loss in superheaters can be divided into equal partial pressure losses corresponding to
each superheater stage. Pressure loss of the spray nozzles can be neglected. Temperature rise
over all superheaters can be divided into quite similar parts along the same principle.
Spray water group mass flow
Normally the mass flow rate of superheated steam (live steam) is known. Thus, mass flow rate
calculations start usually by calculating the mass flow rate of spray water to the last spray water
group (which is in this example between the second and third superheater stages). The mass flow
rates can be solved with energy and mass balance equations. With the equations below (equation
1), the mass flow rate of steam after second superheater stage and mass flow rate of spray water
to the last spray water group can be calculated. The mass flow rate of spray water to the first
spray water group can be calculated along the same procedure:
1,2, SHIIISHIIISPRAYSPRAYIISHIISHII
SHIIISPRAYIISHII
hmhmhm
mmm
⋅=⋅+⋅
=+
&&&
&&&
(1)
where SHIIm& is the mass flow rate of steam after second superheater stage [kg/s], SPRAYIIm& the
mass flow rate of spray water to second spray water group, SHIIIm& the mass flow rate of
superheated steam (live steam), 2,SHIIh the specific enthalpy of steam after second superheater](https://image.slidesharecdn.com/boilercalculations-170214190017/75/Boiler-calculations-9-2048.jpg)
![8
stage [kJ/kg], SPRAYh the specific enthalpy of spray water (feedwater), and 1,SHIIIh the specific
enthalpy of steam before third superheater stage. Figure 10 shows a flow chart with the symbols
visualized of the boiler arrangement used in this calculation model.
Reheat
IN
Air
IN
Coal
IN
HP Steam
OUT
Flue Gas
OUT
Ash
OUT
Feedwater
IN
HP Steam
OUT
SHIII RHSHI SHII
SPRAYII SPRAYI
EVAP
ECO
12 1212 12
1
2
APH
1
2
Figure 10: Flow chart of the PCF boiler arrangement used in this heat load calculation model.
Calculations of heat load
When the steam parameters and mass flows have been determined, the heat load of the heat
exchanger units can be calculated. The heat load is the heat transferred by a heat exchanger
(calculated in kW).
Evaporator
The heat load of the evaporator part of the boiler can be calculated as:
( ) ( )22 ECOBDECOSHEVAP hhmhhm −′+−′′= &&φ (2)
where SHm& is the mass flow of steam before superheater [kg/s], h ′′ the specific enthalpy of
saturated steam at steam drum pressure [kJ/kg], 2ECOh the specific enthalpy after economizer
BDm& the mass flow of blowdown water from steam drum, and h′ the specific enthalpy of
saturated water at steam drum pressure [kg/s].](https://image.slidesharecdn.com/boilercalculations-170214190017/75/Boiler-calculations-10-2048.jpg)
![9
Superheater
Normally superheating takes place in three or four stages in a big boiler. This calculation
example is based on three stage superheating. The heat load of the first superheater stage is
( )hhm SHISHSHI
′′−= 2,
&φ (3)
where 2,SHIh is the specific enthalpy of steam after the first superheater stage. In the second
superheater stage the heat load added can be calculated as:
( )1,2, SHIISHIISHIISHII hhm −= &φ (4)
where SHIIm& is the mass flow of steam before the second superheater [kg/s], 2,SHIIh the specific
enthalpy of steam after the second superheater stage [kJ/kg], and 1,SHIIh the specific enthalpy of
steam before the second superheater stage. Similarly, the heat load added in third superheater
stage can be calculated as:
( )1,2, SHIIISHIIISHIIISHIII hhm −= &φ (5)
wher SHIIIm& = Mass flow of steam before third superheater [kg/s], 2,SHIIIh the specific enthalpy of
steam after third superheater stage [kJ/kg], and 1,SHIIIh the specific enthalpy of steam before third
superheater stage [kJ/kg].
Reheater
The heat load of the reheater stage can be calculated as:
( )12 RHRHRHRH hhm −= &φ (6)
where RHm& is the mass flow rate of steam in the reheater [kg/s], 2RHh the specific enthalpy of
steam after the reheater [kJ/kg] , and 1RHh the specific enthalpy of steam before the reheater.
Economizer
The heat load of the economizer can be calculated as:
( )12 ECOECOECOECO hhm −= &φ (7)
where ECOm& is the mass flow rate of feedwater in the economizer [kg/s], 2ECOh the specific
enthalpy of feedwater after the economizer [kJ/kg], and 1ECOh the specific enthalpy of feedwater
before the economizer.
Air preheater
In order to calculate the heat load for the air preheater, we need to know the combustion air mass
flow, the temperature of the flue gases and the incoming air. The combustion air fed into air
preheater, is taken from upper part of the boiler room. The temperature of the combustion air
before the air preheater is therefore between 25 and 40°C (in Finnish conditions). The flue gases](https://image.slidesharecdn.com/boilercalculations-170214190017/75/Boiler-calculations-11-2048.jpg)
![10
exiting the boiler are usually kept above 130-150 °C in order to prevent corrosion. The enthalpies
can be taken from tables:
( )12 APHAPH
FUEL
AIR
FUELAPH hh
m
m
m −⋅⋅=
&
&
&φ (8)
where FUELm& is the mass flow rate of fuel fed into the boiler [kg/s],
FUEL
AIR
m
m
&
&
the mass flow rate of
combustion air divided by the mass flow rate of fuel fed into the boiler, 1APHh the specific
enthalpy of combustion air before the air preheater [kJ/kg], and 2APHh the specific enthalpy of
combustion air after the air preheater.
Determination of boiler efficiency
Standards
There are two main standards used for definition of boiler efficiency. Of those, the German DIN
1942 standard employs the lower heating value (LHV) of a fuel and is widely used in Europe.
The American ASME standard is based on higher heating value (HHV). However, this chapter
calculates the efficiency according to the DIN 1942 standard. [1]
It should be marked that with the DIN standard it is possible to reach boiler efficiencies over 100
%, if the condensation heat of the flue gases is recovered.
Major heat losses
Heat loss with unburned combustible gases
The typical unburned combustible gases are carbon monoxide (CO) and hydrogen (H2). In large
boilers usually only carbon monoxide can be found in significant amounts in flue gases.
Assuming that flue gases contain only these two gases, the losses [kW]can be calculated as:
22 ,,1 HlHCOlCOL HmHm ⋅+⋅= &&φ (9)
where COm& is the mass flow of carbon monoxide [kg/s], 2Hm& the mass flow of hydrogen,
COlH , the lower heating value (LHV) of carbon monoxide (10,12 MJ/kg), and 2,HlH the lower
heating value (LHV) of hydrogen (119,5 MJ/kg). If a relevant amount of some other flue gas
compound can be found in the flue gases, it should be added to the equation.
Heat loss due to unburned solid fuel
Unburned fuel can exit the furnace as well as bottom ash or fly ash. The heating value of ashes
can be measured in a specific laboratory test. The losses [kW] of unburned solid fuels can be
calculated as:
ubslubsL Hm ,2 ⋅= &φ (10)](https://image.slidesharecdn.com/boilercalculations-170214190017/75/Boiler-calculations-12-2048.jpg)
![11
where ubsm& is the total mass flow of unburned solid fuel (bottom ash and fly ash in total) [kg/s],
and ubslH , the lower heating value (LHV) of unburned solid fuel (fly ash and bottom ash in total)
[kJ/kg]. Some estimates of the losses with unburned solid fuels are presented in table 1:
Table 1: Estimates of losses with unburned solid fuel.
Boiler type Heat loss per heat input of fuel
Oil fired boiler 0,2 - 0,5 %
Coal fired boiler, dry ash removal 3 %
Coal fired boiler, molten ash removal about 2 %
Grate boiler 4-6 %
Heat loss due to wasted heat in flue gases
Flue gases leave the furnace in high temperature and thus they carry significant amount of
energy away from boiler process. To decrease flue gas losses, flue gas exit temperature should be
decreased. However, the acid dew point of flue gases restricts the flue gas temperature to about
130-150 °C for sulphur containing fuels. The losses caused by the sensible heat of flue gases can
be calculated as:
∑ ⋅⋅=
i
i
fuel
i
fuelL h
m
m
m
&
&
&3φ (11)
where fuelm& is the fuel mass flow [kg/s], im& the mass flow of a flue gas component, and ih the
specific enthalpy of a flue gas component (e.g. CO2) [kJ/kg].
Heat loss due to wasted heat in ashes
Ash can exit the furnace either as bottom ash from bottom of the furnace or as fly ash with flue
gases. The losses related to the sensible heat of ash can be calculated as:
fafapfababapbaL TcmTcm ∆⋅⋅+∆⋅⋅= ,,4
&&φ (12)
where bam& is the mass flow of the bottom ash [kg/s], bapc , the specific heat of the bottom ash
[kJ/(kgK)], baT∆ the temperature difference between the bottom ash temperature and the
reference temperature [°C], fam& the mass flow of fly ash, fapc , the specific heat of fly ash, faT∆
the temperature difference between the fly ash temperature and the reference temperature [°C].
Usually the reference temperature is 25 °C.
In recovery boilers the bottom ash is removed as molten ash in temperature of about 700-800 °C.
In addition, the amount of bottom ash divided by the amount of fuel is about 40 %. The loss of
sensible heat of ash is therefore of great importance in recovery boilers.](https://image.slidesharecdn.com/boilercalculations-170214190017/75/Boiler-calculations-13-2048.jpg)
![12
Losses due to heat transfer (radiation) to the environment
The main form of heat transfer from boiler to boiler room is radiation. It is proportional to the
outer surface area of the boiler and is usually 200-300 W/(m2K) for a well-insulated boiler
having its outer surface temperature below 55 °C. Another possibility to determine the heat
transfer losses to the environment is to use a table from the DIN 1942 standard, presented in
table 2.
Table 2: Estimations of heat transfer losses by radiation. [1]
Mass flow rate of steam [t/h]
Combustion method
10 20 40 60 80 100 200 400 600 800
Pulverized firing - 1,3 1,0 0,9 0,75 0,7 0,55 0,4 0,35 0,3
Grate 1,5 1,1 0,9 0,7 - - - - - -Loss [%]
Oil/gas fired boiler 1,3 0,9 0,7 0,6 0,55 0,4 0,3 0,25 0,2 0,2
Losses of blowdown, sootblowing and atomizing steam
Blowdown water from the steam drum and sootblowing steam (used to remove soot from heat
exchanger surfaces within the boiler) use a part of the steam produced by the boiler. This lowers
the boiler efficiency. In addition, steam is sometimes also used to atomize fuel in the burners.
The losses can be calculated as:
atomizingatomizingsbsbbdL hmhmhm ⋅+⋅+′⋅= &&&6φ (13)
bdm& is the mass flow of blowdown water [kg/s], h′ is the specific enthalpy of saturated water
(blowdown water from steam drum) [kJ/kg], sbm& is the mass flow of sootblowing steam, sbh is
the specific enthalpy of steam used for sootblowing (when leaving the boiler), atomizingm& is the
mass flow of atomizing steam, and atomizingh the specific enthalpy of steam used for atomizing the
fuel (when leaving the boiler) [kJ/kg].
Internal power consumption
The power plant itself consumes a part of the electricity produced. This is due to the various
auxilary equipments required, like feedwater pumps, circulation pumps and air/flue gas blowers.
In forced circulation boilers the share of electricity consumed by the circulation pump is about
0,5 % of the electricity produced by the plant.
Normally the internal power consumption is about 5 % of the electricity produced by the power
plant. Since the power used is electrical (and taken from the grid), the internal power
consumption share is reduced from the final boiler efficiency in boiler calculations.
Calculating boiler efficiency
There are two different means of calculating the boiler efficiency: The direct method and the
indirect method.](https://image.slidesharecdn.com/boilercalculations-170214190017/75/Boiler-calculations-14-2048.jpg)


