The document discusses isoquant curves and isocost curves.
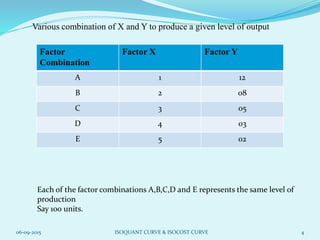
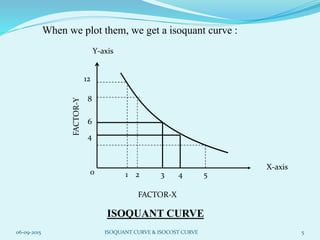
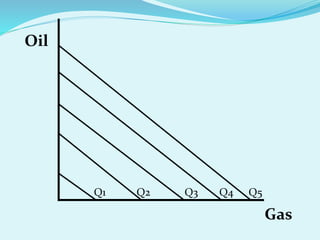
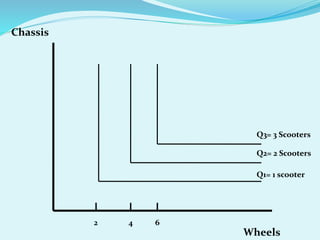
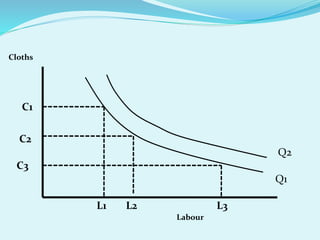
1. An isoquant curve shows all the combinations of two inputs that can produce the same level of output. It assumes inputs are substitutable to some degree in production.
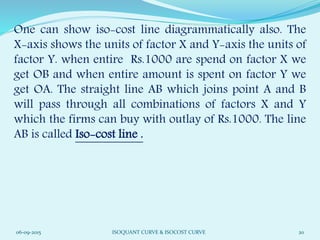
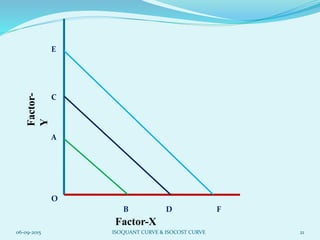
2. An isocost curve connects all combinations of two inputs that can be purchased with a given budget or expenditure level, based on the prices of the inputs.
3. Firms use isoquant and isocost curves to determine the most cost-effective combination of inputs to achieve a given output level.