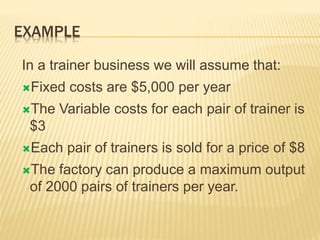
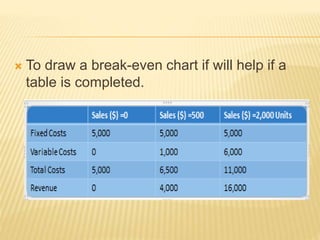
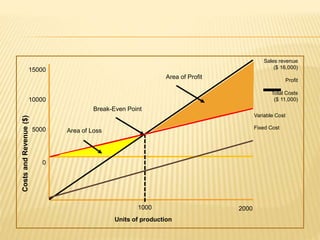
BREAK- EVEN ANALYSIS
 The break-even level of output or sales
indicated to the owner or manager of a
business the minimum level of output that
must be sold so that total costs are covered.
At the break-even level of output a profit is
not being made but neither is a loss.
 The ‘quicker’ a start-up business can reach
the break-even point the more likely it is to
survive – and then make a profit.
DRAWING A BREAK-EVEN ANALYSIS
 In order to draw a break-even chart we
need the information about:
 the fixed costs,
 variable costs and
 revenue of a business.
EXAMPLE
In a trainer business we will assume that:
Fixed costs are $5,000 per year
The Variable costs for each pair of trainer is
$3
Each pair of trainers is sold for a price of $8
The factory can produce a maximum output
of 2000 pairs of trainers per year.
 To draw a break-even chart if will help if a
table is completed.
 When output is 2000 units, variable costs will
be: 2000 x $3 = $6000
 Assuming all output is sold, total revenue will
be 2000 x $8 = $16,000
 Make sure you understand how the other
figures were arrived at before looking at how
the data is used to construct a break-even
chart.
15000
10000
5000
0
CostsandRevenue($)
1000 2000
Sales revenue
($ 16,000)
Profit
Total Costs
($ 11,000)
Variable Cost
Fixed Cost
Area of Loss
Break-Even Point
Area of Profit
Units of production
 What does the Graph Show?
 The break-even point of production is where
total costs and total revenue cross. The
business must therefor sell 100 pairs of trainers
in order to avoid making a loss.
 At production below the break-even point, the
business is making a loss, above this point it’s
making a profit. Maximum profit is made when
maximum output is reached and this is a point
level of $5000.
ADVANTAGES
Managers are able to read off the graph the
expected profit or loss to be made at any
level of output.
The impact on profit and loss on certain
business decisions can also be shown by
redrawing the graph.
The break-even chart can also be used to
show the safety margin - the amount by
which the sales exceed the break-even point
DISADVANTAGES
 Break-even charts are made assuming all goods produced by the
company are actually sold – the graph does not show the possibility
that inventories may build up if not sold.
 Fixed costs only stay constant if the scale of production does not
change
 Break-even charts concentrate on the Break-even point of production,
but there many other aspects of the operation of the business which
need to be analysed by managers like how to reduce wastage or
increase sales.
 The charts here used have assumed that costs and revenues can be
drawn on straight lines. This is not always the case, increasing output
to the capacity of a factory may involve paying overtime to workers. This
will make the variable cost line slope upwards as output expands. The
company may have to offer discounts to increase sales for large orders
which will cause the revenue line to slope less.
CALCULATION METHOD
 We can use the formula:
EXAMPLE
 Haifa Supplies Ltd make wooden desks. The selling price for
each desk is $50. the variable costs of materials and production
labour are $20. The weekly fixed costs are $6000.
 What is the break-even level of production? It is necessary to
calculate the Contribution (selling price minus the variable cost)
of each desk.
 The calculation for the contribution is:
 Selling Price – Variable Cost = Contribution
 $50 - $20 = $30
 Each desk gives a Contribution to fixed costs and profit of $30. In
order to break-even each week, the business must make sufficient
desks, contributing $30 each, to cover the fixed costs of $6000.
Break  even analysis

Break even analysis

  • 1.
  • 2.
     The break-evenlevel of output or sales indicated to the owner or manager of a business the minimum level of output that must be sold so that total costs are covered. At the break-even level of output a profit is not being made but neither is a loss.  The ‘quicker’ a start-up business can reach the break-even point the more likely it is to survive – and then make a profit.
  • 3.
    DRAWING A BREAK-EVENANALYSIS  In order to draw a break-even chart we need the information about:  the fixed costs,  variable costs and  revenue of a business.
  • 4.
    EXAMPLE In a trainerbusiness we will assume that: Fixed costs are $5,000 per year The Variable costs for each pair of trainer is $3 Each pair of trainers is sold for a price of $8 The factory can produce a maximum output of 2000 pairs of trainers per year.
  • 5.
     To drawa break-even chart if will help if a table is completed.
  • 6.
     When outputis 2000 units, variable costs will be: 2000 x $3 = $6000  Assuming all output is sold, total revenue will be 2000 x $8 = $16,000  Make sure you understand how the other figures were arrived at before looking at how the data is used to construct a break-even chart.
  • 7.
    15000 10000 5000 0 CostsandRevenue($) 1000 2000 Sales revenue ($16,000) Profit Total Costs ($ 11,000) Variable Cost Fixed Cost Area of Loss Break-Even Point Area of Profit Units of production
  • 8.
     What doesthe Graph Show?  The break-even point of production is where total costs and total revenue cross. The business must therefor sell 100 pairs of trainers in order to avoid making a loss.  At production below the break-even point, the business is making a loss, above this point it’s making a profit. Maximum profit is made when maximum output is reached and this is a point level of $5000.
  • 9.
    ADVANTAGES Managers are ableto read off the graph the expected profit or loss to be made at any level of output. The impact on profit and loss on certain business decisions can also be shown by redrawing the graph. The break-even chart can also be used to show the safety margin - the amount by which the sales exceed the break-even point
  • 10.
    DISADVANTAGES  Break-even chartsare made assuming all goods produced by the company are actually sold – the graph does not show the possibility that inventories may build up if not sold.  Fixed costs only stay constant if the scale of production does not change  Break-even charts concentrate on the Break-even point of production, but there many other aspects of the operation of the business which need to be analysed by managers like how to reduce wastage or increase sales.  The charts here used have assumed that costs and revenues can be drawn on straight lines. This is not always the case, increasing output to the capacity of a factory may involve paying overtime to workers. This will make the variable cost line slope upwards as output expands. The company may have to offer discounts to increase sales for large orders which will cause the revenue line to slope less.
  • 11.
    CALCULATION METHOD  Wecan use the formula:
  • 12.
    EXAMPLE  Haifa SuppliesLtd make wooden desks. The selling price for each desk is $50. the variable costs of materials and production labour are $20. The weekly fixed costs are $6000.  What is the break-even level of production? It is necessary to calculate the Contribution (selling price minus the variable cost) of each desk.  The calculation for the contribution is:  Selling Price – Variable Cost = Contribution  $50 - $20 = $30  Each desk gives a Contribution to fixed costs and profit of $30. In order to break-even each week, the business must make sufficient desks, contributing $30 each, to cover the fixed costs of $6000.