Downloaded 495 times


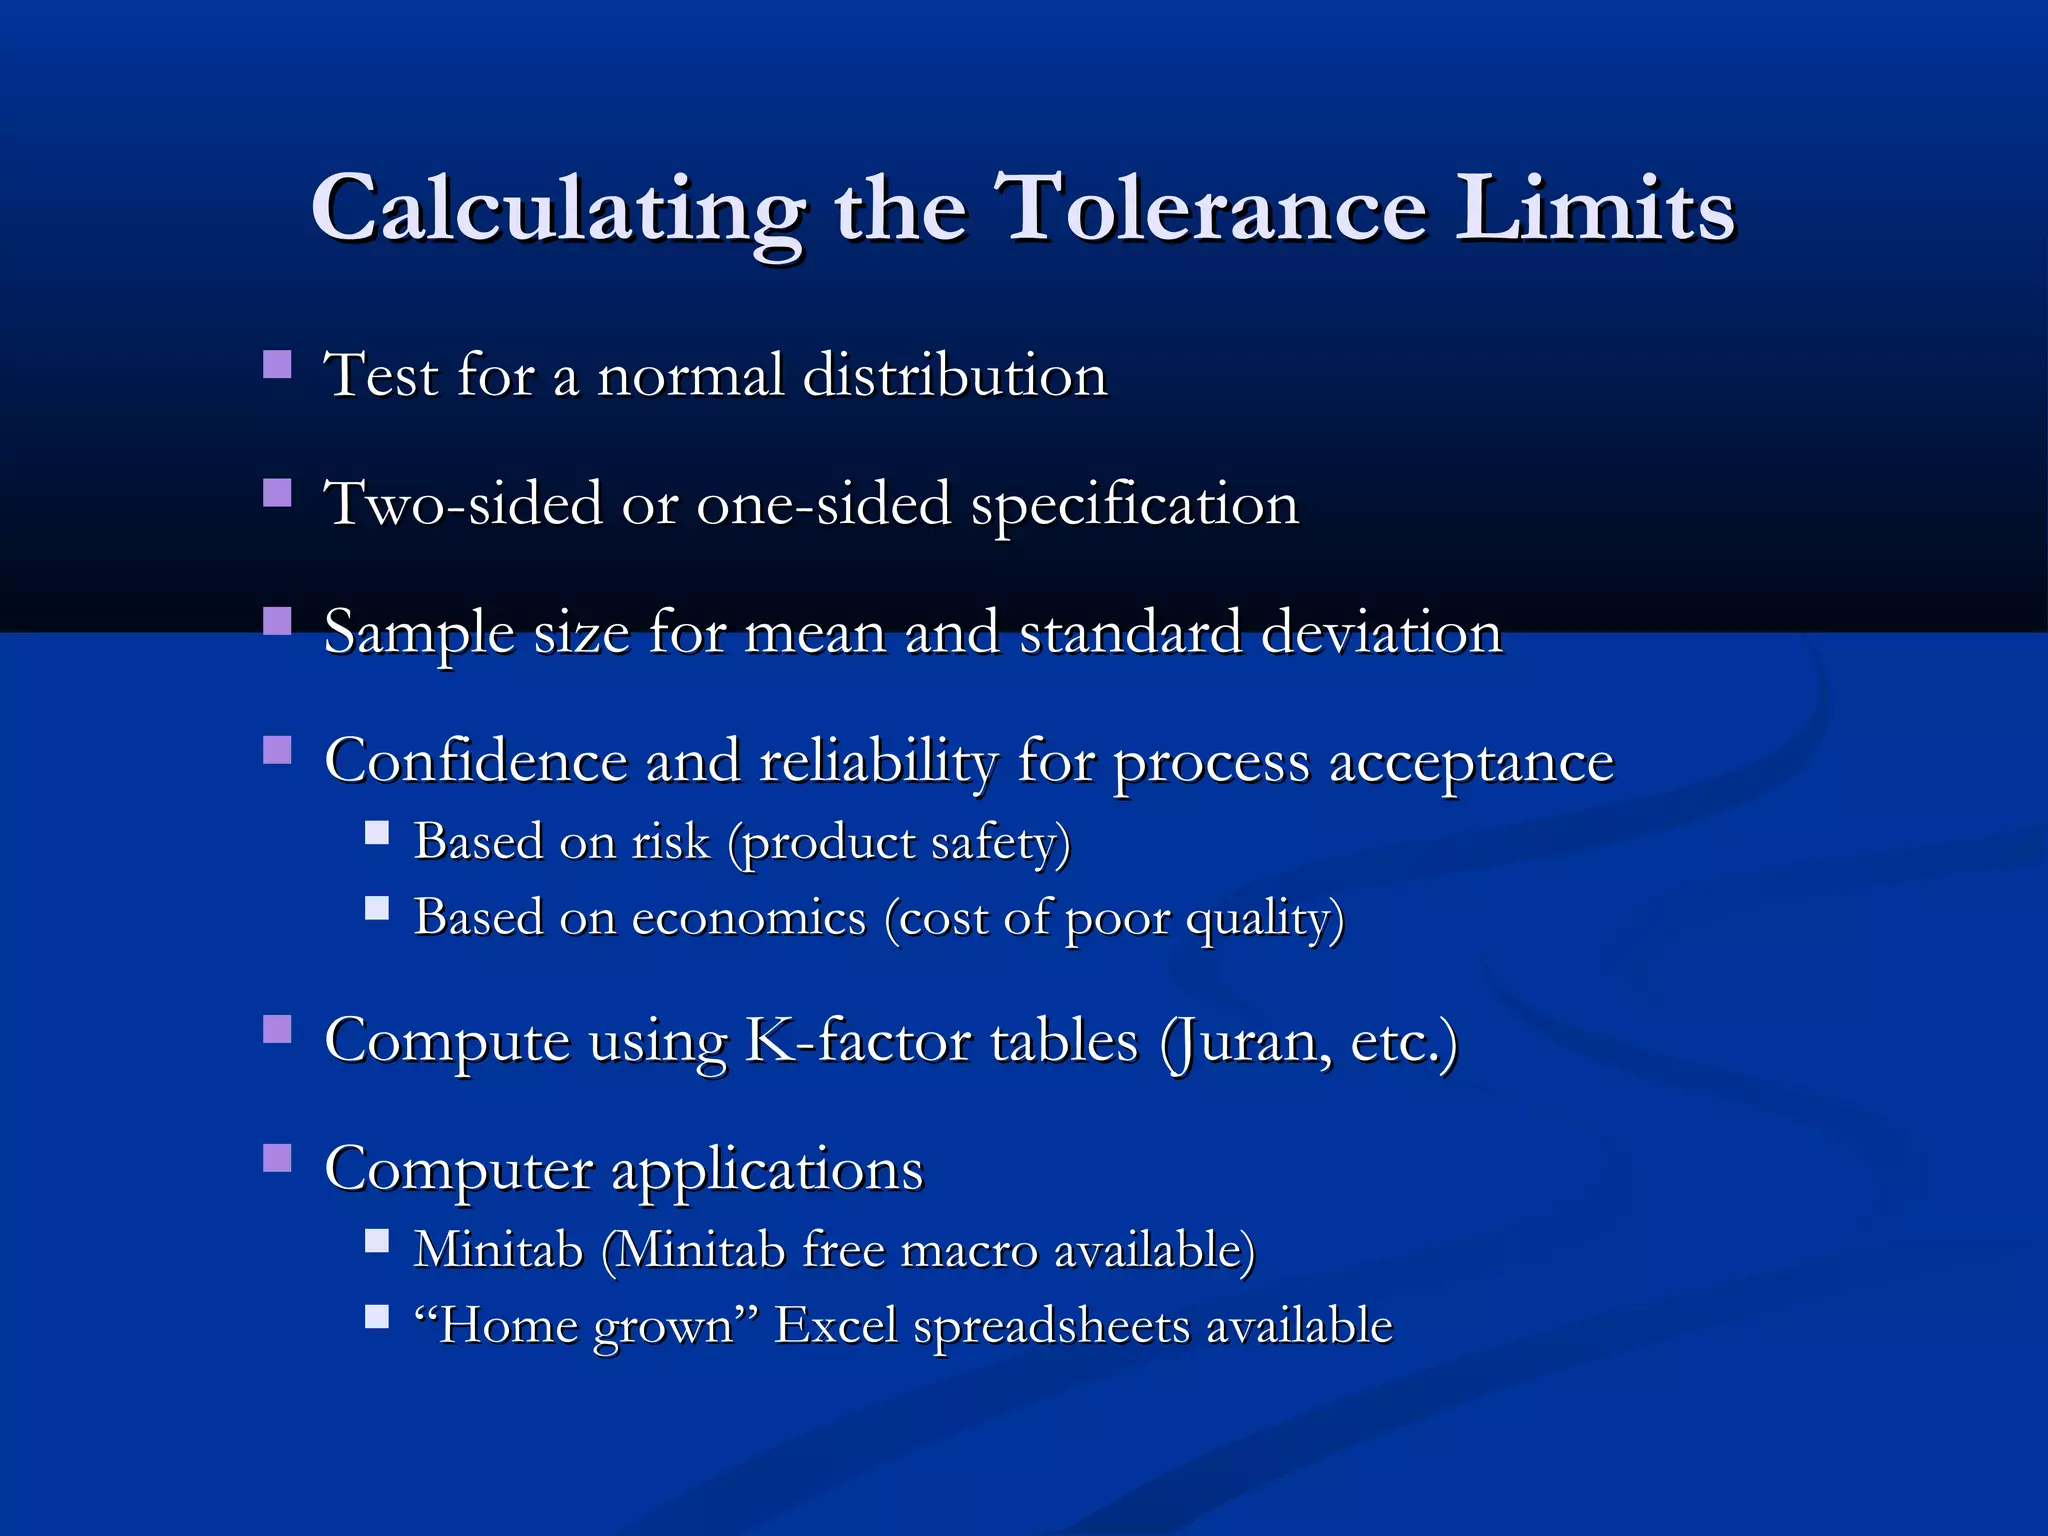


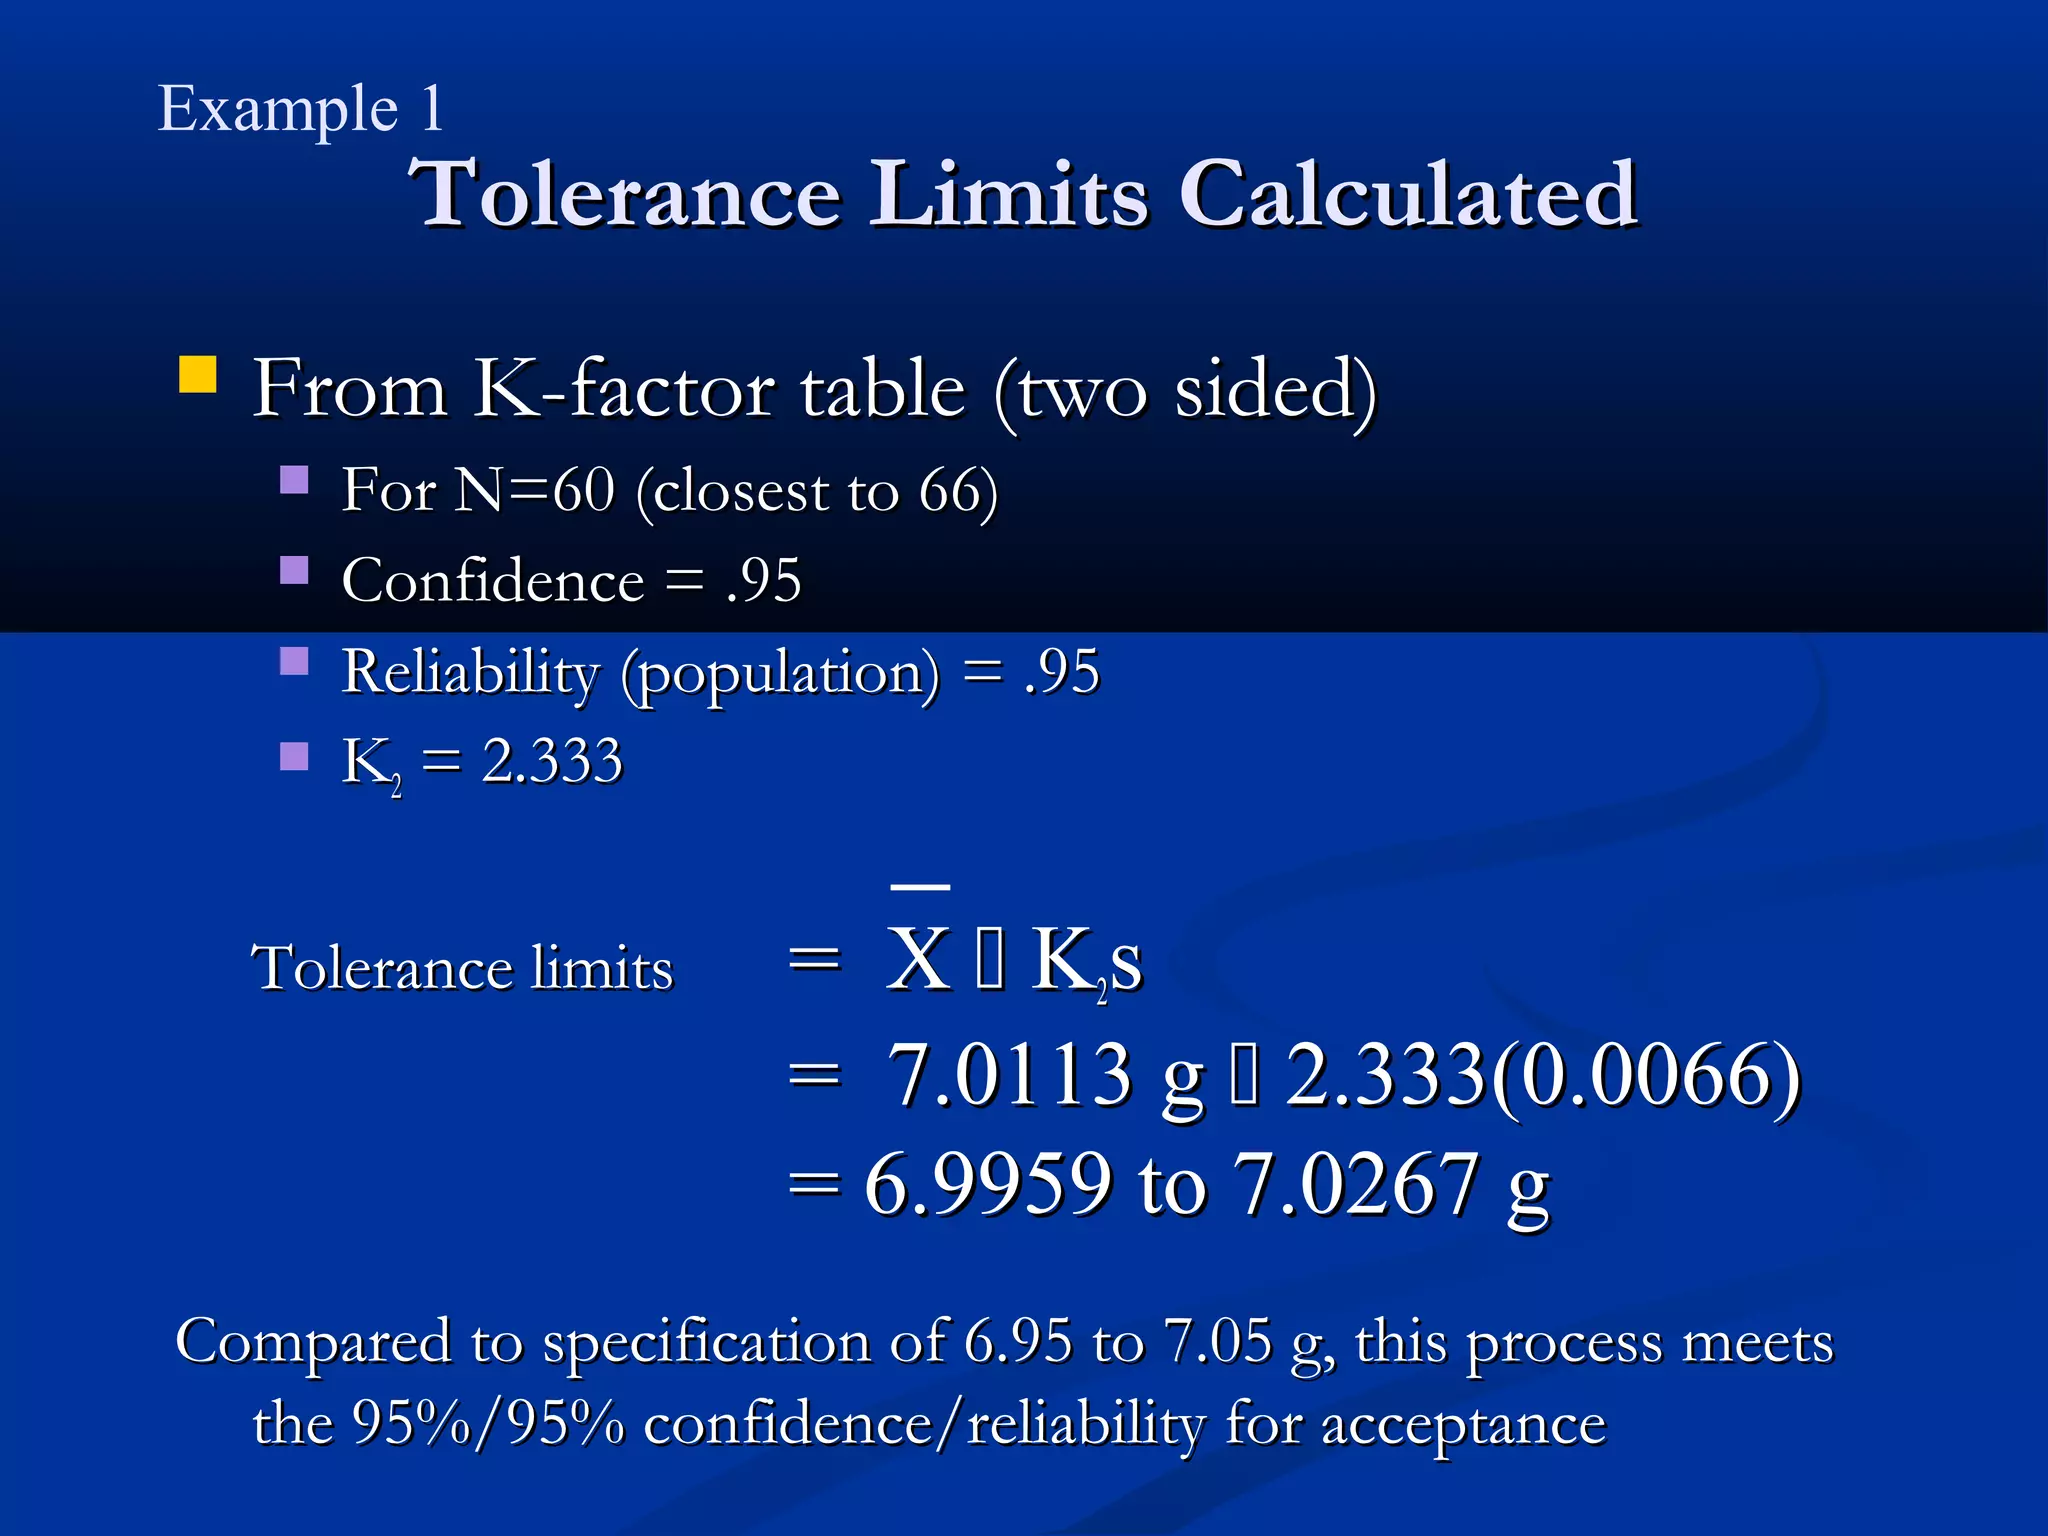


The document discusses the application of statistical tolerance limits in process qualification. Tolerance limits define an interval that covers a proportion of a population with a given confidence level. Using tolerance limits provides a statement of confidence and reliability about a process while accounting for uncertainty due to sample size. Three examples are provided to demonstrate calculating tolerance limits and determining minimum sample sizes needed to validate processes.