Downloaded 939 times
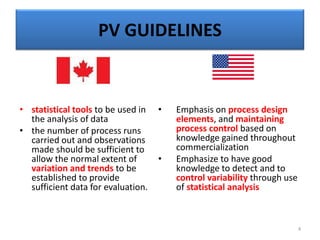
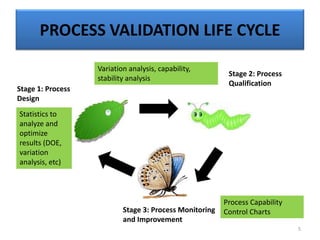


The document provides a comprehensive overview of statistical applications in process validation, outlining regulatory expectations, statistical tools, and common mistakes to avoid. It emphasizes the importance of understanding process variation, the role of statistical analysis in process capability, and the necessity of suitable sampling methods. Additionally, it covers control charts, process capability indices, and acceptance sampling to ensure quality and consistency in manufacturing.