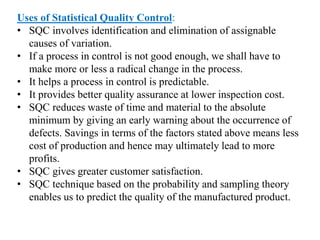
Course outline:-
1. Introduction to Statistical Quality Control
1.1. Introduction
1.2. Definition of Statistical Quality Control (SQC).
1.3. History of Statistical Quality Control
1.4. Uses of Statistical Quality Control
1.5. Quality Improvement in Modern Business Environment
1.6. Modelling Process Quality
2. Methods of Statistical Process Control and Capability Analysis
2.1. Introduction
2.2. History of Statistical Process Control
2.3. Definitions of Statistical Process Control
2.4. Control Charts
2.5. Process and Measurement System Capability Analysis.
3. Other Statistical Process-monitoring and Control Techniques
3.1. Cumulative Sum and Exponentially Weighted Moving Average Control Charts.
3.2. Exponentially Weighted Moving Average Control Charts (EWMA)
3.3. Other Univar ate Statistical Process Monitoring and Control Techniques.
3.4. Multivariate Process Monitoring and Control.
4. Acceptance Sampling
4.1. Concepts of acceptance sampling
4.2. Lot-by-lot acceptance sampling for attributes
4.3. Other acceptance sampling techniques
5. Reliability and Life Testing
5.1. Introduction
5.2. Types of reliability tests
5.3. Reliability Estimation
Chapter 1
Introduction to Statistical Quality Control
History of Statistical Quality Control:
 “Statistical quality control techniques were first developed by
Walter A. shewart, who was working for the bell telephone
Co. in the USA at the time. Since World War II, these
techniques have been increasingly and advantageously used
by a large number of manufacturing concerns.”
Uses of Statistical Quality Control:
• SQC involves identification and elimination of assignable
causes of variation.
• If a process in control is not good enough, we shall have to
make more or less a radical change in the process.
• It helps a process in control is predictable.
• It provides better quality assurance at lower inspection cost.
• SQC reduces waste of time and material to the absolute
minimum by giving an early warning about the occurrence of
defects. Savings in terms of the factors stated above means less
cost of production and hence may ultimately lead to more
profits.
• SQC gives greater customer satisfaction.
• SQC technique based on the probability and sampling theory
enables us to predict the quality of the manufactured product.
Quality Improvement in Modern Business Environment
The major characteristics, ignored during the search to improve manufacture and
overall business performance were:
• Reliability
• Maintainability
• Safety
• Strength.
as the most important factor had been ignored, a few refinements had to be introduced:
1. Marketing had to carry out their work properly and define the customer's
specifications.
2. Specifications had to be defined to conform to these requirements.
3. Conformance to specifications i.e. drawings, standards and other relevant
documents, were introduced during manufacturing, planning and control.
4. Management had to confirm all operators are equal to the work imposed on
them and holidays, celebrations and disputes did not affect any of the quality
levels.
5. Inspections and tests were carried out, all components and materials, bought in or
otherwise, conformed to the specifications, the measuring equipment was accurate,
this is the responsibility of the QC department.
6. Any complaints received from the customers were satisfactorily dealt with in a
timely manner and feedback from the customer is used to review designs.
7. Consistent data recording, assessment and documentation integrity. Also product
and/or process change management and notification.
The company-wide quality approach places an emphasis on four aspects:-
1. Elements such as controls, job management, adequate processes, performance
and integrity criteria and identification of records
2. Competence such as knowledge, skills, experience, qualifications
3. Soft elements, such as personnel integrity, confidence, organizational
culture, motivation, team spirit and quality relationships.
4. Infrastructure (as it enhances or limits functionality)
the quality of the outputs is at risk if any of these aspects is deficient in any way.
Quality Management
With increased demands on manufacturing operations quality managers are finding
themselves subject to stricter guidelines from both their customers and regulatory
bodies. Quality managers are now required to take proactive approaches to ensure they
are meeting the variety of requirements that are imposed on them.
International Quality Standard provides the following capabilities to quality managers:
o Document operating procedures, policies, and work instructions
o Manage non-conformance's and corrective actions
o Manage and investigate customer complaints
o Manage supplier related issues including supplier performance
o Implement closed-loop processes that support continuous improvement
efforts.
Modelling Process Quality :-
• A process is a unique combination of tools, materials, methods,
and people engaged in producing a measurable output; for
example a manufacturing line for machine parts. All processes
have inherent statistical variability which can be evaluated by
statistical methods.
• The Process Capability is a measurable property of a process to
the specification, expressed as a process capability index or as a
process performance index.
“The output of this measurement is usually illustrated by a histogram
and calculations that predict how many parts will be produced out of
specification. “
Two parts of process capability :
1) Measure the variability of the output of a process, and
2) Compare that variability with a proposed specification or product
tolerance.
Measure the process: The input of a process usually having one or
more measurable characteristics that are used to specify outputs. These
can be analyzed statically. For example the process shows a normal
distribution, it can be described by mean and standard deviation. Based
on control charts we are going to decide whether the process is in
statistical control or not.
Capability study: The input of a process is expected to meet customer
requirements, specification, or product tolerances. The ability of a
process to meet specifications can be expressed as a single number
using a process capability index or it can be assessed using control
charts.
Chapter 2
Methods of Statistical Process Control and Capability
Analysis
Control chart
- Attributes
As already pointed out the control of quality in manufactured product
can be broadly in to two heads;
1. Control charts for variable
2. Control chats for attributes
Control charts for variable
 Control charts for variables are designed to achieved and maintain
a satisfactory quality level for a process whose product is amenable
to quantitative measurements like the thickness, length or diameter
of screw or nut, weight of the bolts, tensile strength of yarn or steel
pipes, etc.
 The observation on such units can be expressed in specific unit of
measurements. In such cases the quality control involves the
control of variation both in
 measures of central tendency and
 depression of the characteristics.
• The main purpose of the variable control charts is to monitor the
process mean and the standard deviation. The variables under
consideration are of continuous character and are assumed to be
distributed normally.
• Control charts for variables are:
1. Control charts for range(R)
2. Control chart for mean(𝑋)
3. Control charts for standard deviation(S)
Process capability Indices
 Process capability indices provide a measure of
whether an ‘’in control’’ process is meeting its product
specifications.
 Suppose that a quality variable 𝑥 must have a volume
between an upper specification limit (USL)and a lower
specification limit (LSL), in order for product to
satisfy customer requirements.
 The 𝐶𝑝 capability index is defined as,
𝐶𝑝 =
𝑈𝑆𝐿 − 𝐿𝑆𝐿
6𝜎
Where 𝜎 is the standard deviation of 𝑥.
• suppose that 𝐶𝑝 = 1 and 𝑥 is normally distributed.
• Based on above Eq, we would expect that 99.73% of the
measurements satisfy the specification limits.
• If 𝐶𝑝 > 1, the product specification are satisfied; for 𝐶𝑝 < 1 ,
they are not.
• A second capability index 𝐶𝑝𝑘 is based on average process
performance 𝑥 , as well as process variability 𝜎 . It is defined
as ;
𝐶𝑝𝑘 = 𝑚𝑖𝑛
𝑈𝑆𝐿−𝑥
3𝜎
.
𝑥−𝐿𝑆𝐿
3𝜎
• Although both 𝐶𝑝 and 𝐶𝑝𝑘 are used, we consider 𝐶𝑝𝑘 to be
superior to 𝐶𝑝 for the following reason,
o If 𝑥= T , the process is said to be “centered” and Cpk = 𝐶𝑝.
o But for 𝑥 ≠ 𝑇, 𝐶𝑝 does not change , even though the process
performance is worse, while 𝐶𝑝𝑘 decreases. For this reason ,
𝐶𝑝𝑘 is preferred.
Chapter 3
Other Statistical Process-Monitoring and Control Techniques

Statistical quality control 1,2

  • 2.
    Course outline:- 1. Introductionto Statistical Quality Control 1.1. Introduction 1.2. Definition of Statistical Quality Control (SQC). 1.3. History of Statistical Quality Control 1.4. Uses of Statistical Quality Control 1.5. Quality Improvement in Modern Business Environment 1.6. Modelling Process Quality 2. Methods of Statistical Process Control and Capability Analysis 2.1. Introduction 2.2. History of Statistical Process Control 2.3. Definitions of Statistical Process Control 2.4. Control Charts 2.5. Process and Measurement System Capability Analysis. 3. Other Statistical Process-monitoring and Control Techniques 3.1. Cumulative Sum and Exponentially Weighted Moving Average Control Charts. 3.2. Exponentially Weighted Moving Average Control Charts (EWMA) 3.3. Other Univar ate Statistical Process Monitoring and Control Techniques. 3.4. Multivariate Process Monitoring and Control. 4. Acceptance Sampling 4.1. Concepts of acceptance sampling 4.2. Lot-by-lot acceptance sampling for attributes 4.3. Other acceptance sampling techniques 5. Reliability and Life Testing 5.1. Introduction 5.2. Types of reliability tests 5.3. Reliability Estimation
  • 3.
    Chapter 1 Introduction toStatistical Quality Control
  • 7.
    History of StatisticalQuality Control:  “Statistical quality control techniques were first developed by Walter A. shewart, who was working for the bell telephone Co. in the USA at the time. Since World War II, these techniques have been increasingly and advantageously used by a large number of manufacturing concerns.”
  • 8.
    Uses of StatisticalQuality Control: • SQC involves identification and elimination of assignable causes of variation. • If a process in control is not good enough, we shall have to make more or less a radical change in the process. • It helps a process in control is predictable. • It provides better quality assurance at lower inspection cost. • SQC reduces waste of time and material to the absolute minimum by giving an early warning about the occurrence of defects. Savings in terms of the factors stated above means less cost of production and hence may ultimately lead to more profits. • SQC gives greater customer satisfaction. • SQC technique based on the probability and sampling theory enables us to predict the quality of the manufactured product.
  • 9.
    Quality Improvement inModern Business Environment The major characteristics, ignored during the search to improve manufacture and overall business performance were: • Reliability • Maintainability • Safety • Strength. as the most important factor had been ignored, a few refinements had to be introduced: 1. Marketing had to carry out their work properly and define the customer's specifications. 2. Specifications had to be defined to conform to these requirements. 3. Conformance to specifications i.e. drawings, standards and other relevant documents, were introduced during manufacturing, planning and control. 4. Management had to confirm all operators are equal to the work imposed on them and holidays, celebrations and disputes did not affect any of the quality levels.
  • 10.
    5. Inspections andtests were carried out, all components and materials, bought in or otherwise, conformed to the specifications, the measuring equipment was accurate, this is the responsibility of the QC department. 6. Any complaints received from the customers were satisfactorily dealt with in a timely manner and feedback from the customer is used to review designs. 7. Consistent data recording, assessment and documentation integrity. Also product and/or process change management and notification. The company-wide quality approach places an emphasis on four aspects:- 1. Elements such as controls, job management, adequate processes, performance and integrity criteria and identification of records 2. Competence such as knowledge, skills, experience, qualifications 3. Soft elements, such as personnel integrity, confidence, organizational culture, motivation, team spirit and quality relationships. 4. Infrastructure (as it enhances or limits functionality) the quality of the outputs is at risk if any of these aspects is deficient in any way.
  • 11.
    Quality Management With increaseddemands on manufacturing operations quality managers are finding themselves subject to stricter guidelines from both their customers and regulatory bodies. Quality managers are now required to take proactive approaches to ensure they are meeting the variety of requirements that are imposed on them. International Quality Standard provides the following capabilities to quality managers: o Document operating procedures, policies, and work instructions o Manage non-conformance's and corrective actions o Manage and investigate customer complaints o Manage supplier related issues including supplier performance o Implement closed-loop processes that support continuous improvement efforts.
  • 12.
    Modelling Process Quality:- • A process is a unique combination of tools, materials, methods, and people engaged in producing a measurable output; for example a manufacturing line for machine parts. All processes have inherent statistical variability which can be evaluated by statistical methods. • The Process Capability is a measurable property of a process to the specification, expressed as a process capability index or as a process performance index. “The output of this measurement is usually illustrated by a histogram and calculations that predict how many parts will be produced out of specification. “
  • 13.
    Two parts ofprocess capability : 1) Measure the variability of the output of a process, and 2) Compare that variability with a proposed specification or product tolerance. Measure the process: The input of a process usually having one or more measurable characteristics that are used to specify outputs. These can be analyzed statically. For example the process shows a normal distribution, it can be described by mean and standard deviation. Based on control charts we are going to decide whether the process is in statistical control or not. Capability study: The input of a process is expected to meet customer requirements, specification, or product tolerances. The ability of a process to meet specifications can be expressed as a single number using a process capability index or it can be assessed using control charts.
  • 14.
    Chapter 2 Methods ofStatistical Process Control and Capability Analysis
  • 17.
  • 18.
    - Attributes As alreadypointed out the control of quality in manufactured product can be broadly in to two heads; 1. Control charts for variable 2. Control chats for attributes
  • 19.
    Control charts forvariable  Control charts for variables are designed to achieved and maintain a satisfactory quality level for a process whose product is amenable to quantitative measurements like the thickness, length or diameter of screw or nut, weight of the bolts, tensile strength of yarn or steel pipes, etc.  The observation on such units can be expressed in specific unit of measurements. In such cases the quality control involves the control of variation both in  measures of central tendency and  depression of the characteristics.
  • 20.
    • The mainpurpose of the variable control charts is to monitor the process mean and the standard deviation. The variables under consideration are of continuous character and are assumed to be distributed normally. • Control charts for variables are: 1. Control charts for range(R) 2. Control chart for mean(𝑋) 3. Control charts for standard deviation(S)
  • 38.
    Process capability Indices Process capability indices provide a measure of whether an ‘’in control’’ process is meeting its product specifications.  Suppose that a quality variable 𝑥 must have a volume between an upper specification limit (USL)and a lower specification limit (LSL), in order for product to satisfy customer requirements.  The 𝐶𝑝 capability index is defined as, 𝐶𝑝 = 𝑈𝑆𝐿 − 𝐿𝑆𝐿 6𝜎 Where 𝜎 is the standard deviation of 𝑥.
  • 39.
    • suppose that𝐶𝑝 = 1 and 𝑥 is normally distributed. • Based on above Eq, we would expect that 99.73% of the measurements satisfy the specification limits. • If 𝐶𝑝 > 1, the product specification are satisfied; for 𝐶𝑝 < 1 , they are not. • A second capability index 𝐶𝑝𝑘 is based on average process performance 𝑥 , as well as process variability 𝜎 . It is defined as ; 𝐶𝑝𝑘 = 𝑚𝑖𝑛 𝑈𝑆𝐿−𝑥 3𝜎 . 𝑥−𝐿𝑆𝐿 3𝜎 • Although both 𝐶𝑝 and 𝐶𝑝𝑘 are used, we consider 𝐶𝑝𝑘 to be superior to 𝐶𝑝 for the following reason, o If 𝑥= T , the process is said to be “centered” and Cpk = 𝐶𝑝. o But for 𝑥 ≠ 𝑇, 𝐶𝑝 does not change , even though the process performance is worse, while 𝐶𝑝𝑘 decreases. For this reason , 𝐶𝑝𝑘 is preferred.
  • 42.
    Chapter 3 Other StatisticalProcess-Monitoring and Control Techniques