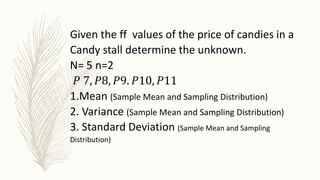
SAMPLING
and
SAMPLING
BATTERY TEST
DIRECTIONS:
Using the different description in each
group, once the given formula is
posted, one member of the group will
raise the answer, and be counted
score in their group if correct
𝑥 =
𝑥
𝑁
Answer: MEAN
(SAMPLE MEAN)
𝜎2 =
𝑋2
𝑁
−
𝑋
𝑁
2
ANSWER: VARIANCE
(SAMPLE MEAN)
𝜇 𝑥 = 𝑥2
• 𝑃 𝑥
ANSWER: Mean
(SAMPLING DISTRIBUTION FROM THE SAMPLE
MEAN)
𝜎 =
𝑋2
𝑁
−
𝑋
𝑁
2
ANSWER: STANDARD DEVIATION
(SAMPLE MEAN)
𝜎𝑥 = 𝑥2 • 𝑃 𝑥 − 𝜇2
ANSWER: STANDARD DEVIATION
(SAMPLING DISTRIBUTION from the SAMPLE MEAN)
𝜎2
𝑥 = 𝑥2
• 𝑃 𝑥 − 𝜇2
ANSWER: VARIANCE
(SAMPLING DISTRIBUTION)
GROUP
ACTIVITY
GIVEN the set of values determine the ff.
Group 1- MEAN of the SAMPLE MEAN and the sampling
distribution.
Group 2- Variance of the population and sampling
distribution
Group 3- STANDARD DEVIATION of the population and
sampling distribution
GROUP 4- Graph of the sampling distribution.
(HISTOGRAM)
RUBRICS:
DESCRIPTION 5 3 1
CLEANLINE
SS
NO Erasures 2-3
mistakes/erasur
es
4 or more
mistakes
CONTENT Excellent
answer
(Complete)
Missing 2-3
answer/procedur
es
4 or more
missing in
the content
answer
OUPUT Followed the
steps
completely
Missing 2-3
steps
4 or more
Incomplete
data
VARIANCE OF SAMPLING
DISTRIBUTION FROM THE
SAMPLE MEAN
STANDARD
DEVIATION OF
SAMPLING
DISTRIBUTION FROM
THE SAMPLE MEAN
Properties of the mean, variance and
standard deviation.
1. The mean of the sample is equal to
its sample distribution.
2. The variance and its standard
Deviation of the sample distribution
can be determined from the sample
means
Form a group of five members, (in each
group) Get the height in meter of each
member of the group. Draw random samples
of size n=2 from these heights.
1.How many samples can be drawn from it?
2.Determine the mean, variance, standard
deviation of the sample mean .
3.Draw a histogram of your group.
*** RUBRICS IS GIVEN.
Given the ff values of the price of candies in a
Candy stall determine the unknown.
N= 5 n=2
𝑃 7, 𝑃8, 𝑃9. 𝑃10, 𝑃11
1.Mean (Sample Mean and Sampling Distribution)
2. Variance (Sample Mean and Sampling Distribution)
3. Standard Deviation (Sample Mean and Sampling
Distribution)
SOLUTION:
SAMPLE MEAN SAMPLING
DISTRIBUTION
MEAN 9 9
VARIANCE 2 0.75
STANDARD
DEVIATION
1.41 0.87

SAMPLING and SAMPLING DISTRIBUTION

  • 1.
  • 2.
  • 3.
    DIRECTIONS: Using the differentdescription in each group, once the given formula is posted, one member of the group will raise the answer, and be counted score in their group if correct
  • 4.
  • 5.
  • 6.
    𝜇 𝑥 =𝑥2 • 𝑃 𝑥 ANSWER: Mean (SAMPLING DISTRIBUTION FROM THE SAMPLE MEAN)
  • 7.
  • 8.
    𝜎𝑥 = 𝑥2• 𝑃 𝑥 − 𝜇2 ANSWER: STANDARD DEVIATION (SAMPLING DISTRIBUTION from the SAMPLE MEAN)
  • 9.
    𝜎2 𝑥 = 𝑥2 •𝑃 𝑥 − 𝜇2 ANSWER: VARIANCE (SAMPLING DISTRIBUTION)
  • 10.
  • 11.
    GIVEN the setof values determine the ff. Group 1- MEAN of the SAMPLE MEAN and the sampling distribution. Group 2- Variance of the population and sampling distribution Group 3- STANDARD DEVIATION of the population and sampling distribution GROUP 4- Graph of the sampling distribution. (HISTOGRAM)
  • 12.
    RUBRICS: DESCRIPTION 5 31 CLEANLINE SS NO Erasures 2-3 mistakes/erasur es 4 or more mistakes CONTENT Excellent answer (Complete) Missing 2-3 answer/procedur es 4 or more missing in the content answer OUPUT Followed the steps completely Missing 2-3 steps 4 or more Incomplete data
  • 13.
    VARIANCE OF SAMPLING DISTRIBUTIONFROM THE SAMPLE MEAN STANDARD DEVIATION OF SAMPLING DISTRIBUTION FROM THE SAMPLE MEAN
  • 14.
    Properties of themean, variance and standard deviation. 1. The mean of the sample is equal to its sample distribution. 2. The variance and its standard Deviation of the sample distribution can be determined from the sample means
  • 15.
    Form a groupof five members, (in each group) Get the height in meter of each member of the group. Draw random samples of size n=2 from these heights. 1.How many samples can be drawn from it? 2.Determine the mean, variance, standard deviation of the sample mean . 3.Draw a histogram of your group. *** RUBRICS IS GIVEN.
  • 16.
    Given the ffvalues of the price of candies in a Candy stall determine the unknown. N= 5 n=2 𝑃 7, 𝑃8, 𝑃9. 𝑃10, 𝑃11 1.Mean (Sample Mean and Sampling Distribution) 2. Variance (Sample Mean and Sampling Distribution) 3. Standard Deviation (Sample Mean and Sampling Distribution)
  • 17.
    SOLUTION: SAMPLE MEAN SAMPLING DISTRIBUTION MEAN9 9 VARIANCE 2 0.75 STANDARD DEVIATION 1.41 0.87