
Recommended
More Related Content
Similar to Ch 11.2 Chi Squared Test for Independence.pptx
Similar to Ch 11.2 Chi Squared Test for Independence.pptx (20)
More from BAGARAGAZAROMUALD2
More from BAGARAGAZAROMUALD2 (12)
Recently uploaded
Recently uploaded (20)
Ch 11.2 Chi Squared Test for Independence.pptx
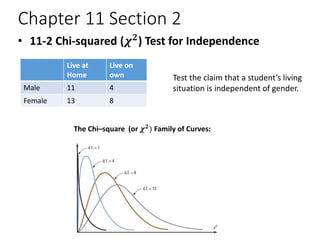
- 1. Chapter 11 Section 2 • 11-2 Chi-squared (𝝌𝟐) Test for Independence Test the claim that a student’s living situation is independent of gender. Live at Home Live on own Male 11 4 Female 13 8 The Chi–square (or 𝝌𝟐 ) Family of Curves:
- 2. 11.2 Chi Squared Test for Independence • The chi squared test for independence tests whether two categorical variables are independent of one another. The data is often summarized in a contingency table. • A contingency table is a two-way frequency table for categorical data that has at least two rows and two columns. Suppose a new postoperative procedure is administered to a group of patients at a particular hospital. A large furniture retailer with stores in three cities had the following results from a special weekend sale. • Chi Square Test for Independence tests the null hypothesis which states the variables in the rows and columns are independent of one another.
- 3. Chi Squared Test for Independence • Assumptions for Test of Goodness of Fit 1. Identify the variable and the level of measurement. 2. The data are obtained from a random sample. 3. The expected frequency for each category must be 5 or more. • The hypotheses are: • H0: The two variables are independent (no relationship). • H1: The two variables are dependent (there is a relationship the two variables). • If the null hypothesis is rejected, there is some relationship between the variables.
- 4. Contingency Tables – Degrees of Freedom • The degrees of freedom for any contingency table are d.f. = (# rows – 1) (# columns – 1) = (R – 1)(C – 1). Don’t count the labels or the totals.
- 5. Example: Hospitals and Infections A researcher wishes to see if there is a relationship between the hospital and the type of patient infections. A sample of 3 hospitals was selected, and the number of infections for a specific year has been reported. The data are shown next. Degrees of freedom are calculated as: (#rows – 1) x (# columns – 1) Do not count labels or totals.
- 6. Example: Hospitals and Infections Step 1: State the hypotheses and identify the claim. H0: The type of infection is independent of the hospital. H1: The type of infection is dependent on the hospital (claim). Step 2: Find the critical value. The critical value at α = 0.05 d.f. = (# rows – 1) x (# columns – 1) = (3 – 1)(3 – 1) =(2)(2) = 4 we can use GeoGebra to find the CV (see next slide) Step 0: Assumptions
- 7. Use GeoGebra to find the critical value 1) Select Chi-Squared distribution and enter the correct d.f. 2) Select right-tail test and enter your alpha value
- 8. In GeoGebra: 1) Select ChiSquared Test from the Statistics tab 2) For this example there were 3 rows and 3 columns 3) You can label each column and row in terms of what they represent. 4) Fill in the given information. 5) The degrees of freedom and 𝜒2 test value are summarized in the results. Note: You may click the expected count if you want to see the expected values. Step 3: the Test value The test value is being computed from the formula: 𝜒2 = 𝑂 −𝐸 2 𝐸 . Slides showing how to do it manually are at the end of the slide show.
- 9. Step 4: Make the decision. The decision is to reject the null hypothesis since 30.698 is in the critical region. Step 5: Summarize the results. There is enough evidence to support the claim that the type of infection is related to the hospital where they occurred. First recall our hypotheses:
- 10. Example: Alcohol and Gender A researcher wishes to determine whether there is a relationship between the gender of an individual and the amount of alcohol consumed. A sample of 68 people is selected, and the following data are obtained. At α= 0.10 can the researcher conclude that alcohol consumption is related to gender? Alcohol Consumption Gender Low Moderate High Total Male 10 9 8 27 Female 13 16 12 41 Total 23 25 20 68
- 11. Example: Alcohol and Gender Step 1: State the hypotheses and identify the claim. H0: The amount of alcohol that a person consumes is independent of the individual’s gender. H1: The amount of alcohol that a person consumes is dependent on the individual’s gender (claim). Step 2: Find the critical value. d.f. (2 – 1)(3 – 1) = 2 CV: 𝜒2= 4.6052 Step 0: Assumptions
- 12. Example: Alcohol and Gender Step 3: Find the critical value.
- 13. Example: Alcohol and Gender Step 3: Compute the test value. 𝜒2 = 0.2809 from GeoGebra Step 4: Make the decision. Do not reject the null hypothesis Step 5: Summarize the results. There is not enough evidence to support the claim that the amount of alcohol a person consumes is dependent on the individual’s gender.
- 14. The following slides shows how the test value for a chi-squared test for independence is calculated manually. The example used to demonstrate this process is the hospitals and infections example. In order to test the null hypothesis, one must compute the expected frequencies, assuming the null hypothesis is true.
- 15. Example: Hospitals and Infections First compute the expected values: row sum column sum grand total E Let’s see where these calculated values end up on the next slide.
- 16. Example: Hospitals and Infections Observed vs Expected
- 17. Example: Hospitals and Infections Step 3: Compute the test value.