INTRODUCTION
Definition: TheChi-Square test (χ²) is a statistical test used to
determine whether there is a significant association between
observed and expected frequencies in categorical data.
Purpose: It helps determine whether the differences between the
observed and expected frequencies are due to chance or if they
are statistically significant.
.
3.
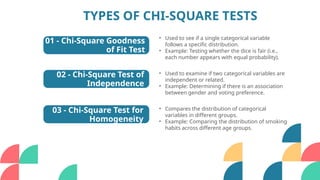
02 - Chi-SquareTest of
Independence
03 - Chi-Square Test for
Homogeneity
• Used to see if a single categorical variable
follows a specific distribution.
• Example: Testing whether the dice is fair (i.e.,
each number appears with equal probability).
• Used to examine if two categorical variables are
independent or related.
• Example: Determining if there is an association
between gender and voting preference.
• Compares the distribution of categorical
variables in different groups.
• Example: Comparing the distribution of smoking
habits across different age groups.
TYPES OF CHI-SQUARE TESTS
01 - Chi-Square Goodness
of Fit Test
4.
The Chi-Square statisticis calculated using the following formula:
χ2
= (O
∑ i – Ei)2
/Ei
Where:
Oi = Observed frequency for category i
Ei = Expected frequency for category i
Chi-Square Formula
5.
Assumptions for theChi-
Square Test
• The data must be in the form of counts or frequencies (not
percentages).
• The observations should be independent of each other.
• The sample size should be sufficiently large (typically each expected
frequency should be at least 5).
• The categories must be mutually exclusive.
6.
STEPS TO PERFORMA CHI-SQUARE
TEST
State the Hypothesis
• Null Hypothesis (H0H_0H0):
Assumes no relationship between
the variables or the observed
frequencies follow the expected
distribution.
• Alternative Hypothesis
(HaH_aHa): Assumes a relationship
between the variables or the
observed frequencies do not match
the expected distribution.
Calculate the
Chi-Square
Statistic
Use the formula for χ².
Determine the Degrees
of Freedom (df)
• For the goodness of fit test,
df=k 1df = k - 1df=k 1,
− −
where kkk is the number of
categories.
• For the test of independence,
df=(r 1)(c 1)df = (r - 1)(c -
− −
1)df=(r 1)(c 1), where rrr is
− −
the number of rows and ccc is
the number of columns in the
contingency table.
Find the Critical Value
From the Chi-Square
distribution table, find the
critical value based on the
desired significance level (α
alphaα) and degrees of
freedom.
Make a Decision
If the computed Chi-Square
statistic is greater than the
critical value, reject the null
hypothesis.
STEP 1
STEP 1
STEP 2
STEP 3
STEP 4
STEP 5
7.
1
2
3
APPLICATIONS OF CHI-SQUARE
TEST
MARKETRESEARCH
Used to analyze consumer
preferences and determine if factors
like age, gender, or income influence
purchasing decisions.
HEALTHCARE STUDIES
Determine if there is a relationship
between lifestyle factors (e.g.,
smoking, diet) and health outcomes
(e.g., heart disease).
SOCIAL STUDIES
Investigating the relationship between
education level and employment
status, or gender and voting behavior.
5
4
6
Testing the relationship between study
methods and academic performance
(e.g., comparing results of different
teaching methods).
Analyzing voting patterns based on
various factors like geography,
ethnicity, or income.
POLITICAL SCIENCE
EDUCATION
QUALITY CONTROL
Used in manufacturing to analyze if
the number of defective items in
different production lines are
independent of one another.
8.
• Non-continuous Data:Chi-square tests are not suitable for
continuous data.
• Small Sample Sizes: The test may not be reliable if the sample
size is too small, particularly when expected frequencies are less
than 5.
• Expected Frequency Assumptions: The validity of the test
depends on the assumption that expected frequencies are
sufficiently large.
• Over-simplification: It doesn’t give you specific information
about the nature of the relationship, just whether one exists.
Limitations of the Chi-Square
Test
9.
Example 1: Chi-SquareGoodness of Fit
Question: Does a die roll result in equal
distribution (1/6 probability for each number)?
Data: Observed frequencies from a die roll
experiment.
Hypothesis: Ho (The die is fair) vs. Ha (The die is
not fair).
Outcome: Calculate χ2
and compare it with the
critical value to make a decision.
EXAMPLE
APPLICATIONS
Example 2: Chi-Square Test of Independence
Question: Is there an association between gender
and voting preference?
Data: Cross-tabulate gender (Male/Female) and
voting preference (Candidate A/Candidate B).
Hypothesis: Ho (Voting preference and gender are
independent) vs. Ha (Voting preference and gender
are related).
Outcome: Calculate χ2
, degrees of freedom, and
compare with the critical value to conclude.
1
2
10.
CONCLUSION • TheChi-Square test is a
powerful tool in statistics for
analyzing categorical data.
• Understanding the
assumptions and limitations is
crucial for correctly applying
the test and interpreting its
results.
• It helps determine whether
there is a statistically significant
relationship between variables
and is widely used in research
across various fields.
• It plays a vital role in
hypothesis testing, helping
researchers validate models,
identify associations, and make
informed decisions.