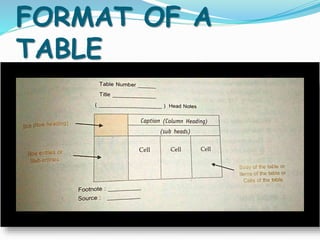
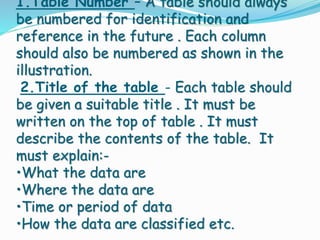
By tabulation we mean, a systematic
presentation of numerical data in
column and rows in accordance with
some salient features :-
 It facilitates the process of
comparison.
 It facilitates the submission of
items & detection of any errors.
 It provides a basis for various
statistical computation.
 According to Secrist ,
Classification is the process of
arranging data in to sequences
and group according to their
common characteristics or
separating them into different
but related parts.
 In the words of
Prof.Neiswanger , A statistical
table is a systematic
 To clarify the object of
investigation.
 To simplify complex data.
 To present facts in the minimum of
space.
 To facilitate comparison.
 To detect errors and omission in
the data.
 To make data fit for analysis and
A good statistical table is an art. The following
parts must be present in all tables.
1. Table number.
2. Tittle.
3. Head notes.
4. Captions.
5. Stubs.
6. Body of the table.
7. Foot note.
8. Source note.
FORMAT OF A
TABLE
1.Table Number – A table should always
be numbered for identification and
reference in the future . Each column
should also be numbered as shown in the
illustration.
2.Title of the table - Each table should
be given a suitable title . It must be
written on the top of table . It must
describe the contents of the table. It
must explain:-
•What the data are
•Where the data are
•Time or period of data
•How the data are classified etc.
example the unit of measurement is written as
a headnote ,such as in millions or in cores.
4.Captions–These are headings for the
vertical columns .They have main heading and
sub-headings and must be written in small
letters.
5.Stubs-These are the headings or
designation for the horizontal rows .Stubs are
wider than columns.
6.Body of the table - It contains the
numerical information .It is the most
important part of the table.The arrangement
in the body is generally from left to right in
rows and from top to bottom in columns.
7.Foot-Note-If any explanation
or elaboration regarding any item
is necessary ,footnotes should be
given.
8.Source-note–It refers to the
source from where in formation
has been taken .It is useful to the
reader to check the figures and
gather additional information .
 Title.
 Size.
 Simplicity.
 Focus.
 Clarity.
 Units.
 Avoid abbreviations.
Made by:
Vipin
Singh

VIPIN SINGH PRESENTATION

  • 2.
    By tabulation wemean, a systematic presentation of numerical data in column and rows in accordance with some salient features :-  It facilitates the process of comparison.  It facilitates the submission of items & detection of any errors.  It provides a basis for various statistical computation.
  • 3.
     According toSecrist , Classification is the process of arranging data in to sequences and group according to their common characteristics or separating them into different but related parts.  In the words of Prof.Neiswanger , A statistical table is a systematic
  • 4.
     To clarifythe object of investigation.  To simplify complex data.  To present facts in the minimum of space.  To facilitate comparison.  To detect errors and omission in the data.  To make data fit for analysis and
  • 5.
    A good statisticaltable is an art. The following parts must be present in all tables. 1. Table number. 2. Tittle. 3. Head notes. 4. Captions. 5. Stubs. 6. Body of the table. 7. Foot note. 8. Source note.
  • 6.
  • 7.
    1.Table Number –A table should always be numbered for identification and reference in the future . Each column should also be numbered as shown in the illustration. 2.Title of the table - Each table should be given a suitable title . It must be written on the top of table . It must describe the contents of the table. It must explain:- •What the data are •Where the data are •Time or period of data •How the data are classified etc.
  • 8.
    example the unitof measurement is written as a headnote ,such as in millions or in cores. 4.Captions–These are headings for the vertical columns .They have main heading and sub-headings and must be written in small letters. 5.Stubs-These are the headings or designation for the horizontal rows .Stubs are wider than columns. 6.Body of the table - It contains the numerical information .It is the most important part of the table.The arrangement in the body is generally from left to right in rows and from top to bottom in columns.
  • 9.
    7.Foot-Note-If any explanation orelaboration regarding any item is necessary ,footnotes should be given. 8.Source-note–It refers to the source from where in formation has been taken .It is useful to the reader to check the figures and gather additional information .
  • 10.
     Title.  Size. Simplicity.  Focus.  Clarity.  Units.  Avoid abbreviations.
  • 11.