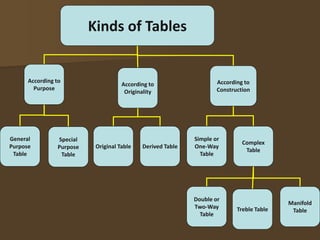
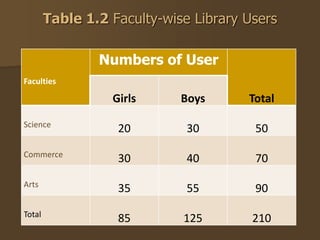
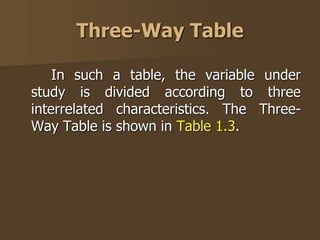
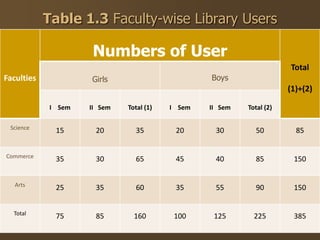
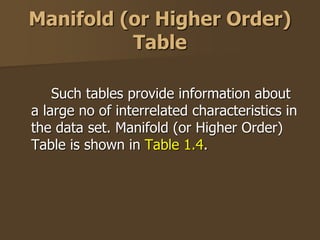
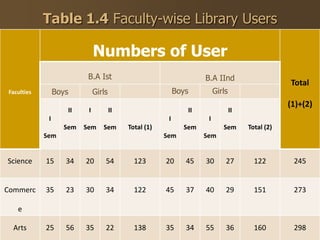
This document discusses different types of tabular presentation of data. It defines a table as the systematic organization of data in rows and columns. The document outlines the key features of a good table and the objectives of tabulation. It then describes the different parts of a table and various ways tables can be classified, including by purpose, originality, and construction. Under construction, it provides examples of simple, double, three-way, and manifold tables.


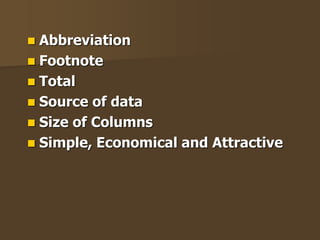
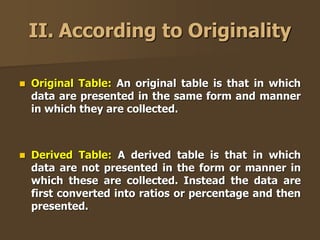
![Subheading Caption Total(Rows)
Subhead Subhead
Column-head Column-head Column-head
Sub Entries
Total (column)
Footnote :
Source Note :
Table Number and Title [Head or Prefatory Note (if any)]
Parts of a Table](https://image.slidesharecdn.com/tabulation-240417103939-90289bb6/85/tabulation-and-cross-tabulation-data-processsing-10-320.jpg)


![Tax_treatment_of_foreign_exchange_gains_and_losses[1].pptx](https://cdn.slidesharecdn.com/ss_thumbnails/taxtreatmentofforeignexchangegainsandlosses1-240423054357-99c2a343-thumbnail.jpg?width=640&height=640&fit=bounds)


