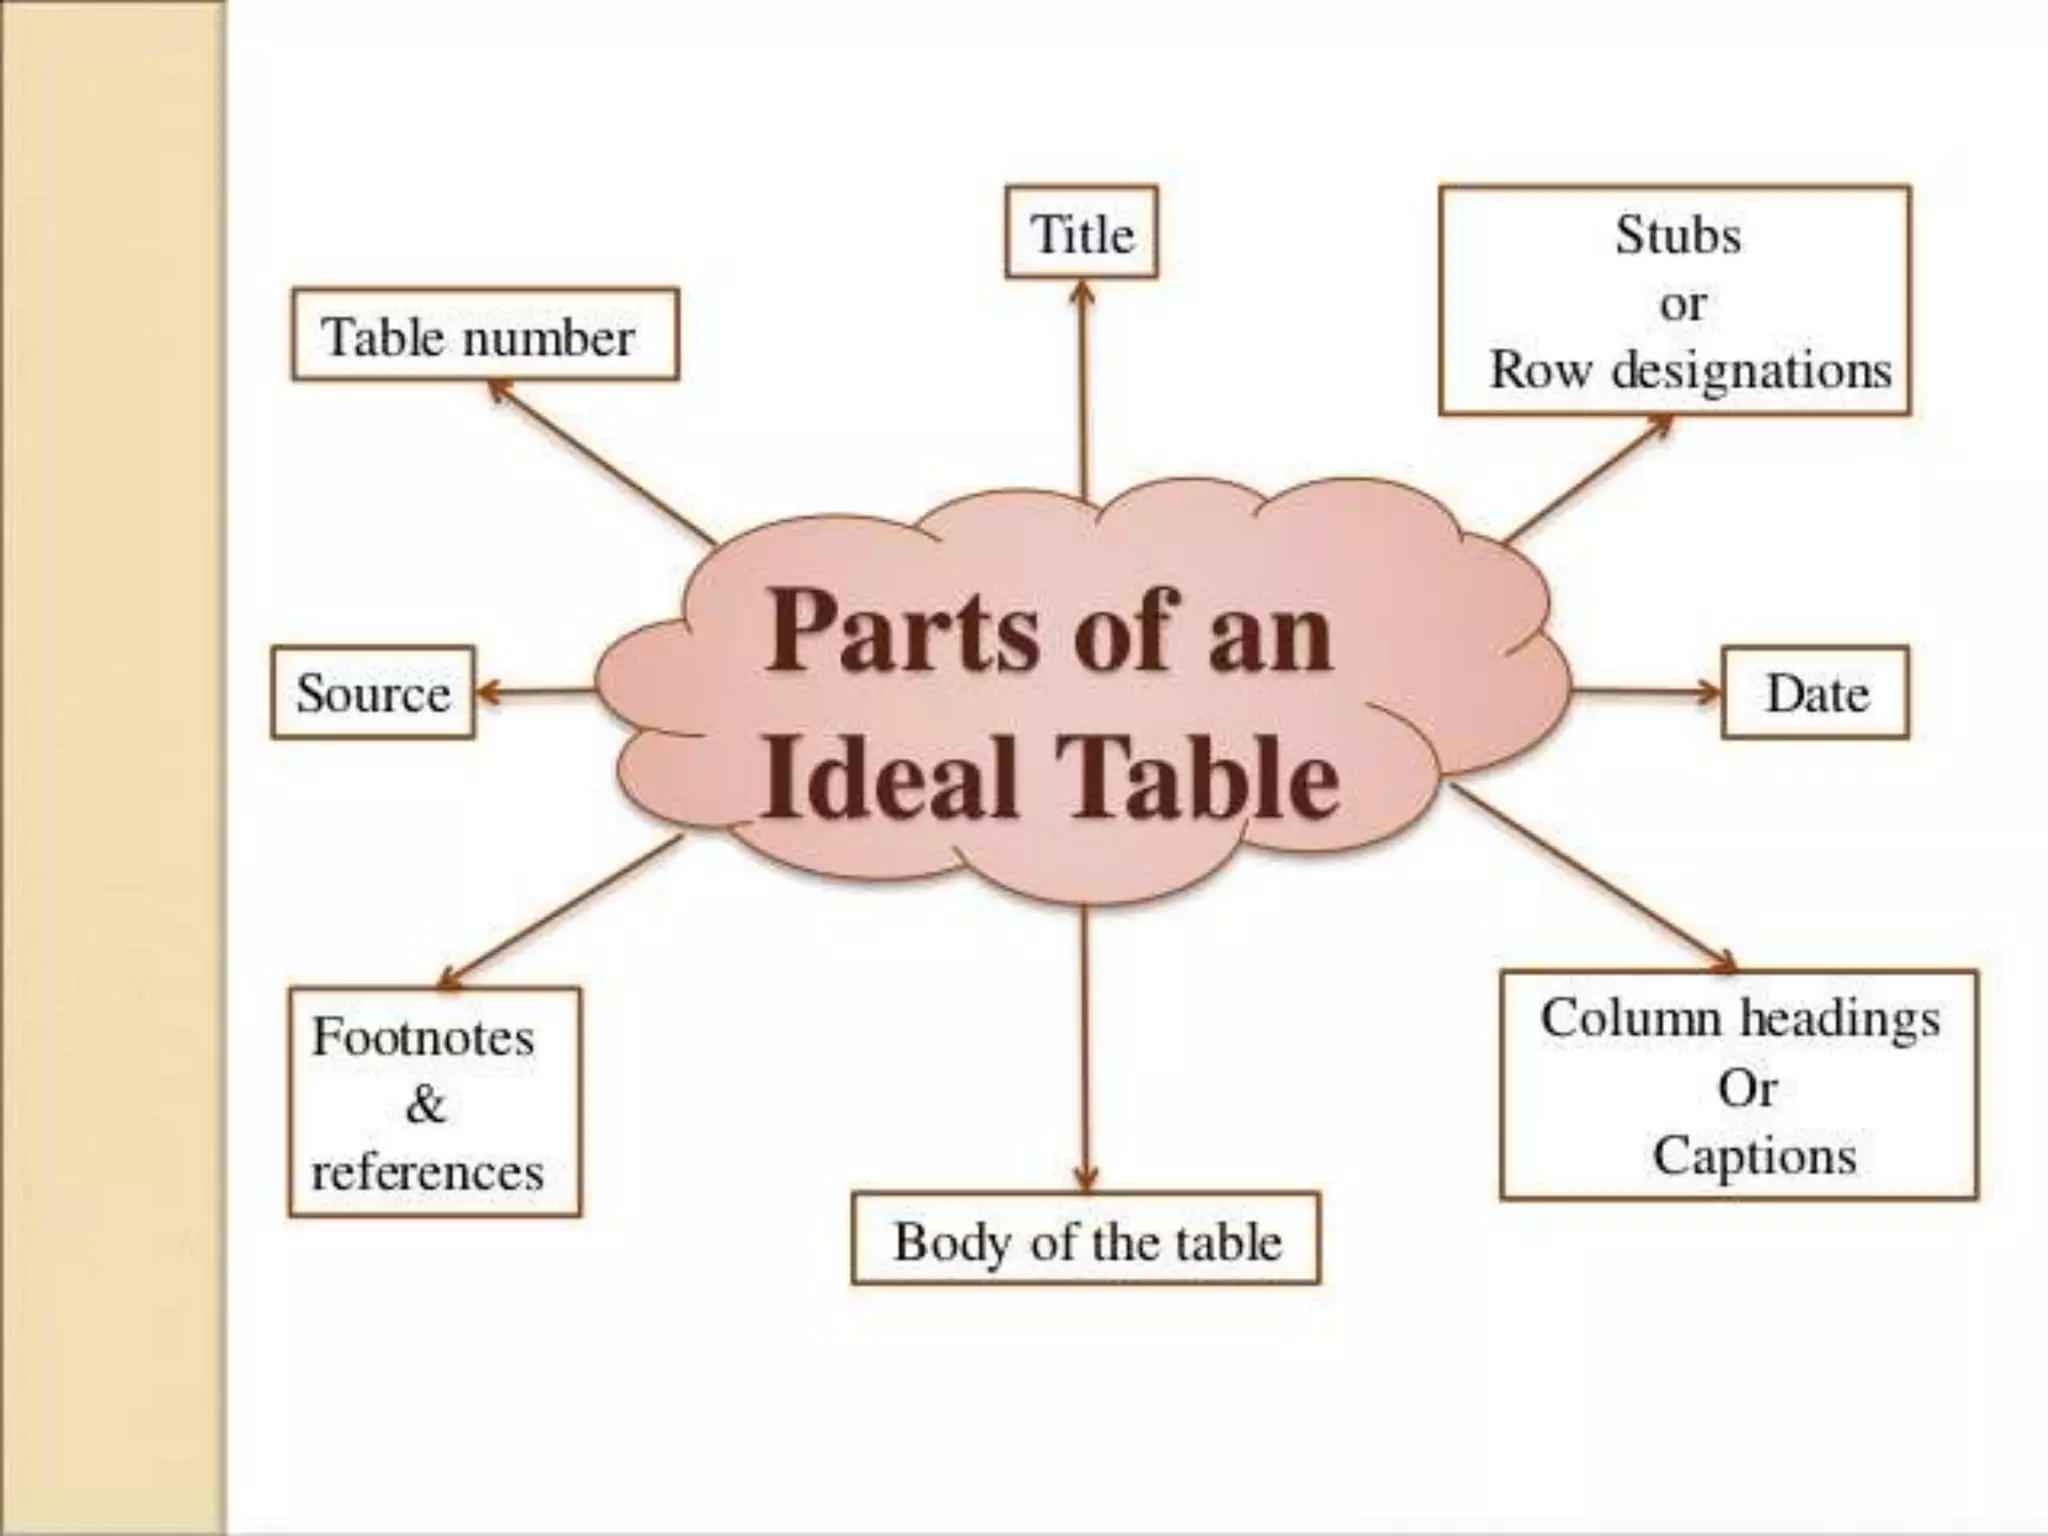
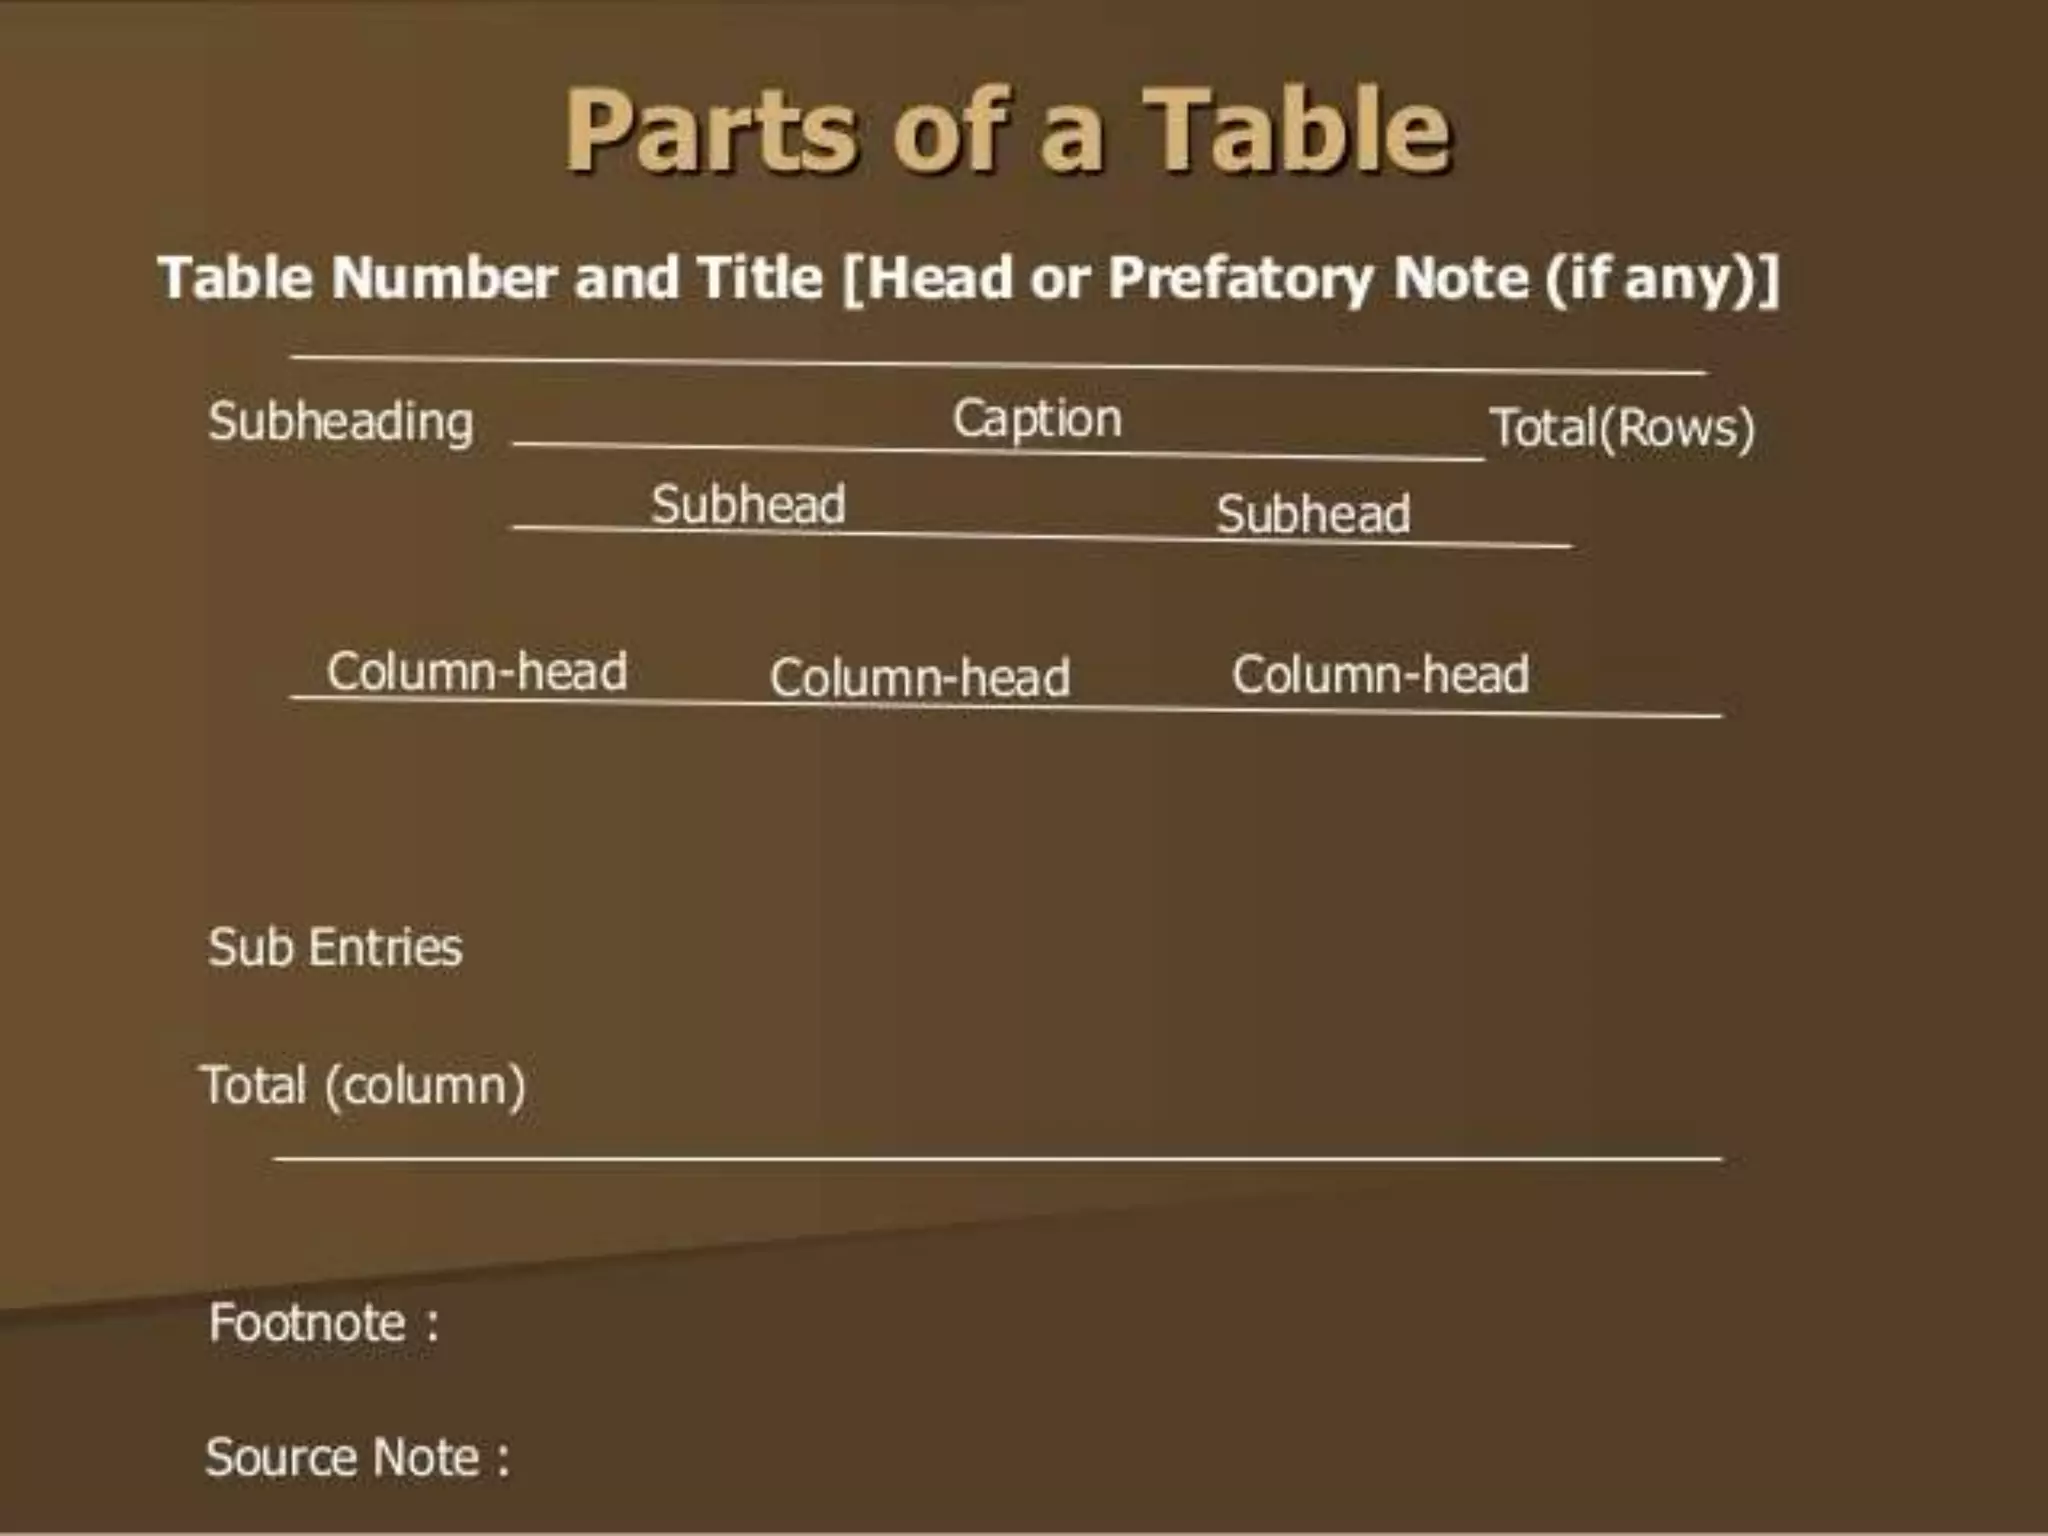
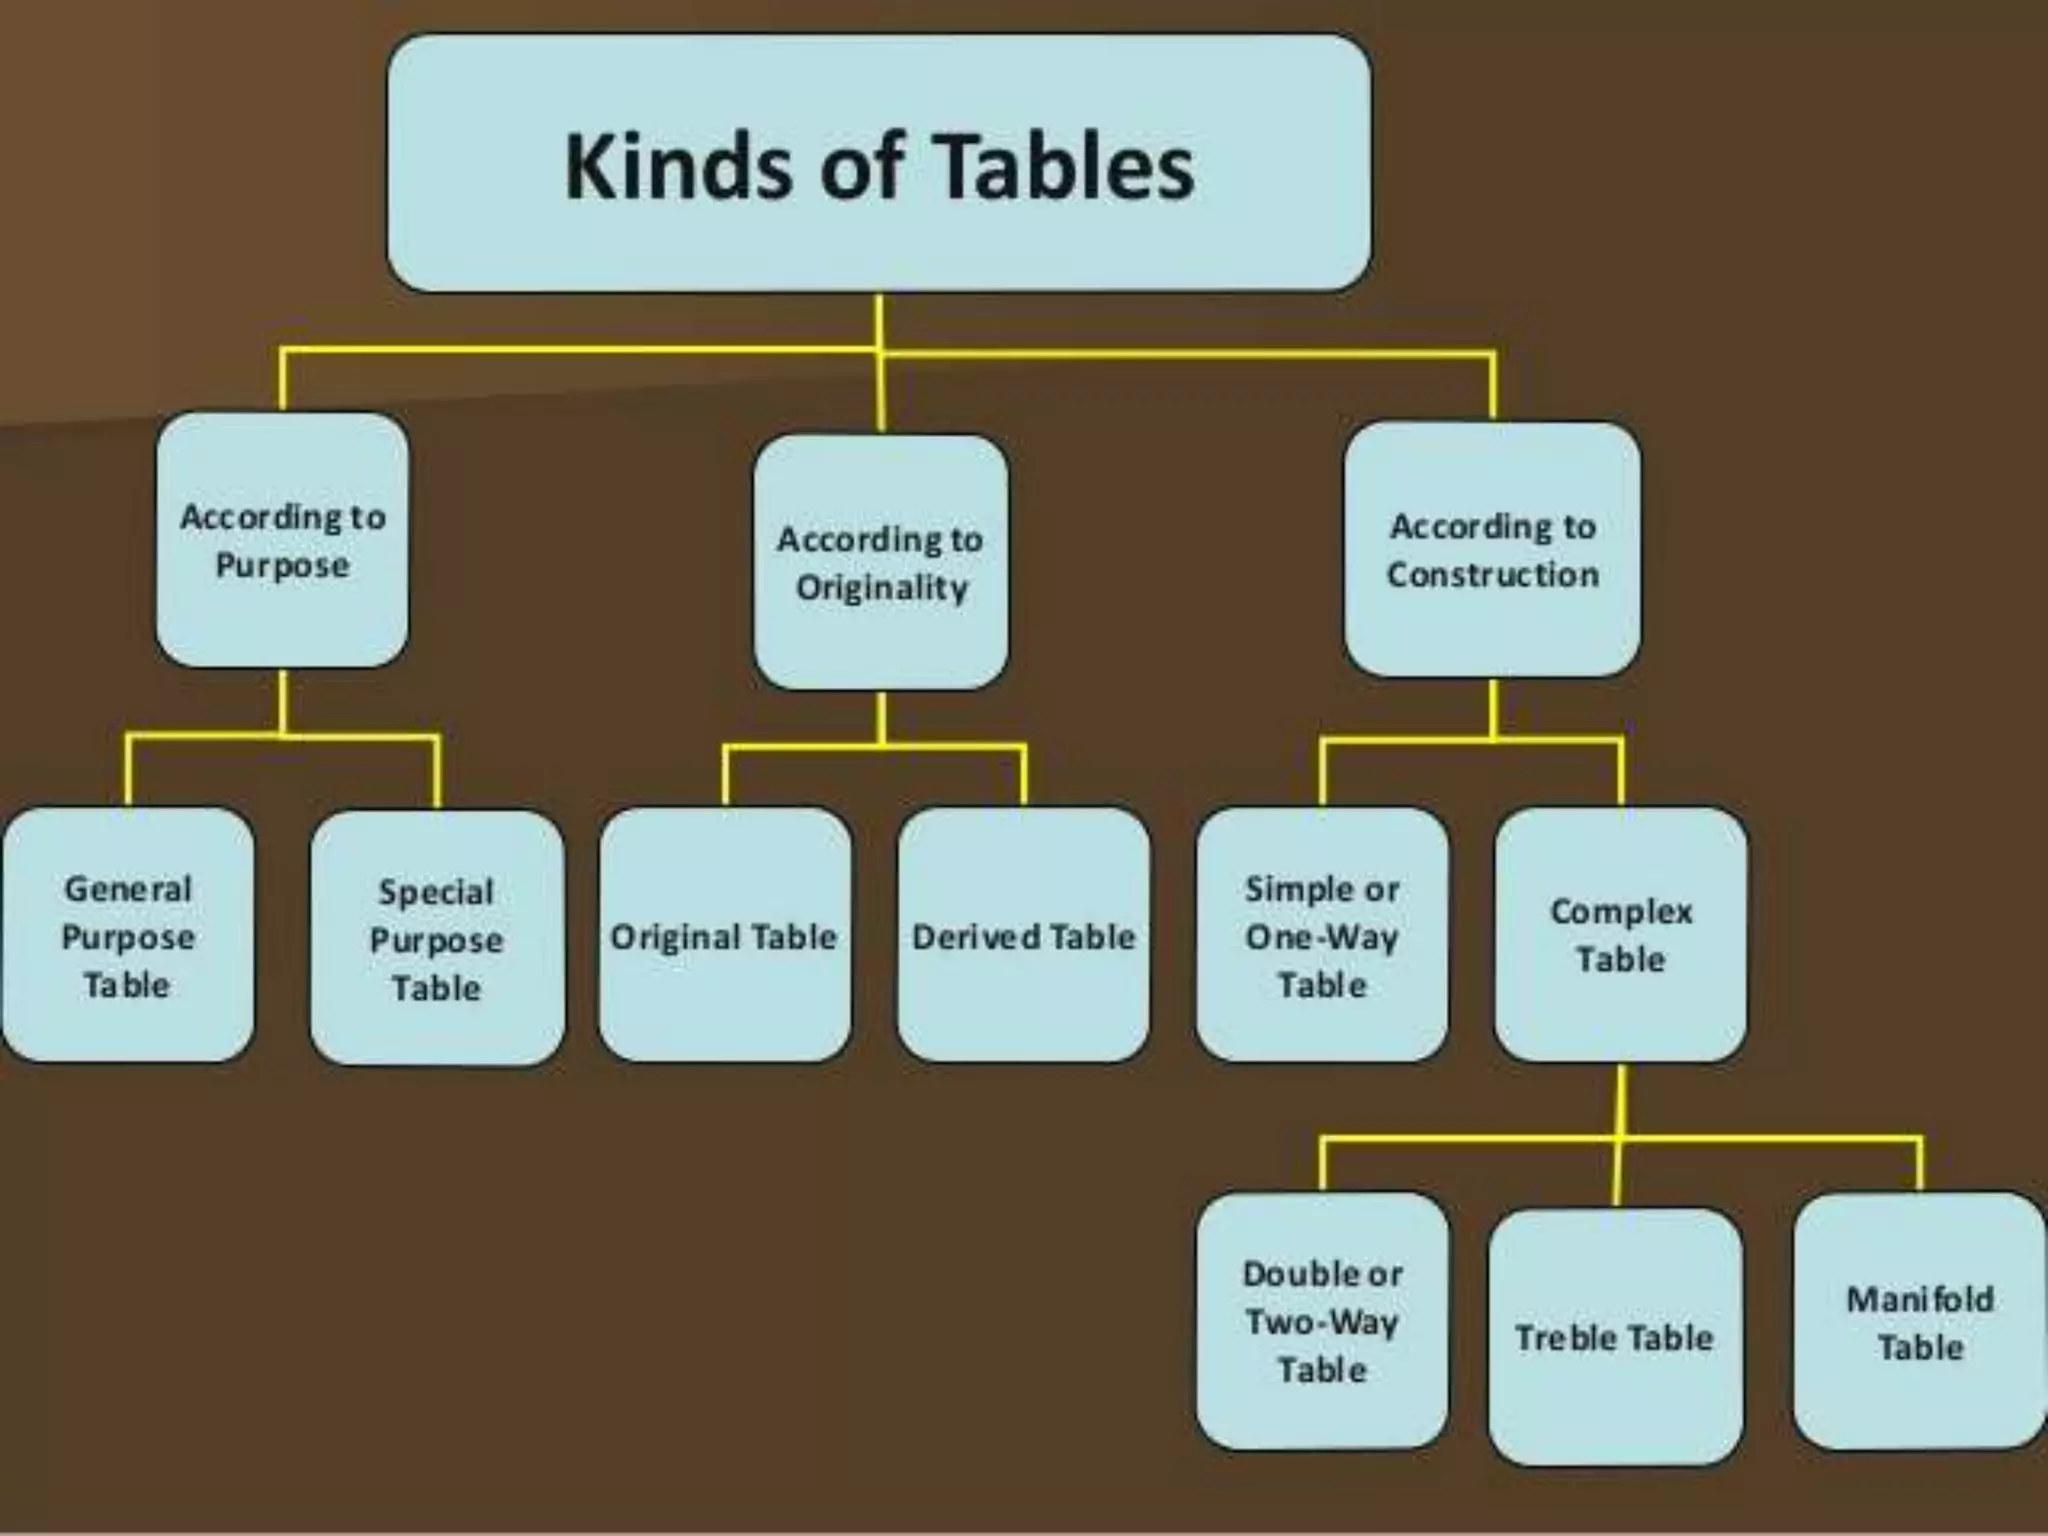
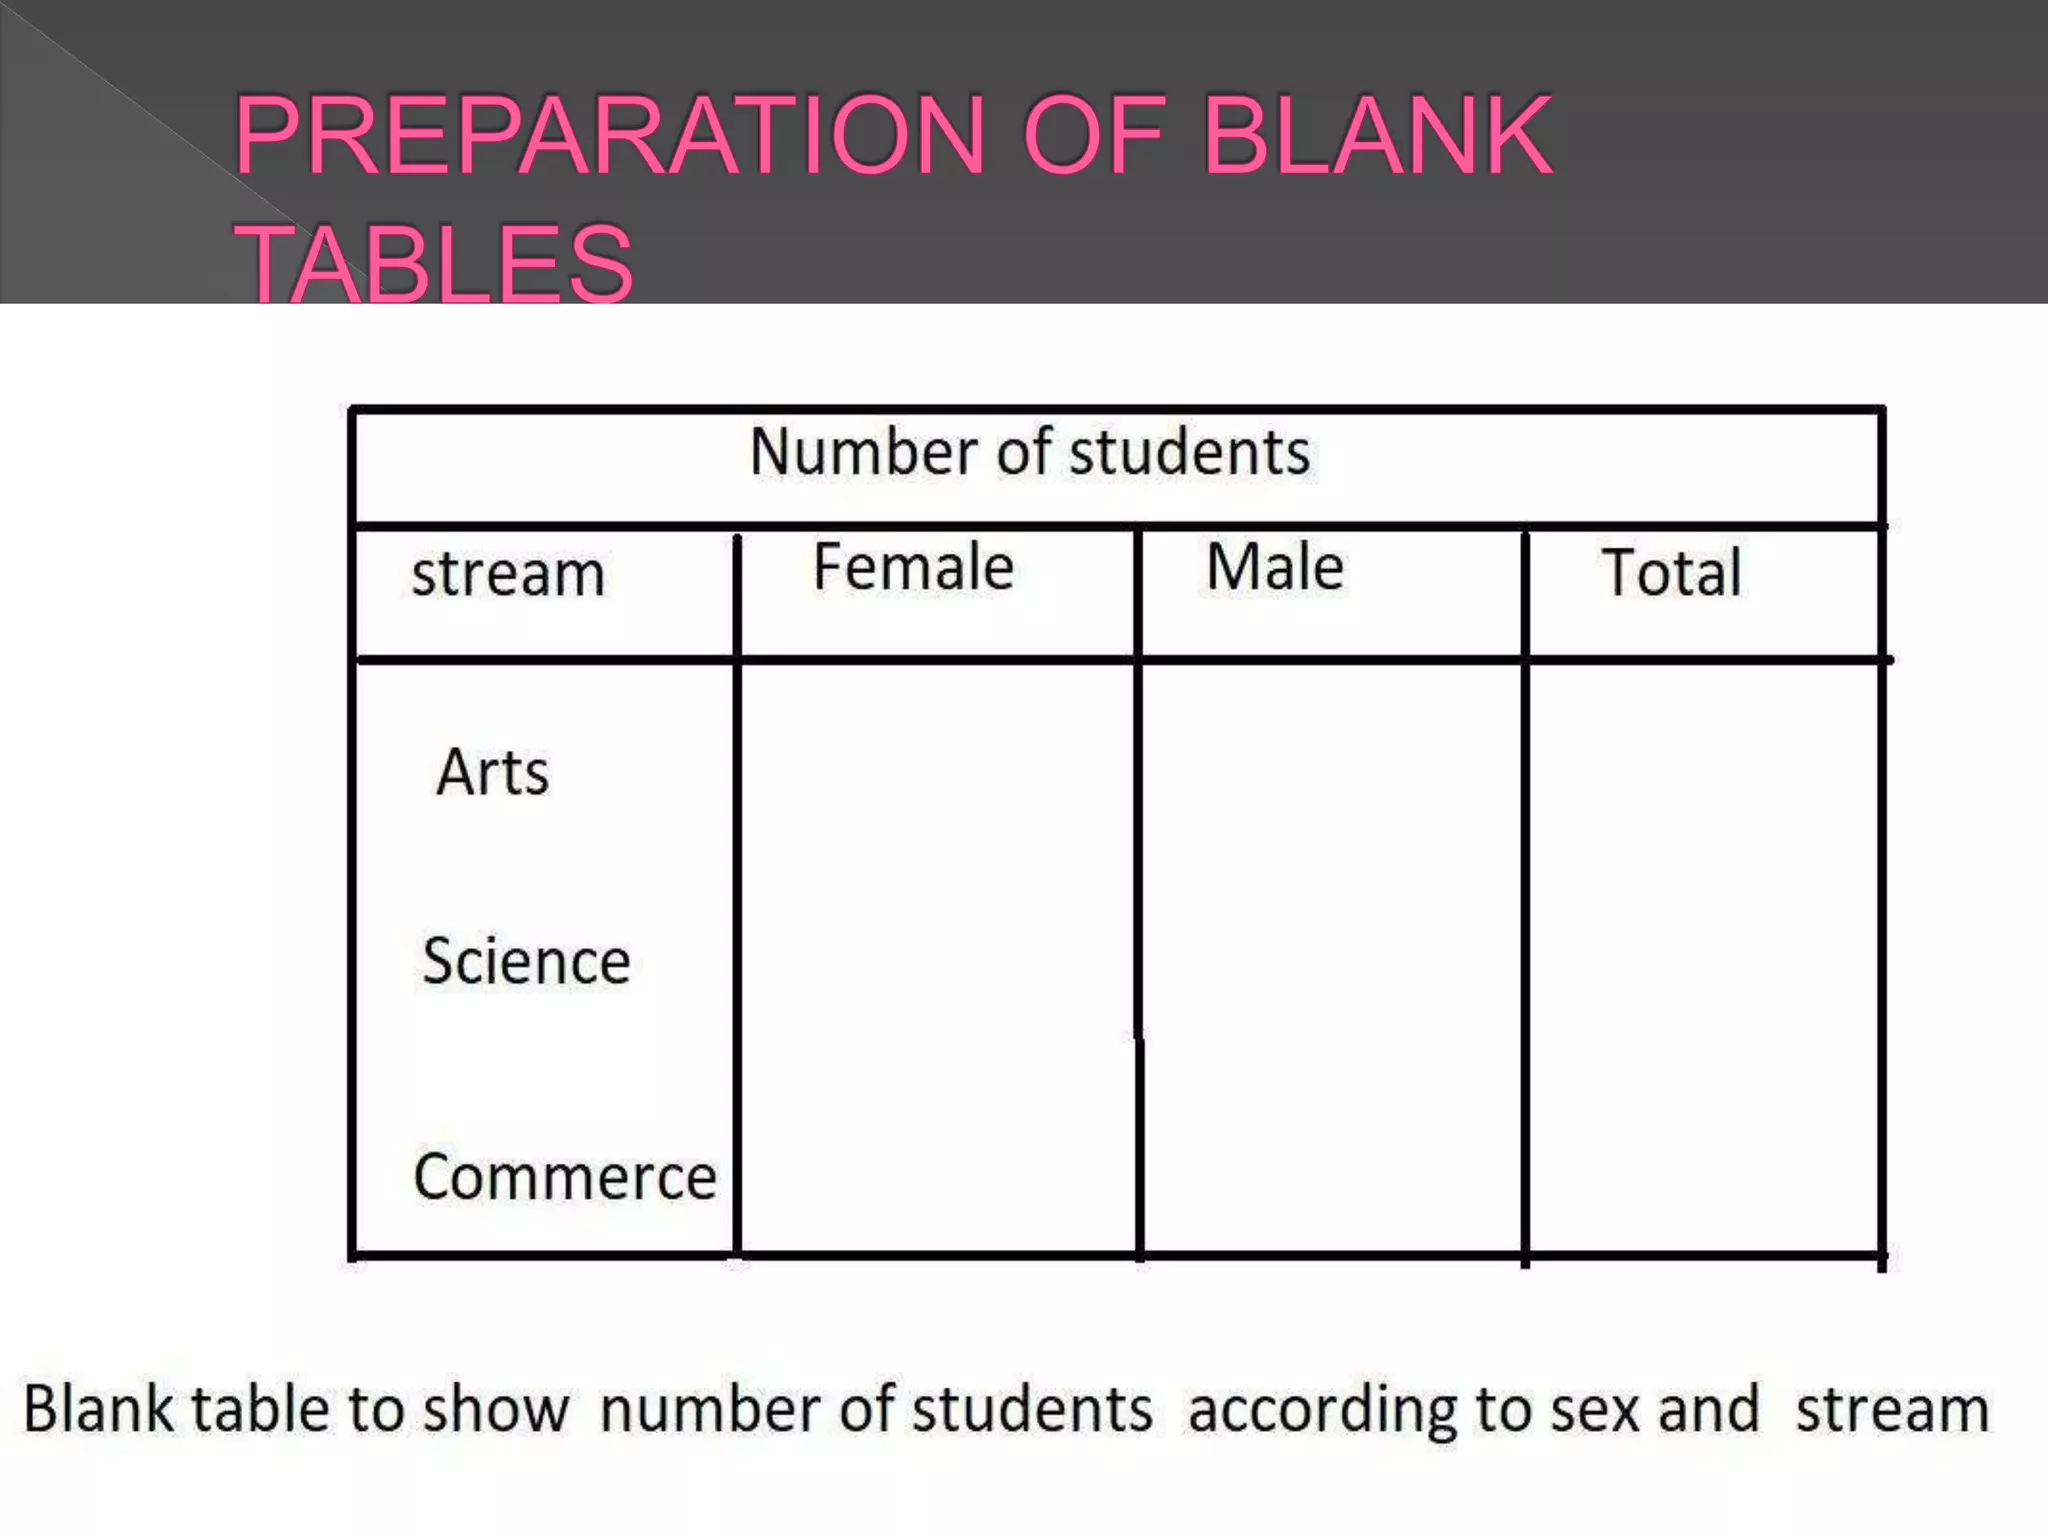
SlideShare a Scribd company logo
Orderly arrangement of data in columns and rows
conserves space
Comparison
summation of items
detection of errors and omissions
 statistical computations
Clear, concise and adequate title.
Distinct number to facilitate reference
Column headings and row headings of table should be clear and
brief.
Units of measurement under each heading or subheading must
always be indicated.
Explanatory footnotes –beneath the table
Source-just below the table.
Abbreviation, ditto should be avoided
To carry out investigation
To do comparison
To locate omissions and errors in the data.
To use space economically
To simplify data
To use it as future reference
Importance of Tabulation
Under tabulation, data is divided into various parts and for each part
there are totals and sub totals. Therefore, relationship between different
parts can be easily known.
Since data are arranged in a table with a title and a number so these
can be easily identified and used for the required purpose
Tabulation makes the data brief. Therefore, it can be easily
presented in the form of graphs.
Tabulation presents the numerical figures in an attractive form.
Simple tabulation
Simple tabulation is when the data are tabulated to one characteristic. For
example, the survey that determined the frequency or number of employees of a
firm owning different brands of mobile phones like Blackberry, Nokia, I phone, etc.
Double tabulation
Double tabulation is when two characteristics of data are tabulated. For example,
frequency or number of male and female employees in the firm owning different
brand of mobile phones like Blackberry, Nokia, Iphone, etc.
Complex tabulation
Complex tabulation of data that includes more than two characteristics. For
example, frequency or number of male, female and the total employees owning
different brand of mobile phones like Blackberry, Nokia, I phone, etc. Cross
tabulations, is also a sub-type of complex tabulation that includes cross-classifying
factors to build a contingency table of counts or frequencies at each combination of
factor levels. A contingency table is a display format used to analyze and record
the possible relationship between two or more categorical variables
There are no hard and fast rules for the tabulation of data but for
constructing good table, following general rules should be observed
while tabulating statistical data. • The table should suit the size of the
paper and, therefore, the width of the column should be decided before
hand. • Number of columns and rows should neither be too large nor
too small. • As far as possible figures should be approximated before
tabulation. This would reduce unnecessary details.
Items should be arranged either in alphabetical, chronological or
geographical order or according to size. • The sub-total and total of the
items of the table must be written. • Percentages are given in the tables
if necessary. • Ditto marks should not be used in a table because
sometimes it create confusion. • Table should be simple and attractive.
• A table should be logical, well-balanced in length and breadth and the
comparable columns should be placed side by side. • Light/heavy/thick
or double rulings may be used to distinguish sub columns, main
columns and totals. • For large data more than one table may be used.
Title as compatible with the objective of the study
To facilitate comparison.
Ideal Size
Stubs
Use of Zero
Abbreviation
Footnote
Total
Source of data
Size of Columns
Simple, Economical and Attractive
Table number: A number must be allotted to the table for
identification, particularly when there are many tables in a
study.
Title: The title should explain what is contained in the table. It
should be clear, brief and set in bold type on top of the table.
It should also indicate the time and place to which the data
refer. Parts of an Ideal Table
Date: The date of preparation of the table should be given.
Stubs or Row designations: Each row of the table should be
given a brief heading. Such designations of rows are called
“stubs”, or, “stub items” and the entire column is called “stub
column”.
Column headings or Captions: Column designation is given on top of
each column to explain to what the figures in the column refer. It should
be clear and precise. This is called a “caption”, or, “heading”. columns
should be numbered if there are four, or, more columns.
Body of the table: The data should be arranged in such a way that any
figure can be located easily. Various types of numerical variables should
be arranged in an ascending order, i.e., from left to right in rows and from
top to bottom in columns. Column and row totals should be given.
Source: At the bottom of the table a note should be added indicating the
primary and secondary sources from which data have been collected.
Footnotes and references: If any item has not been explained properly, a
separate explanatory note should be added at the bottom of the table.
Tabulation
Tabulation
Tabulation
Tabulation
Tabulation

More Related Content

What's hot

Tabulation
Tabulation Tabulation
Tabulation
Pranav Krishna
 
Methods of data presention
Methods of data presentionMethods of data presention
Methods of data presention
Dr Vaibhav Gupta
 
Data Interpretation
Data Interpretation Data Interpretation
Data Interpretation
sonakshi saxena
 
3. Tabulation of data.pptx
3. Tabulation of data.pptx3. Tabulation of data.pptx
3. Tabulation of data.pptx
SGRRIMHS
 
Data collection - Nursing research
Data collection - Nursing researchData collection - Nursing research
Data collection - Nursing research
RVS Institute of Health Sciences, Sulur, Coimbatore
 
Chapter 8 (procedure of data collection)
Chapter 8 (procedure of data collection)Chapter 8 (procedure of data collection)
Chapter 8 (procedure of data collection)
BoreyThai1
 
Presentation of Data
Presentation of DataPresentation of Data
Presentation of Data
Umair Anwar
 
Qualitative research designs converted
Qualitative research designs convertedQualitative research designs converted
Qualitative research designs converted
DEVA PON PUSHPAM I
 
Nonexperimental research design
Nonexperimental research designNonexperimental research design
Nonexperimental research design
Nursing Path
 
Methods of Data Collection in Statistics
Methods of Data Collection in StatisticsMethods of Data Collection in Statistics
Methods of Data Collection in Statistics
Clyde Bangligan
 
Flashcards
FlashcardsFlashcards
Flashcards
katherin moreno
 
Data collection,tabulation,processing and analysis
Data collection,tabulation,processing and analysisData collection,tabulation,processing and analysis
Data collection,tabulation,processing and analysis
RobinsonRaja1
 
Analysis of data
Analysis of dataAnalysis of data
Analysis of data
TanirikaGodiyal
 
Data presentation
Data presentationData presentation
Data presentation
MaiBabes17
 
Qualitative research design
Qualitative research designQualitative research design
Qualitative research design
MR. JAGDISH SAMBAD
 
Quantitative research design
Quantitative research design Quantitative research design
Quantitative research design
Kiranbir Kaur
 
Sample and sampling techniques
Sample and sampling techniquesSample and sampling techniques
Sample and sampling techniques
Nursing Path
 
Resarch design
Resarch designResarch design
Resarch design
Jasmi Manu
 
Pilot study
Pilot studyPilot study
Pilot study
YasminFathimaa
 
Analysis and interpretation of data
Analysis and interpretation of dataAnalysis and interpretation of data
Analysis and interpretation of data
teppxcrown98
 

What's hot (20)

Tabulation
Tabulation Tabulation
Tabulation
 
Methods of data presention
Methods of data presentionMethods of data presention
Methods of data presention
 
Data Interpretation
Data Interpretation Data Interpretation
Data Interpretation
 
3. Tabulation of data.pptx
3. Tabulation of data.pptx3. Tabulation of data.pptx
3. Tabulation of data.pptx
 
Data collection - Nursing research
Data collection - Nursing researchData collection - Nursing research
Data collection - Nursing research
 
Chapter 8 (procedure of data collection)
Chapter 8 (procedure of data collection)Chapter 8 (procedure of data collection)
Chapter 8 (procedure of data collection)
 
Presentation of Data
Presentation of DataPresentation of Data
Presentation of Data
 
Qualitative research designs converted
Qualitative research designs convertedQualitative research designs converted
Qualitative research designs converted
 
Nonexperimental research design
Nonexperimental research designNonexperimental research design
Nonexperimental research design
 
Methods of Data Collection in Statistics
Methods of Data Collection in StatisticsMethods of Data Collection in Statistics
Methods of Data Collection in Statistics
 
Flashcards
FlashcardsFlashcards
Flashcards
 
Data collection,tabulation,processing and analysis
Data collection,tabulation,processing and analysisData collection,tabulation,processing and analysis
Data collection,tabulation,processing and analysis
 
Analysis of data
Analysis of dataAnalysis of data
Analysis of data
 
Data presentation
Data presentationData presentation
Data presentation
 
Qualitative research design
Qualitative research designQualitative research design
Qualitative research design
 
Quantitative research design
Quantitative research design Quantitative research design
Quantitative research design
 
Sample and sampling techniques
Sample and sampling techniquesSample and sampling techniques
Sample and sampling techniques
 
Resarch design
Resarch designResarch design
Resarch design
 
Pilot study
Pilot studyPilot study
Pilot study
 
Analysis and interpretation of data
Analysis and interpretation of dataAnalysis and interpretation of data
Analysis and interpretation of data
 

Similar to Tabulation

VIPIN SINGH PRESENTATION
VIPIN SINGH PRESENTATIONVIPIN SINGH PRESENTATION
VIPIN SINGH PRESENTATION
 
Chapter 4
Chapter 4Chapter 4
Chapter 4
Pauline Velarde
 
Chapter 4 - Research Parts Guide.pptx
Chapter 4 - Research Parts Guide.pptxChapter 4 - Research Parts Guide.pptx
Chapter 4 - Research Parts Guide.pptx
GelmelinaLeaLepitenH
 
Tabulation of data-Development of Research Instrument/ Tool and Analysis
Tabulation of data-Development of Research Instrument/ Tool and Analysis Tabulation of data-Development of Research Instrument/ Tool and Analysis
Tabulation of data-Development of Research Instrument/ Tool and Analysis
ShaharyarShoukatShou
 
practical research 1 chapter 4 qualitative research
practical research 1 chapter 4 qualitative researchpractical research 1 chapter 4 qualitative research
practical research 1 chapter 4 qualitative research
MaggelAnclote2
 
presentation of data-1.ppt MODIFIED PATEY MASTECTOMY: More commonly used. • T...
presentation of data-1.ppt MODIFIED PATEY MASTECTOMY: More commonly used. • T...presentation of data-1.ppt MODIFIED PATEY MASTECTOMY: More commonly used. • T...
presentation of data-1.ppt MODIFIED PATEY MASTECTOMY: More commonly used. • T...
ssuser28ecf81
 
Tabulation
TabulationTabulation
Tabulation
freelancer
 
Numerical & graphical presentation of data
Numerical & graphical presentation of dataNumerical & graphical presentation of data
Numerical & graphical presentation of data
Sarfraz Ahmad
 
Displaying results APA Style
Displaying results APA Style Displaying results APA Style
Displaying results APA Style
Sidra Akhtar
 
Exel
ExelExel
TABULATION OF DATA.pptx(unit 4) (1).pptx
TABULATION OF DATA.pptx(unit 4) (1).pptxTABULATION OF DATA.pptx(unit 4) (1).pptx
TABULATION OF DATA.pptx(unit 4) (1).pptx
JOSEPHINELENTAF
 
research methodology presentation-6.pptx
research methodology presentation-6.pptxresearch methodology presentation-6.pptx
research methodology presentation-6.pptx
vidyasagarsharma0001
 
Figures and tables
Figures and tables Figures and tables
Figures and tables
tharaka_92
 
Results section my presentation
Results section my presentationResults section my presentation
Results section my presentation
tatenda jambo
 
Presentation of Data using various techniques -reserach.pptx
Presentation of Data using various techniques -reserach.pptxPresentation of Data using various techniques -reserach.pptx
Presentation of Data using various techniques -reserach.pptx
Ar.Vrushali Dhamne
 
Guidelines of Tables - APA Style - 7th Edition
Guidelines of Tables - APA Style - 7th EditionGuidelines of Tables - APA Style - 7th Edition
Guidelines of Tables - APA Style - 7th Edition
Thiyagu K
 
Data-Presentation-and-Interpretation-in-Tabular-Graphical.pptx
Data-Presentation-and-Interpretation-in-Tabular-Graphical.pptxData-Presentation-and-Interpretation-in-Tabular-Graphical.pptx
Data-Presentation-and-Interpretation-in-Tabular-Graphical.pptx
shyrahipolitoe
 
The uses of Tables & graphs
The uses of Tables & graphsThe uses of Tables & graphs
The uses of Tables & graphs
Franco Jesús
 
LECTURE 06 (SPREADSHEET).pptx
LECTURE 06 (SPREADSHEET).pptxLECTURE 06 (SPREADSHEET).pptx
LECTURE 06 (SPREADSHEET).pptx
MwangaPrayGod
 
Ch 5 displaying results
Ch 5 displaying resultsCh 5 displaying results
Ch 5 displaying results
Dr. Hina Kaynat
 

Similar to Tabulation (20)

VIPIN SINGH PRESENTATION
VIPIN SINGH PRESENTATIONVIPIN SINGH PRESENTATION
VIPIN SINGH PRESENTATION
 
Chapter 4
Chapter 4Chapter 4
Chapter 4
 
Chapter 4 - Research Parts Guide.pptx
Chapter 4 - Research Parts Guide.pptxChapter 4 - Research Parts Guide.pptx
Chapter 4 - Research Parts Guide.pptx
 
Tabulation of data-Development of Research Instrument/ Tool and Analysis
Tabulation of data-Development of Research Instrument/ Tool and Analysis Tabulation of data-Development of Research Instrument/ Tool and Analysis
Tabulation of data-Development of Research Instrument/ Tool and Analysis
 
practical research 1 chapter 4 qualitative research
practical research 1 chapter 4 qualitative researchpractical research 1 chapter 4 qualitative research
practical research 1 chapter 4 qualitative research
 
presentation of data-1.ppt MODIFIED PATEY MASTECTOMY: More commonly used. • T...
presentation of data-1.ppt MODIFIED PATEY MASTECTOMY: More commonly used. • T...presentation of data-1.ppt MODIFIED PATEY MASTECTOMY: More commonly used. • T...
presentation of data-1.ppt MODIFIED PATEY MASTECTOMY: More commonly used. • T...
 
Tabulation
TabulationTabulation
Tabulation
 
Numerical & graphical presentation of data
Numerical & graphical presentation of dataNumerical & graphical presentation of data
Numerical & graphical presentation of data
 
Displaying results APA Style
Displaying results APA Style Displaying results APA Style
Displaying results APA Style
 
Exel
ExelExel
Exel
 
TABULATION OF DATA.pptx(unit 4) (1).pptx
TABULATION OF DATA.pptx(unit 4) (1).pptxTABULATION OF DATA.pptx(unit 4) (1).pptx
TABULATION OF DATA.pptx(unit 4) (1).pptx
 
research methodology presentation-6.pptx
research methodology presentation-6.pptxresearch methodology presentation-6.pptx
research methodology presentation-6.pptx
 
Figures and tables
Figures and tables Figures and tables
Figures and tables
 
Results section my presentation
Results section my presentationResults section my presentation
Results section my presentation
 
Presentation of Data using various techniques -reserach.pptx
Presentation of Data using various techniques -reserach.pptxPresentation of Data using various techniques -reserach.pptx
Presentation of Data using various techniques -reserach.pptx
 
Guidelines of Tables - APA Style - 7th Edition
Guidelines of Tables - APA Style - 7th EditionGuidelines of Tables - APA Style - 7th Edition
Guidelines of Tables - APA Style - 7th Edition
 
Data-Presentation-and-Interpretation-in-Tabular-Graphical.pptx
Data-Presentation-and-Interpretation-in-Tabular-Graphical.pptxData-Presentation-and-Interpretation-in-Tabular-Graphical.pptx
Data-Presentation-and-Interpretation-in-Tabular-Graphical.pptx
 
The uses of Tables & graphs
The uses of Tables & graphsThe uses of Tables & graphs
The uses of Tables & graphs
 
LECTURE 06 (SPREADSHEET).pptx
LECTURE 06 (SPREADSHEET).pptxLECTURE 06 (SPREADSHEET).pptx
LECTURE 06 (SPREADSHEET).pptx
 
Ch 5 displaying results
Ch 5 displaying resultsCh 5 displaying results
Ch 5 displaying results
 

More from SoundaryaVijayakumar1

Therapeutic nutrition seminar
Therapeutic nutrition seminarTherapeutic nutrition seminar
Therapeutic nutrition seminar
SoundaryaVijayakumar1
 
Water balance ppt
Water balance pptWater balance ppt
Water balance ppt
SoundaryaVijayakumar1
 
Nutritional status of infants
Nutritional status of infantsNutritional status of infants
Nutritional status of infants
SoundaryaVijayakumar1
 
Fats and oils mp
Fats and oils mpFats and oils mp
Fats and oils mp
SoundaryaVijayakumar1
 
Pancreatic disorders
Pancreatic disordersPancreatic disorders
Pancreatic disorders
SoundaryaVijayakumar1
 
Bioactivity of functional foods and neutraceuticals
Bioactivity of functional foods and neutraceuticalsBioactivity of functional foods and neutraceuticals
Bioactivity of functional foods and neutraceuticals
SoundaryaVijayakumar1
 

More from SoundaryaVijayakumar1 (6)

Therapeutic nutrition seminar
Therapeutic nutrition seminarTherapeutic nutrition seminar
Therapeutic nutrition seminar
 
Water balance ppt
Water balance pptWater balance ppt
Water balance ppt
 
Nutritional status of infants
Nutritional status of infantsNutritional status of infants
Nutritional status of infants
 
Fats and oils mp
Fats and oils mpFats and oils mp
Fats and oils mp
 
Pancreatic disorders
Pancreatic disordersPancreatic disorders
Pancreatic disorders
 
Bioactivity of functional foods and neutraceuticals
Bioactivity of functional foods and neutraceuticalsBioactivity of functional foods and neutraceuticals
Bioactivity of functional foods and neutraceuticals
 

Recently uploaded

A Independência da América Espanhola LAPBOOK.pdf
A Independência da América Espanhola LAPBOOK.pdfA Independência da América Espanhola LAPBOOK.pdf
A Independência da América Espanhola LAPBOOK.pdf
Jean Carlos Nunes Paixão
 
DRUGS AND ITS classification slide share
DRUGS AND ITS classification slide shareDRUGS AND ITS classification slide share
DRUGS AND ITS classification slide share
taiba qazi
 
Assignment_4_ArianaBusciglio Marvel(1).docx
Assignment_4_ArianaBusciglio Marvel(1).docxAssignment_4_ArianaBusciglio Marvel(1).docx
Assignment_4_ArianaBusciglio Marvel(1).docx
ArianaBusciglio
 
Aficamten in HCM (SEQUOIA HCM TRIAL 2024)
Aficamten in HCM (SEQUOIA HCM TRIAL 2024)Aficamten in HCM (SEQUOIA HCM TRIAL 2024)
Aficamten in HCM (SEQUOIA HCM TRIAL 2024)
Ashish Kohli
 
Natural birth techniques - Mrs.Akanksha Trivedi Rama University
Natural birth techniques - Mrs.Akanksha Trivedi Rama UniversityNatural birth techniques - Mrs.Akanksha Trivedi Rama University
Natural birth techniques - Mrs.Akanksha Trivedi Rama University
Akanksha trivedi rama nursing college kanpur.
 
How to Build a Module in Odoo 17 Using the Scaffold Method
How to Build a Module in Odoo 17 Using the Scaffold MethodHow to Build a Module in Odoo 17 Using the Scaffold Method
How to Build a Module in Odoo 17 Using the Scaffold Method
Celine George
 
CACJapan - GROUP Presentation 1- Wk 4.pdf
CACJapan - GROUP Presentation 1- Wk 4.pdfCACJapan - GROUP Presentation 1- Wk 4.pdf
CACJapan - GROUP Presentation 1- Wk 4.pdf
camakaiclarkmusic
 
A Strategic Approach: GenAI in Education
A Strategic Approach: GenAI in EducationA Strategic Approach: GenAI in Education
A Strategic Approach: GenAI in Education
Peter Windle
 
MATATAG CURRICULUM: ASSESSING THE READINESS OF ELEM. PUBLIC SCHOOL TEACHERS I...
MATATAG CURRICULUM: ASSESSING THE READINESS OF ELEM. PUBLIC SCHOOL TEACHERS I...MATATAG CURRICULUM: ASSESSING THE READINESS OF ELEM. PUBLIC SCHOOL TEACHERS I...
MATATAG CURRICULUM: ASSESSING THE READINESS OF ELEM. PUBLIC SCHOOL TEACHERS I...
NelTorrente
 
ANATOMY AND BIOMECHANICS OF HIP JOINT.pdf
ANATOMY AND BIOMECHANICS OF HIP JOINT.pdfANATOMY AND BIOMECHANICS OF HIP JOINT.pdf
ANATOMY AND BIOMECHANICS OF HIP JOINT.pdf
Priyankaranawat4
 
The basics of sentences session 6pptx.pptx
The basics of sentences session 6pptx.pptxThe basics of sentences session 6pptx.pptx
The basics of sentences session 6pptx.pptx
heathfieldcps1
 
Lapbook sobre os Regimes Totalitários.pdf
Lapbook sobre os Regimes Totalitários.pdfLapbook sobre os Regimes Totalitários.pdf
Lapbook sobre os Regimes Totalitários.pdf
Jean Carlos Nunes Paixão
 
June 3, 2024 Anti-Semitism Letter Sent to MIT President Kornbluth and MIT Cor...
June 3, 2024 Anti-Semitism Letter Sent to MIT President Kornbluth and MIT Cor...June 3, 2024 Anti-Semitism Letter Sent to MIT President Kornbluth and MIT Cor...
June 3, 2024 Anti-Semitism Letter Sent to MIT President Kornbluth and MIT Cor...
Levi Shapiro
 
writing about opinions about Australia the movie
writing about opinions about Australia the moviewriting about opinions about Australia the movie
writing about opinions about Australia the movie
Nicholas Montgomery
 
The History of Stoke Newington Street Names
The History of Stoke Newington Street NamesThe History of Stoke Newington Street Names
The History of Stoke Newington Street Names
History of Stoke Newington
 
How to Manage Your Lost Opportunities in Odoo 17 CRM
How to Manage Your Lost Opportunities in Odoo 17 CRMHow to Manage Your Lost Opportunities in Odoo 17 CRM
How to Manage Your Lost Opportunities in Odoo 17 CRM
Celine George
 
Introduction to AI for Nonprofits with Tapp Network
Introduction to AI for Nonprofits with Tapp NetworkIntroduction to AI for Nonprofits with Tapp Network
Introduction to AI for Nonprofits with Tapp Network
TechSoup
 
Chapter 4 - Islamic Financial Institutions in Malaysia.pptx
Chapter 4 - Islamic Financial Institutions in Malaysia.pptxChapter 4 - Islamic Financial Institutions in Malaysia.pptx
Chapter 4 - Islamic Financial Institutions in Malaysia.pptx
Mohd Adib Abd Muin, Senior Lecturer at Universiti Utara Malaysia
 
Pride Month Slides 2024 David Douglas School District
Pride Month Slides 2024 David Douglas School DistrictPride Month Slides 2024 David Douglas School District
Pride Month Slides 2024 David Douglas School District
David Douglas School District
 
Main Java[All of the Base Concepts}.docx
Main Java[All of the Base Concepts}.docxMain Java[All of the Base Concepts}.docx
Main Java[All of the Base Concepts}.docx
adhitya5119
 

Recently uploaded (20)

A Independência da América Espanhola LAPBOOK.pdf
A Independência da América Espanhola LAPBOOK.pdfA Independência da América Espanhola LAPBOOK.pdf
A Independência da América Espanhola LAPBOOK.pdf
 
DRUGS AND ITS classification slide share
DRUGS AND ITS classification slide shareDRUGS AND ITS classification slide share
DRUGS AND ITS classification slide share
 
Assignment_4_ArianaBusciglio Marvel(1).docx
Assignment_4_ArianaBusciglio Marvel(1).docxAssignment_4_ArianaBusciglio Marvel(1).docx
Assignment_4_ArianaBusciglio Marvel(1).docx
 
Aficamten in HCM (SEQUOIA HCM TRIAL 2024)
Aficamten in HCM (SEQUOIA HCM TRIAL 2024)Aficamten in HCM (SEQUOIA HCM TRIAL 2024)
Aficamten in HCM (SEQUOIA HCM TRIAL 2024)
 
Natural birth techniques - Mrs.Akanksha Trivedi Rama University
Natural birth techniques - Mrs.Akanksha Trivedi Rama UniversityNatural birth techniques - Mrs.Akanksha Trivedi Rama University
Natural birth techniques - Mrs.Akanksha Trivedi Rama University
 
How to Build a Module in Odoo 17 Using the Scaffold Method
How to Build a Module in Odoo 17 Using the Scaffold MethodHow to Build a Module in Odoo 17 Using the Scaffold Method
How to Build a Module in Odoo 17 Using the Scaffold Method
 
CACJapan - GROUP Presentation 1- Wk 4.pdf
CACJapan - GROUP Presentation 1- Wk 4.pdfCACJapan - GROUP Presentation 1- Wk 4.pdf
CACJapan - GROUP Presentation 1- Wk 4.pdf
 
A Strategic Approach: GenAI in Education
A Strategic Approach: GenAI in EducationA Strategic Approach: GenAI in Education
A Strategic Approach: GenAI in Education
 
MATATAG CURRICULUM: ASSESSING THE READINESS OF ELEM. PUBLIC SCHOOL TEACHERS I...
MATATAG CURRICULUM: ASSESSING THE READINESS OF ELEM. PUBLIC SCHOOL TEACHERS I...MATATAG CURRICULUM: ASSESSING THE READINESS OF ELEM. PUBLIC SCHOOL TEACHERS I...
MATATAG CURRICULUM: ASSESSING THE READINESS OF ELEM. PUBLIC SCHOOL TEACHERS I...
 
ANATOMY AND BIOMECHANICS OF HIP JOINT.pdf
ANATOMY AND BIOMECHANICS OF HIP JOINT.pdfANATOMY AND BIOMECHANICS OF HIP JOINT.pdf
ANATOMY AND BIOMECHANICS OF HIP JOINT.pdf
 
The basics of sentences session 6pptx.pptx
The basics of sentences session 6pptx.pptxThe basics of sentences session 6pptx.pptx
The basics of sentences session 6pptx.pptx
 
Lapbook sobre os Regimes Totalitários.pdf
Lapbook sobre os Regimes Totalitários.pdfLapbook sobre os Regimes Totalitários.pdf
Lapbook sobre os Regimes Totalitários.pdf
 
June 3, 2024 Anti-Semitism Letter Sent to MIT President Kornbluth and MIT Cor...
June 3, 2024 Anti-Semitism Letter Sent to MIT President Kornbluth and MIT Cor...June 3, 2024 Anti-Semitism Letter Sent to MIT President Kornbluth and MIT Cor...
June 3, 2024 Anti-Semitism Letter Sent to MIT President Kornbluth and MIT Cor...
 
writing about opinions about Australia the movie
writing about opinions about Australia the moviewriting about opinions about Australia the movie
writing about opinions about Australia the movie
 
The History of Stoke Newington Street Names
The History of Stoke Newington Street NamesThe History of Stoke Newington Street Names
The History of Stoke Newington Street Names
 
How to Manage Your Lost Opportunities in Odoo 17 CRM
How to Manage Your Lost Opportunities in Odoo 17 CRMHow to Manage Your Lost Opportunities in Odoo 17 CRM
How to Manage Your Lost Opportunities in Odoo 17 CRM
 
Introduction to AI for Nonprofits with Tapp Network
Introduction to AI for Nonprofits with Tapp NetworkIntroduction to AI for Nonprofits with Tapp Network
Introduction to AI for Nonprofits with Tapp Network
 
Chapter 4 - Islamic Financial Institutions in Malaysia.pptx
Chapter 4 - Islamic Financial Institutions in Malaysia.pptxChapter 4 - Islamic Financial Institutions in Malaysia.pptx
Chapter 4 - Islamic Financial Institutions in Malaysia.pptx
 
Pride Month Slides 2024 David Douglas School District
Pride Month Slides 2024 David Douglas School DistrictPride Month Slides 2024 David Douglas School District
Pride Month Slides 2024 David Douglas School District
 
Main Java[All of the Base Concepts}.docx
Main Java[All of the Base Concepts}.docxMain Java[All of the Base Concepts}.docx
Main Java[All of the Base Concepts}.docx
 

Tabulation

  • 1.
  • 2. Orderly arrangement of data in columns and rows conserves space Comparison summation of items detection of errors and omissions  statistical computations
  • 3. Clear, concise and adequate title. Distinct number to facilitate reference Column headings and row headings of table should be clear and brief. Units of measurement under each heading or subheading must always be indicated. Explanatory footnotes –beneath the table Source-just below the table. Abbreviation, ditto should be avoided
  • 4. To carry out investigation To do comparison To locate omissions and errors in the data. To use space economically To simplify data To use it as future reference Importance of Tabulation Under tabulation, data is divided into various parts and for each part there are totals and sub totals. Therefore, relationship between different parts can be easily known. Since data are arranged in a table with a title and a number so these can be easily identified and used for the required purpose Tabulation makes the data brief. Therefore, it can be easily presented in the form of graphs. Tabulation presents the numerical figures in an attractive form.
  • 5. Simple tabulation Simple tabulation is when the data are tabulated to one characteristic. For example, the survey that determined the frequency or number of employees of a firm owning different brands of mobile phones like Blackberry, Nokia, I phone, etc. Double tabulation Double tabulation is when two characteristics of data are tabulated. For example, frequency or number of male and female employees in the firm owning different brand of mobile phones like Blackberry, Nokia, Iphone, etc. Complex tabulation Complex tabulation of data that includes more than two characteristics. For example, frequency or number of male, female and the total employees owning different brand of mobile phones like Blackberry, Nokia, I phone, etc. Cross tabulations, is also a sub-type of complex tabulation that includes cross-classifying factors to build a contingency table of counts or frequencies at each combination of factor levels. A contingency table is a display format used to analyze and record the possible relationship between two or more categorical variables
  • 6. There are no hard and fast rules for the tabulation of data but for constructing good table, following general rules should be observed while tabulating statistical data. • The table should suit the size of the paper and, therefore, the width of the column should be decided before hand. • Number of columns and rows should neither be too large nor too small. • As far as possible figures should be approximated before tabulation. This would reduce unnecessary details. Items should be arranged either in alphabetical, chronological or geographical order or according to size. • The sub-total and total of the items of the table must be written. • Percentages are given in the tables if necessary. • Ditto marks should not be used in a table because sometimes it create confusion. • Table should be simple and attractive. • A table should be logical, well-balanced in length and breadth and the comparable columns should be placed side by side. • Light/heavy/thick or double rulings may be used to distinguish sub columns, main columns and totals. • For large data more than one table may be used.
  • 7. Title as compatible with the objective of the study To facilitate comparison. Ideal Size Stubs Use of Zero Abbreviation Footnote Total Source of data Size of Columns Simple, Economical and Attractive
  • 8.
  • 9. Table number: A number must be allotted to the table for identification, particularly when there are many tables in a study. Title: The title should explain what is contained in the table. It should be clear, brief and set in bold type on top of the table. It should also indicate the time and place to which the data refer. Parts of an Ideal Table Date: The date of preparation of the table should be given. Stubs or Row designations: Each row of the table should be given a brief heading. Such designations of rows are called “stubs”, or, “stub items” and the entire column is called “stub column”.
  • 10. Column headings or Captions: Column designation is given on top of each column to explain to what the figures in the column refer. It should be clear and precise. This is called a “caption”, or, “heading”. columns should be numbered if there are four, or, more columns. Body of the table: The data should be arranged in such a way that any figure can be located easily. Various types of numerical variables should be arranged in an ascending order, i.e., from left to right in rows and from top to bottom in columns. Column and row totals should be given. Source: At the bottom of the table a note should be added indicating the primary and secondary sources from which data have been collected. Footnotes and references: If any item has not been explained properly, a separate explanatory note should be added at the bottom of the table.