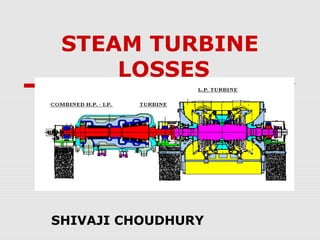
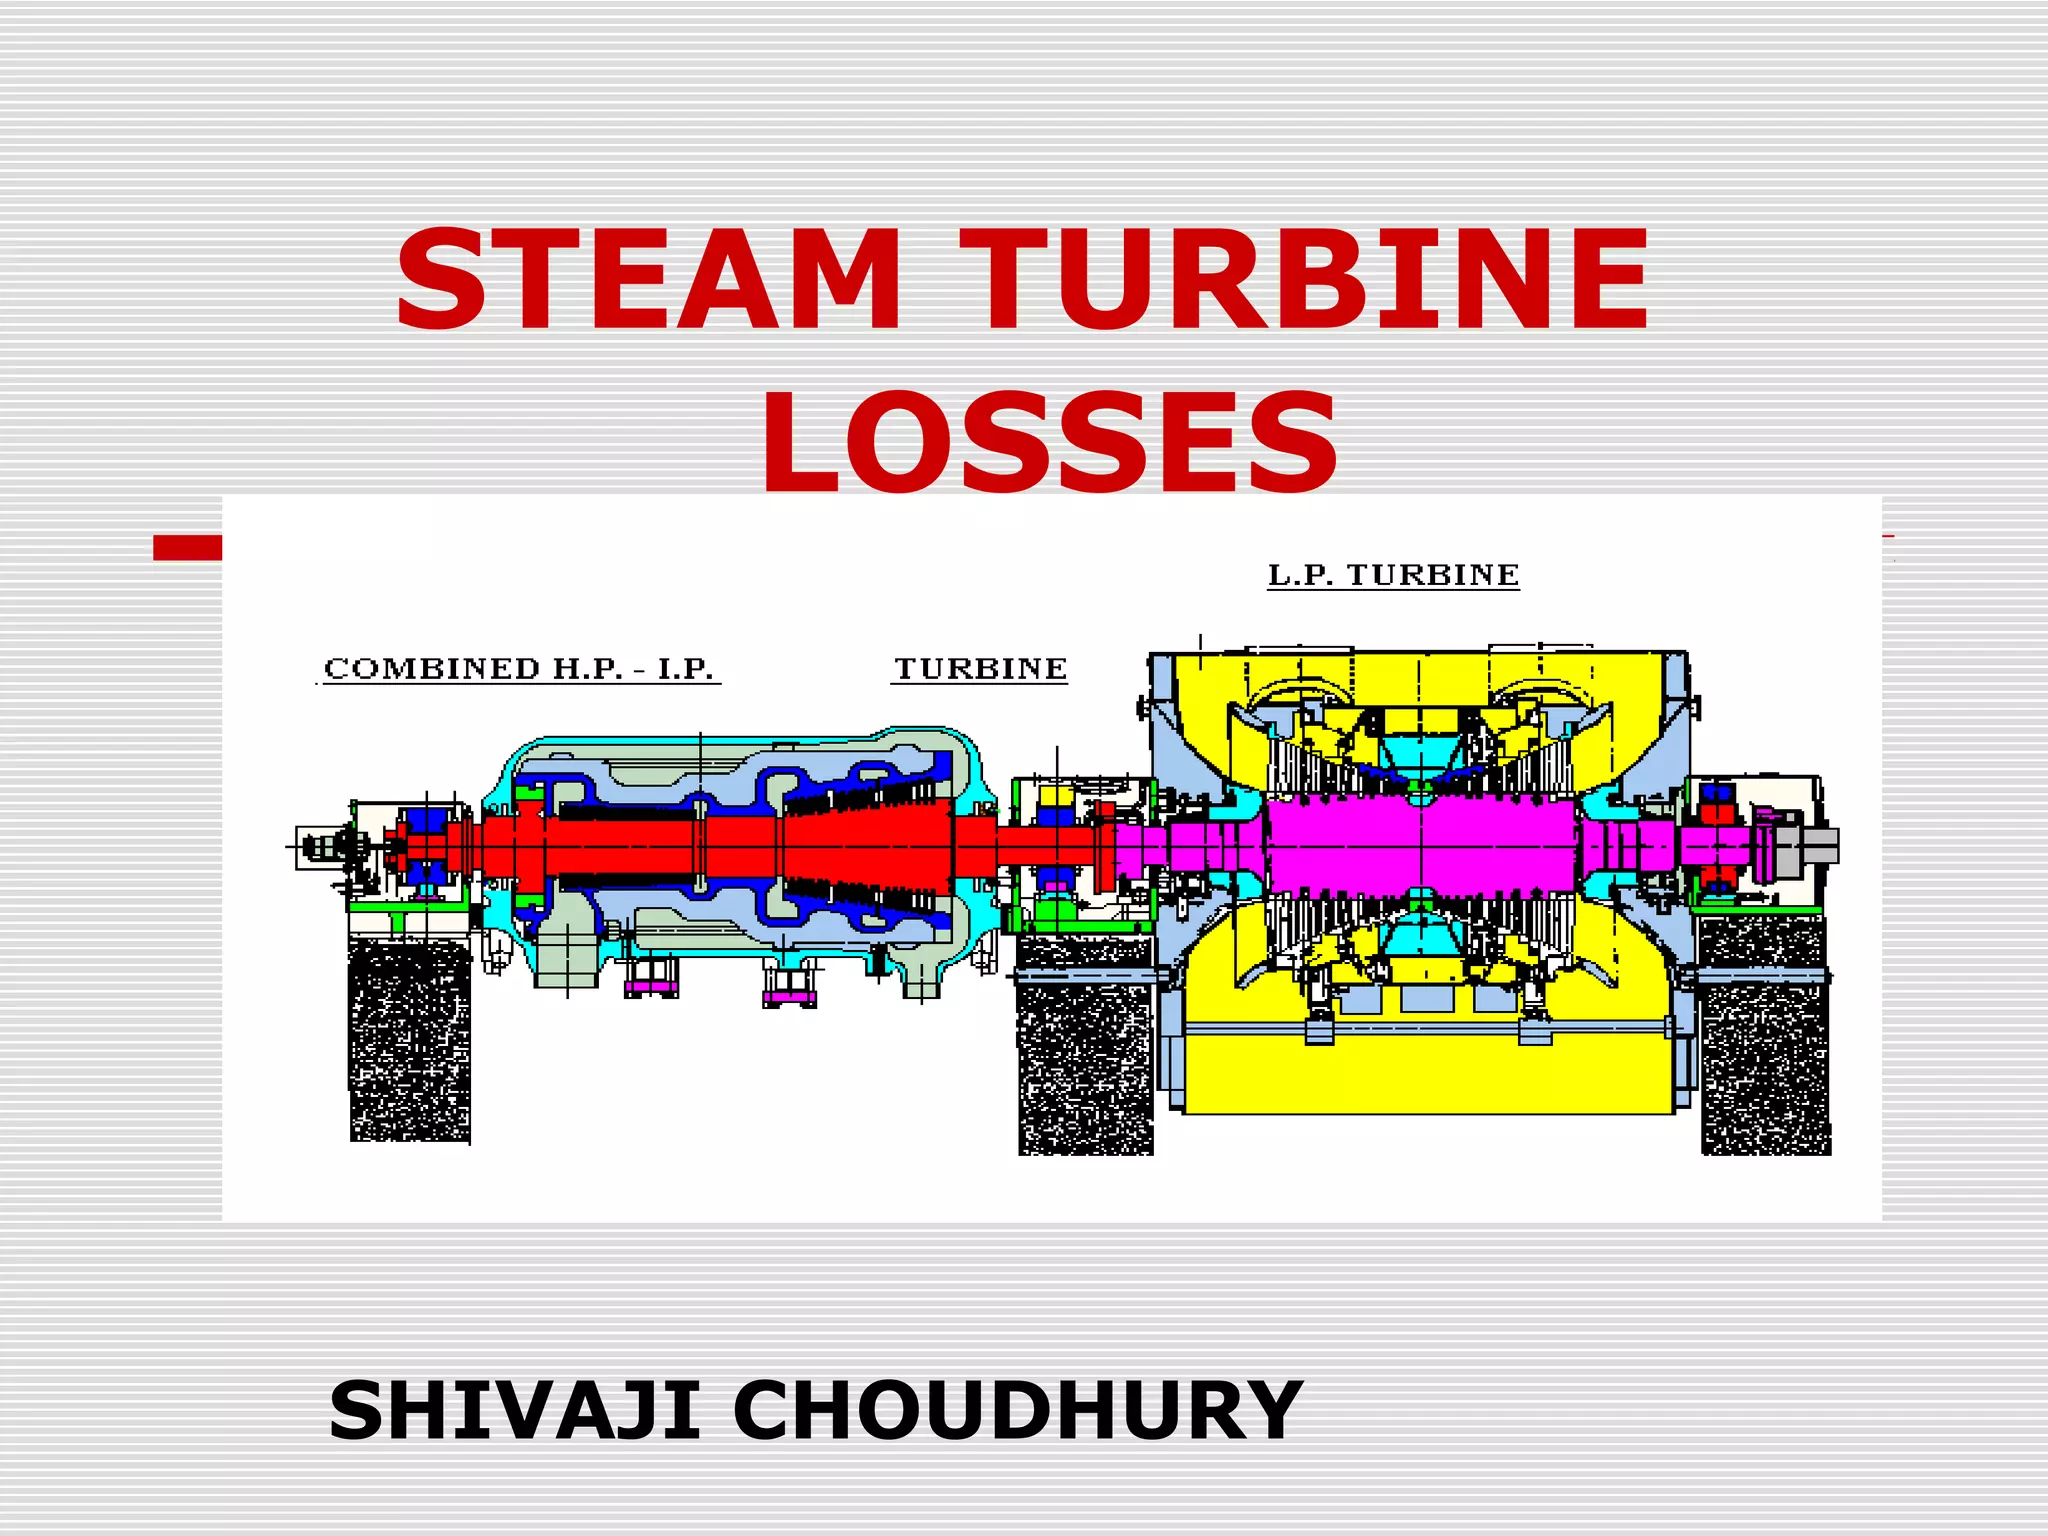
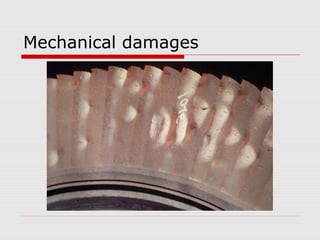
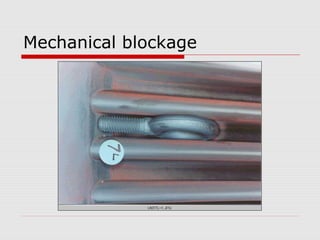
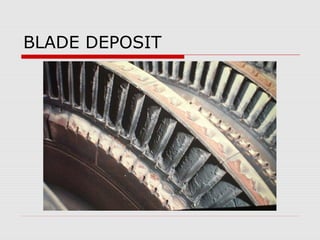
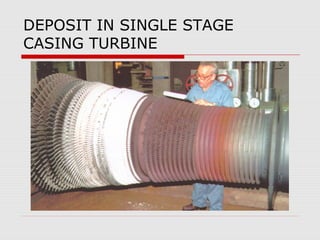
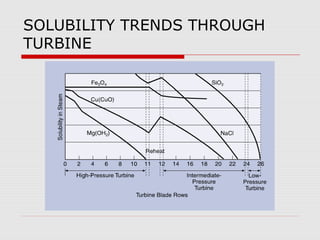
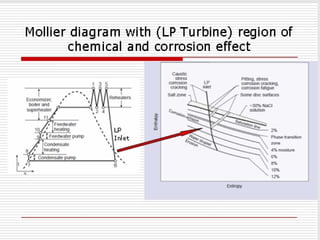
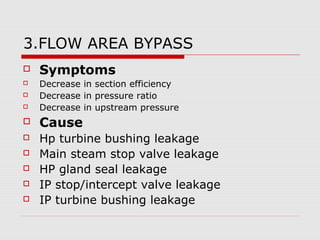
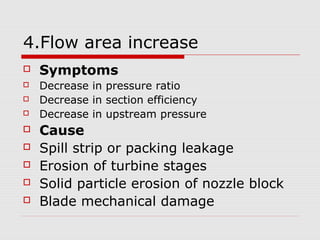
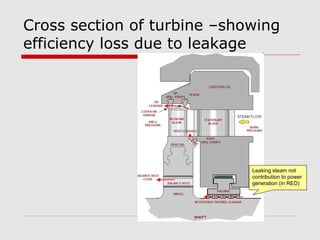
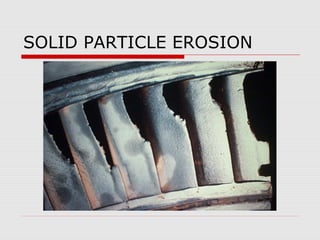
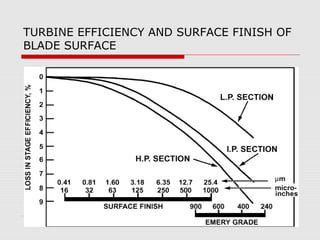
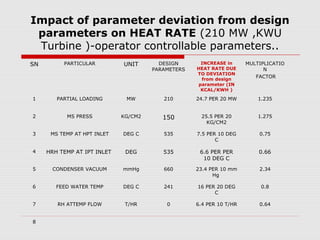
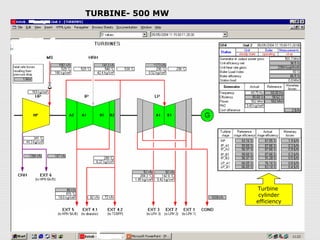
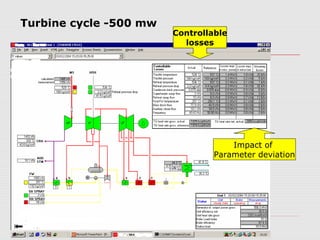
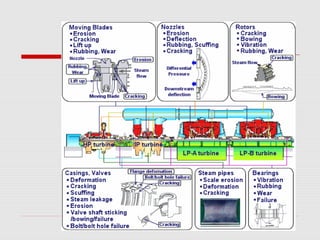
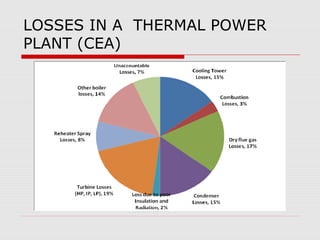
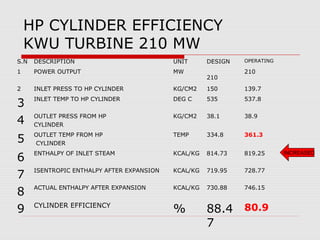
STEAM TURBINE
LOSSES
SHIVAJI CHOUDHURY
Challenges
 Rising fuel costs which in most of
power generating companies are
passed through to customer ,caught
the attention to regulating agencies.
 Regulating agencies are now paying
more attention to efficiency of power
plants.
Heat Rate Definitions
 Heat rate is defined in units of
kJ/kWh and is simply the amount of
heat input into a system divided by
the amount of power generated by a
system.
 Less heat rate (less fuel) means more
efficient system.
BENEFIT -identification of losses
 Efficiency increase
 Green house gases emission decrease
 Particulate emission reduction
 Availability improvement
 Reduction in O&M cost
 Less capacity addition
 Increase profitability
Steam Turbine losses
 Symptoms
 HP/IP/LP section efficiency less than
design.
 Causes (any one or more than one)
 Change in internal conditions of turbine
 1.Mechanical damages
 2.Flow area decreases
 3.Flow area bypass
 4.Flow area increases
 Change in inlet conditions
1.MECHANICAL DAMAGES
 Symptoms
 Sudden change in section efficiency.
 Sudden change in section pressure ratio.
 Cause
 Metallurgical defects.
 Maintenance practice.
Mechanical damages
2.FLOW AREA DECREASE
 Symptoms
 Increase in pressure ratio
 Decrease in section efficiency
 Increase in up stream pressure
 cause
 Mechanical blockage
 Sudden increase in pressure ratio
 Sudden decrease in section efficiency
 Sudden increase in up stream pressure
 Blade deposits
 Gradual increase in pressure ratio
 Gradual decrease in section efficiency
 Gradual increase in upstream pressure
Mechanical blockage
BLADE DEPOSIT
DEPOSIT IN SINGLE STAGE
CASING TURBINE
SOLUBILITY TRENDS THROUGH
TURBINE
3.FLOW AREA BYPASS
 Symptoms
 Decrease in section efficiency
 Decrease in pressure ratio
 Decrease in upstream pressure
 Cause
 Hp turbine bushing leakage
 Main steam stop valve leakage
 HP gland seal leakage
 IP stop/intercept valve leakage
 IP turbine bushing leakage
4.Flow area increase
 Symptoms
 Decrease in pressure ratio
 Decrease in section efficiency
 Decrease in upstream pressure
 Cause
 Spill strip or packing leakage
 Erosion of turbine stages
 Solid particle erosion of nozzle block
 Blade mechanical damage
Spill strip or packing leakage
 Symptoms
 Increased down stream extraction temperatures
 Sudden decrease in stage efficiency
 Cause
 Thermal stress
 Rubbing
 Vibration
 Operating procedures
Solid particle erosion of nozzle
blocks
 Symptoms
 Increase in pressure down stream of first
stage
 Increase in ratio of first stage to throttle pressure
 Cause
 Cycling
 Exfoliation in boiler tubes
1. Condenser tube leak
2. Poor water chemistry
Erosion of turbine stages
 Symptoms
 Gradual decrease in pressure ratio
 Gradual decrease in section efficiency
 Gradual decrease in upstream
pressure
Blade mechanical damages
 Symptoms
 Sudden decrease in pressure ratio
 Sudden decrease in section efficiency
 Sudden decrease in upstream
pressure.
Cross section of turbine –showing
efficiency loss due to leakage
Leaking steam not
contribution to power
generation (in RED)
SOLID PARTICLE EROSION
TURBINE EFFICIENCY AND SURFACE FINISH OF
BLADE SURFACE
Impact of parameter deviation from design
parameters on HEAT RATE (210 MW ,KWU
Turbine )-operator controllable parameters..
SN PARTICULAR UNIT DESIGN
PARAMETERS
INCREASE in
HEAT RATE DUE
TO DEVIATION
from design
parameter (IN
KCAL/KWH )
MULTIPLICATIO
N
FACTOR
1 PARTIAL LOADING MW 210 24.7 PER 20 MW 1.235
2 MS PRESS KG/CM2 150 25.5 PER 20
KG/CM2
1.275
3 MS TEMP AT HPT INLET DEG C 535 7.5 PER 10 DEG
C
0.75
4 HRH TEMP AT IPT INLET DEG 535 6.6 PER PER
10 DEG C
0.66
5 CONDENSER VACUUM mmHg 660 23.4 PER 10 mm
Hg
2.34
6 FEED WATER TEMP DEG C 241 16 PER 20 DEG
C
0.8
7 RH ATTEMP FLOW T/HR 0 6.4 PER 10 T/HR 0.64
8
Turbine
cylinder
efficiency
TURBINE- 500 MW
Turbine cycle -500 mw
Controllable
losses
Impact of
Parameter deviation
LOSSES IN A THERMAL POWER
PLANT (CEA)
HP CYLINDER EFFICIENCY
KWU TURBINE 210 MW
S.N DESCRIPTION UNIT DESIGN OPERATING
1 POWER OUTPUT MW
210
210
2 INLET PRESS TO HP CYLINDER KG/CM2 150 139.7
3
INLET TEMP TO HP CYLINDER DEG C 535 537.8
4
OUTLET PRESS FROM HP
CYLINDER
KG/CM2 38.1 38.9
5
OUTLET TEMP FROM HP
CYLINDER
TEMP 334.8 361.3
6
ENTHALPY OF INLET STEAM KCAL/KG 814.73 819.25
7
ISENTROPIC ENTHALPY AFTER EXPANSION KCAL/KG 719.95 728.77
8
ACTUAL ENTHALPY AFTER EXPANSION KCAL/KG 730.88 746.15
9 CYLINDER EFFICIENCY
% 88.4
7
80.9
INCREASED
THANKING YOU

Steam turbine losses

  • 1.
  • 2.
    Challenges  Rising fuelcosts which in most of power generating companies are passed through to customer ,caught the attention to regulating agencies.  Regulating agencies are now paying more attention to efficiency of power plants.
  • 3.
    Heat Rate Definitions Heat rate is defined in units of kJ/kWh and is simply the amount of heat input into a system divided by the amount of power generated by a system.  Less heat rate (less fuel) means more efficient system.
  • 4.
    BENEFIT -identification oflosses  Efficiency increase  Green house gases emission decrease  Particulate emission reduction  Availability improvement  Reduction in O&M cost  Less capacity addition  Increase profitability
  • 5.
    Steam Turbine losses Symptoms  HP/IP/LP section efficiency less than design.  Causes (any one or more than one)  Change in internal conditions of turbine  1.Mechanical damages  2.Flow area decreases  3.Flow area bypass  4.Flow area increases  Change in inlet conditions
  • 6.
    1.MECHANICAL DAMAGES  Symptoms Sudden change in section efficiency.  Sudden change in section pressure ratio.  Cause  Metallurgical defects.  Maintenance practice.
  • 7.
  • 8.
    2.FLOW AREA DECREASE Symptoms  Increase in pressure ratio  Decrease in section efficiency  Increase in up stream pressure  cause  Mechanical blockage  Sudden increase in pressure ratio  Sudden decrease in section efficiency  Sudden increase in up stream pressure  Blade deposits  Gradual increase in pressure ratio  Gradual decrease in section efficiency  Gradual increase in upstream pressure
  • 9.
  • 10.
  • 11.
    DEPOSIT IN SINGLESTAGE CASING TURBINE
  • 12.
  • 14.
    3.FLOW AREA BYPASS Symptoms  Decrease in section efficiency  Decrease in pressure ratio  Decrease in upstream pressure  Cause  Hp turbine bushing leakage  Main steam stop valve leakage  HP gland seal leakage  IP stop/intercept valve leakage  IP turbine bushing leakage
  • 15.
    4.Flow area increase Symptoms  Decrease in pressure ratio  Decrease in section efficiency  Decrease in upstream pressure  Cause  Spill strip or packing leakage  Erosion of turbine stages  Solid particle erosion of nozzle block  Blade mechanical damage
  • 16.
    Spill strip orpacking leakage  Symptoms  Increased down stream extraction temperatures  Sudden decrease in stage efficiency  Cause  Thermal stress  Rubbing  Vibration  Operating procedures
  • 17.
    Solid particle erosionof nozzle blocks  Symptoms  Increase in pressure down stream of first stage  Increase in ratio of first stage to throttle pressure  Cause  Cycling  Exfoliation in boiler tubes 1. Condenser tube leak 2. Poor water chemistry
  • 18.
    Erosion of turbinestages  Symptoms  Gradual decrease in pressure ratio  Gradual decrease in section efficiency  Gradual decrease in upstream pressure
  • 19.
    Blade mechanical damages Symptoms  Sudden decrease in pressure ratio  Sudden decrease in section efficiency  Sudden decrease in upstream pressure.
  • 20.
    Cross section ofturbine –showing efficiency loss due to leakage Leaking steam not contribution to power generation (in RED)
  • 21.
  • 22.
    TURBINE EFFICIENCY ANDSURFACE FINISH OF BLADE SURFACE
  • 23.
    Impact of parameterdeviation from design parameters on HEAT RATE (210 MW ,KWU Turbine )-operator controllable parameters.. SN PARTICULAR UNIT DESIGN PARAMETERS INCREASE in HEAT RATE DUE TO DEVIATION from design parameter (IN KCAL/KWH ) MULTIPLICATIO N FACTOR 1 PARTIAL LOADING MW 210 24.7 PER 20 MW 1.235 2 MS PRESS KG/CM2 150 25.5 PER 20 KG/CM2 1.275 3 MS TEMP AT HPT INLET DEG C 535 7.5 PER 10 DEG C 0.75 4 HRH TEMP AT IPT INLET DEG 535 6.6 PER PER 10 DEG C 0.66 5 CONDENSER VACUUM mmHg 660 23.4 PER 10 mm Hg 2.34 6 FEED WATER TEMP DEG C 241 16 PER 20 DEG C 0.8 7 RH ATTEMP FLOW T/HR 0 6.4 PER 10 T/HR 0.64 8
  • 24.
  • 25.
    Turbine cycle -500mw Controllable losses Impact of Parameter deviation
  • 27.
    LOSSES IN ATHERMAL POWER PLANT (CEA)
  • 28.
    HP CYLINDER EFFICIENCY KWUTURBINE 210 MW S.N DESCRIPTION UNIT DESIGN OPERATING 1 POWER OUTPUT MW 210 210 2 INLET PRESS TO HP CYLINDER KG/CM2 150 139.7 3 INLET TEMP TO HP CYLINDER DEG C 535 537.8 4 OUTLET PRESS FROM HP CYLINDER KG/CM2 38.1 38.9 5 OUTLET TEMP FROM HP CYLINDER TEMP 334.8 361.3 6 ENTHALPY OF INLET STEAM KCAL/KG 814.73 819.25 7 ISENTROPIC ENTHALPY AFTER EXPANSION KCAL/KG 719.95 728.77 8 ACTUAL ENTHALPY AFTER EXPANSION KCAL/KG 730.88 746.15 9 CYLINDER EFFICIENCY % 88.4 7 80.9 INCREASED
  • 29.