Download as PDF, PPTX
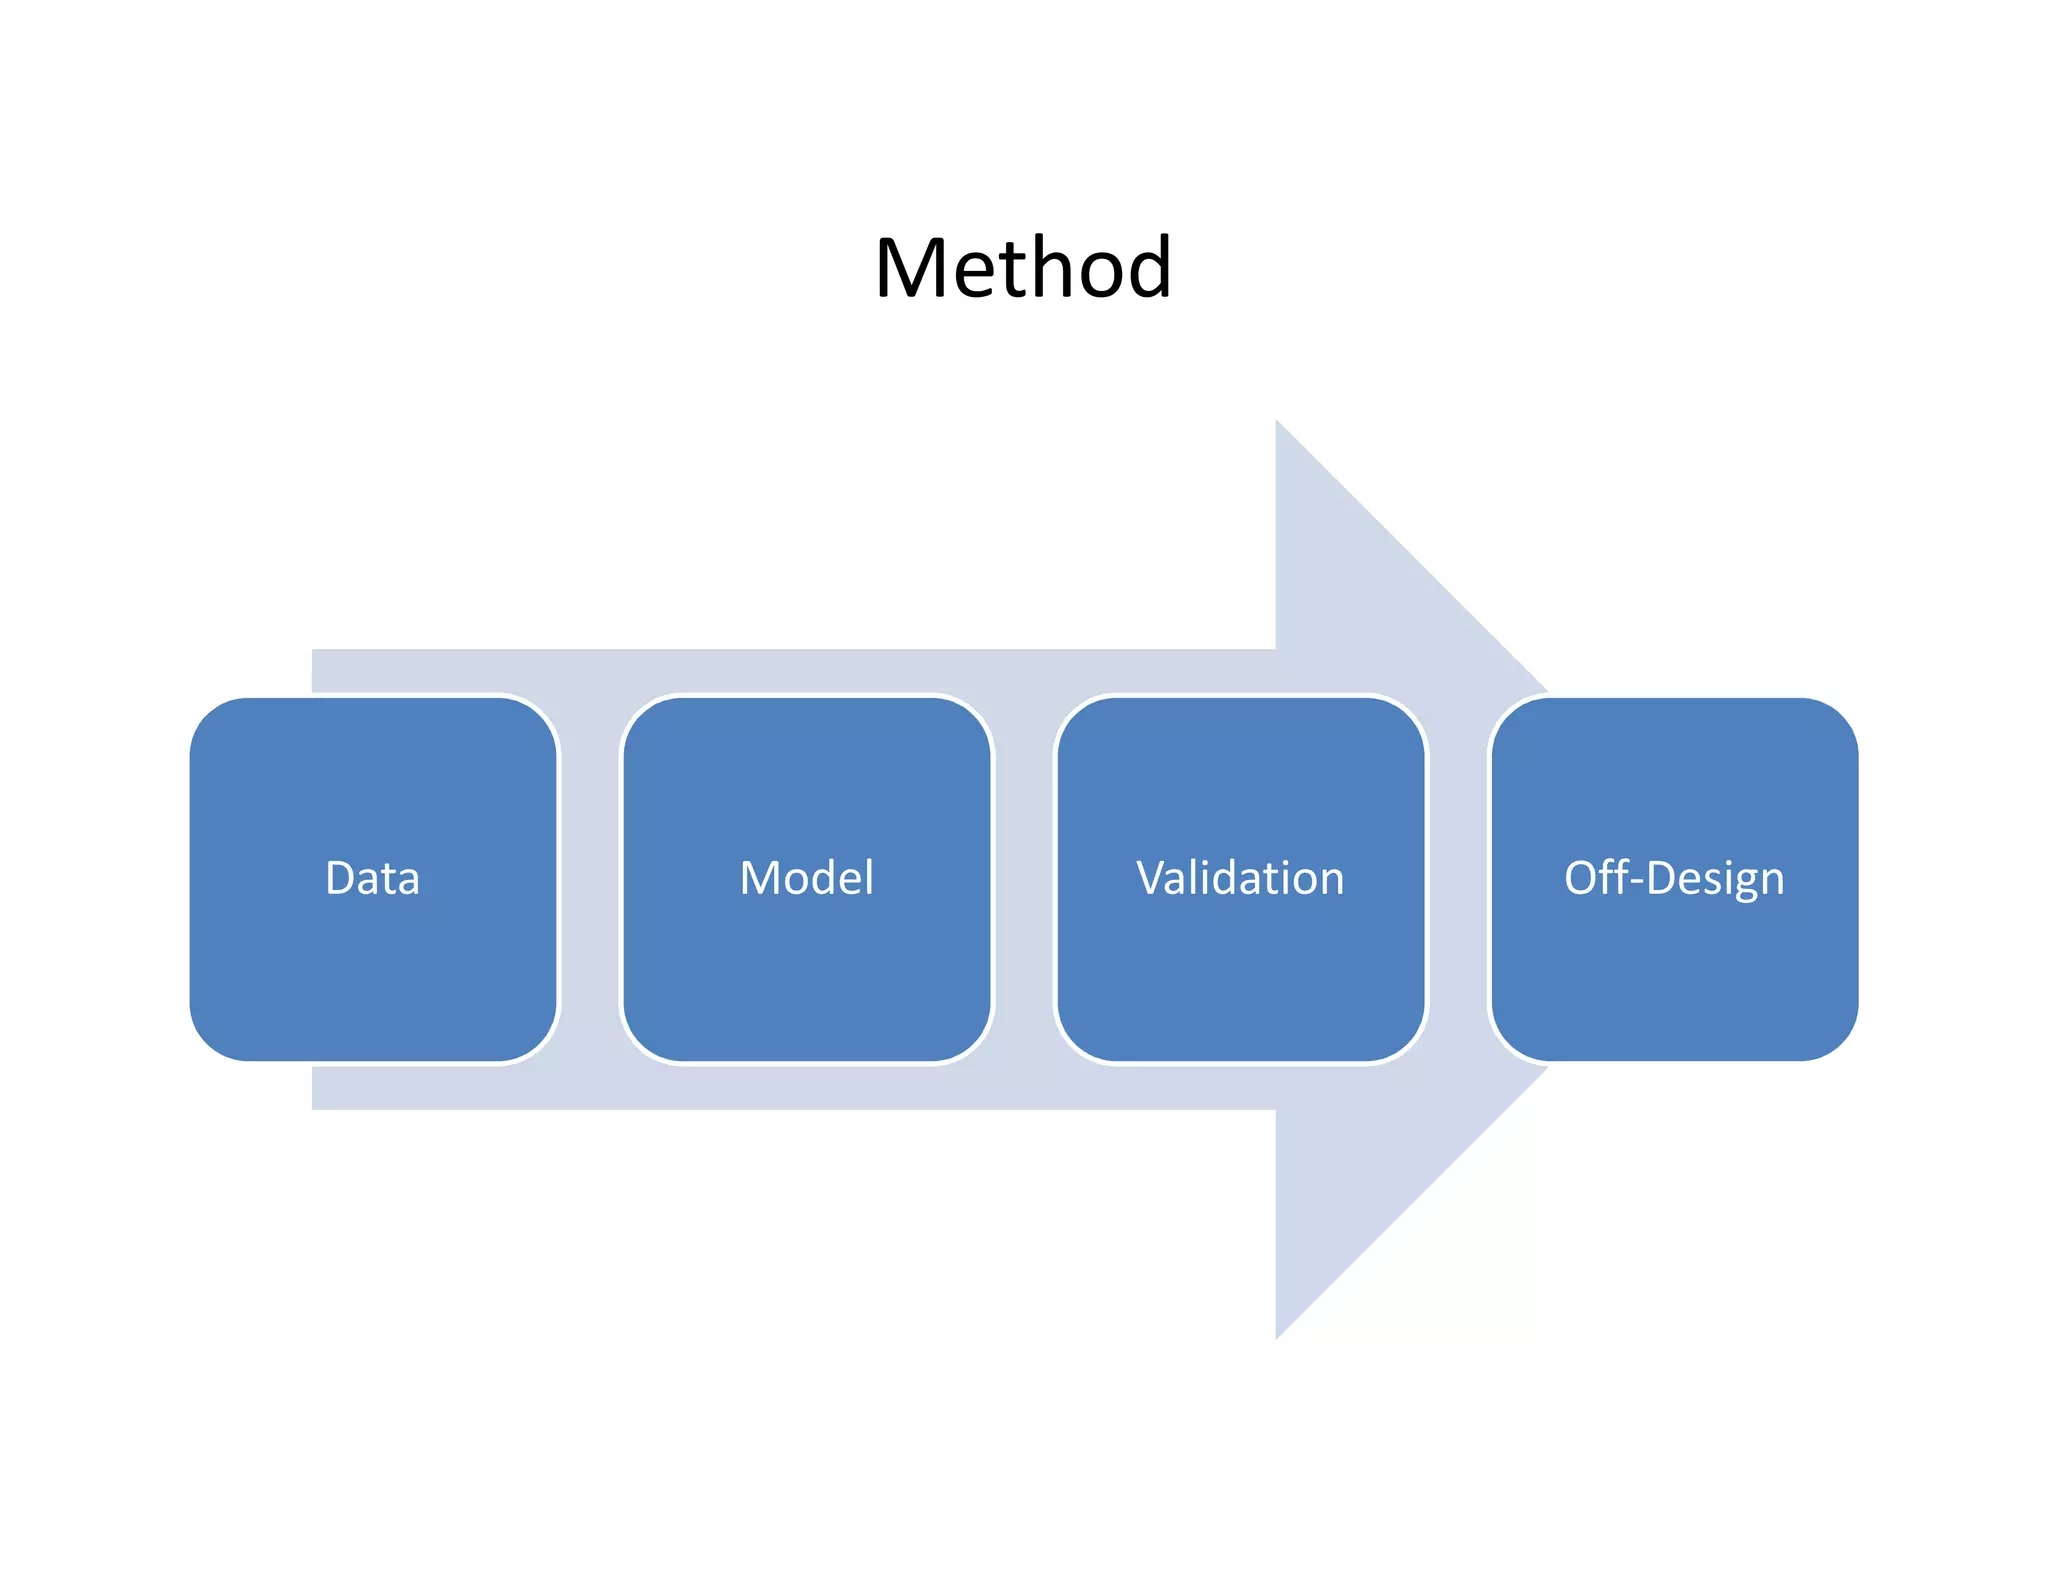
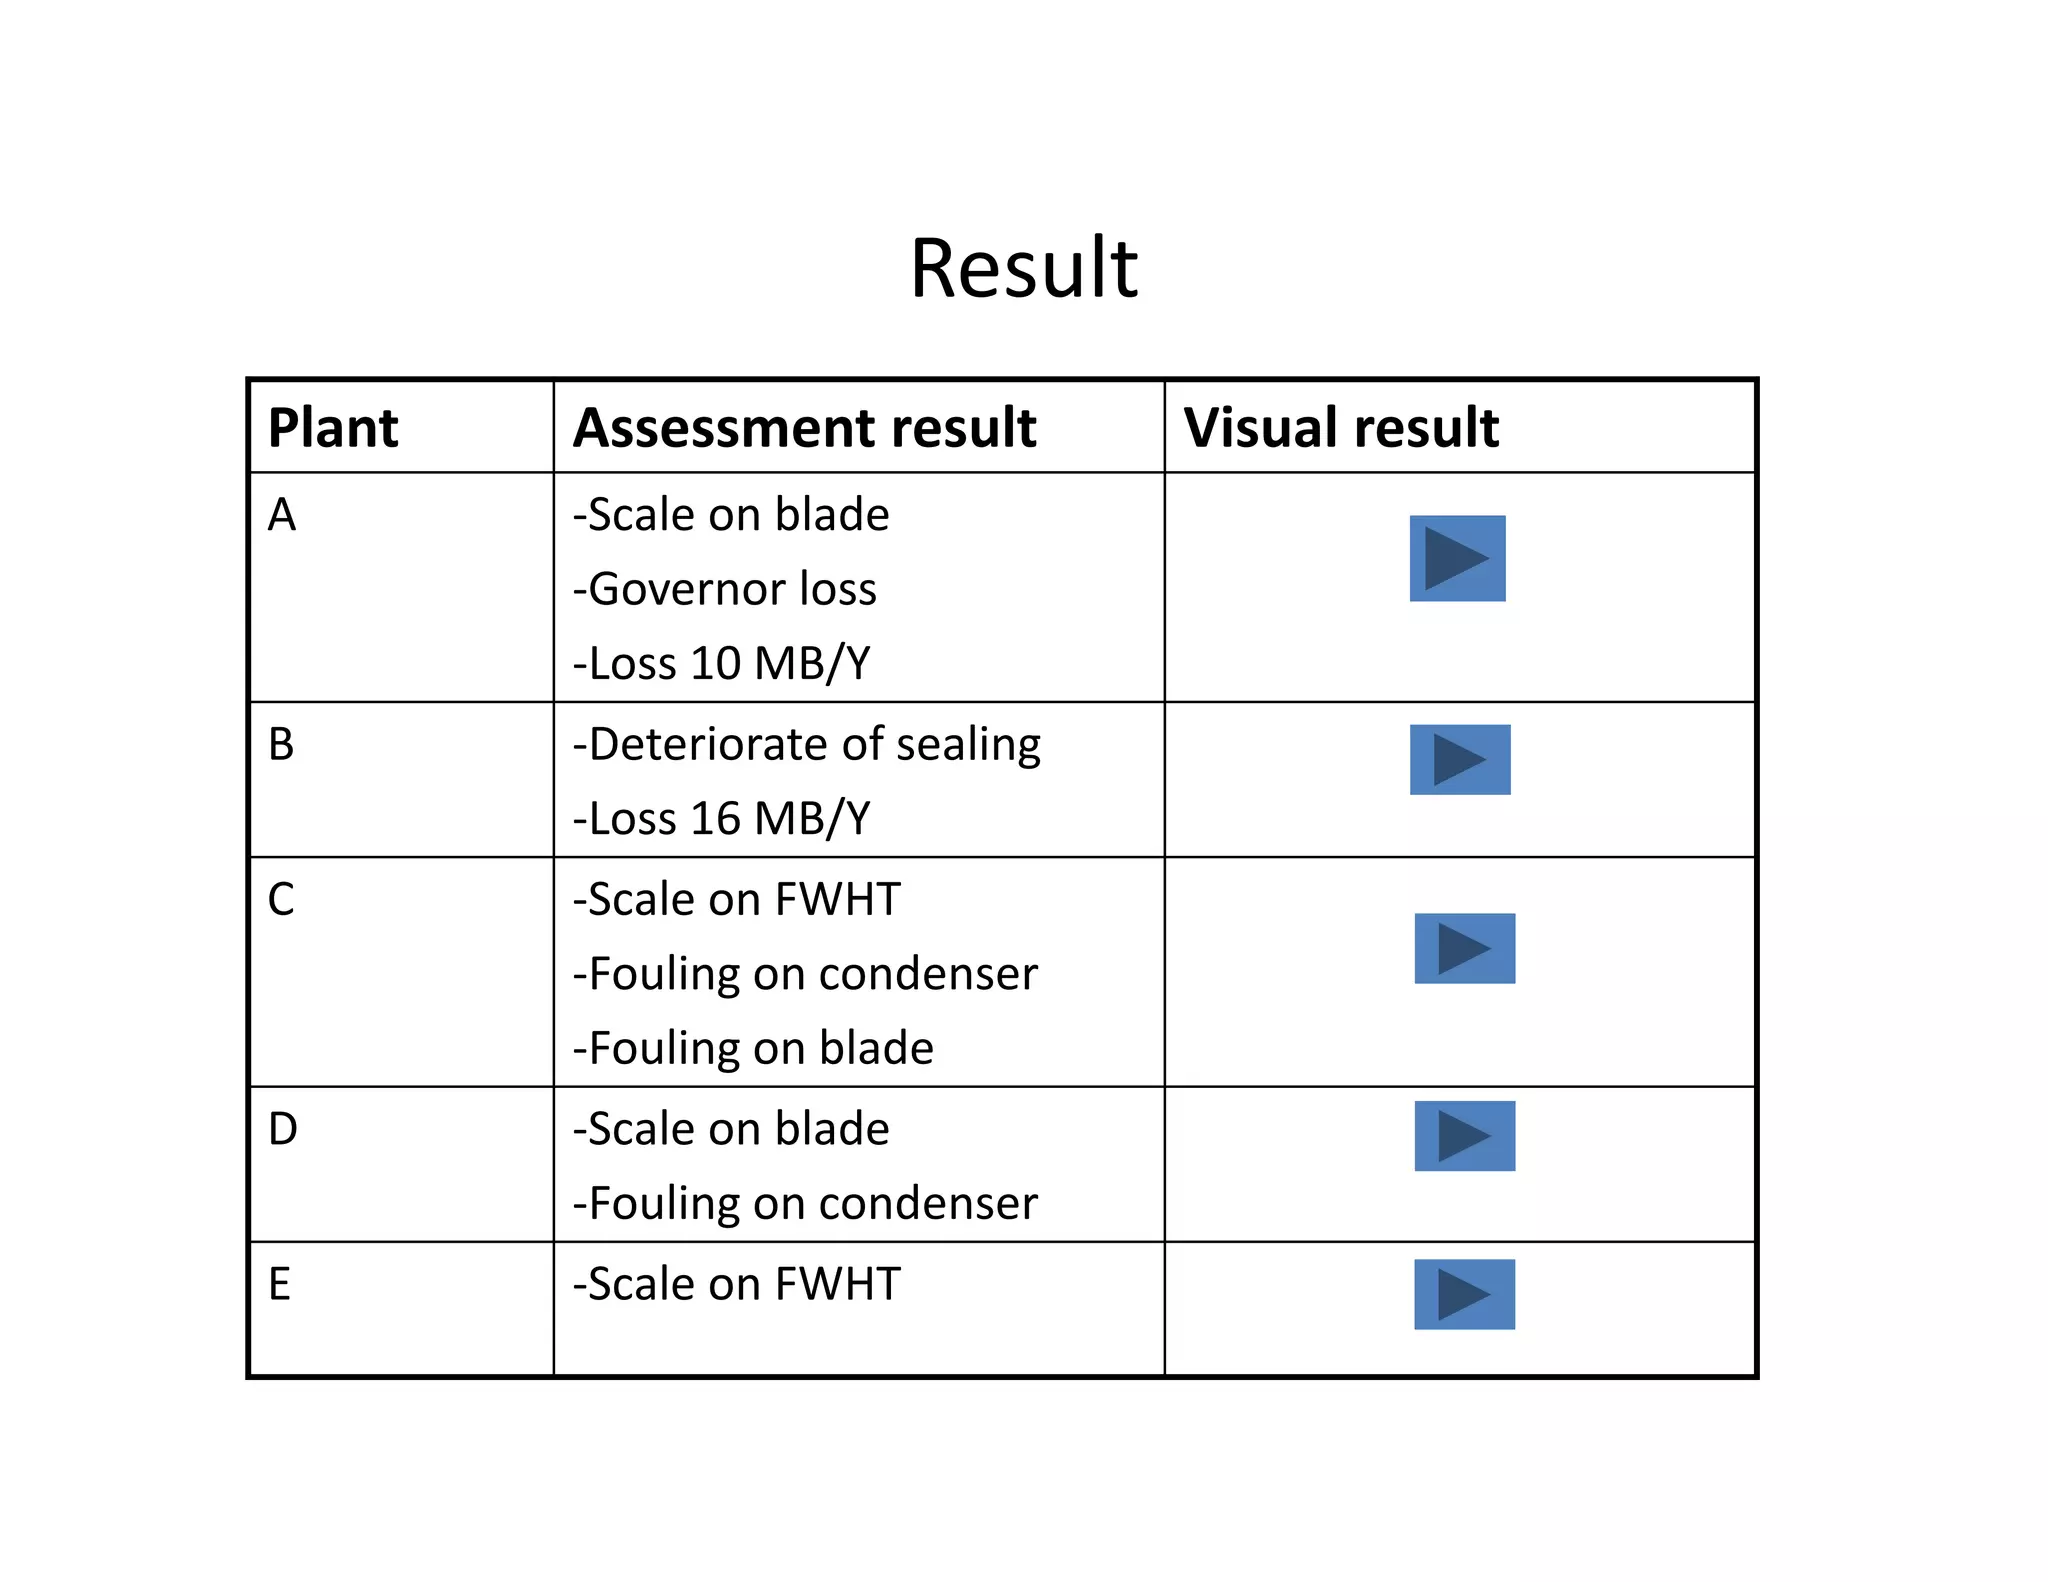

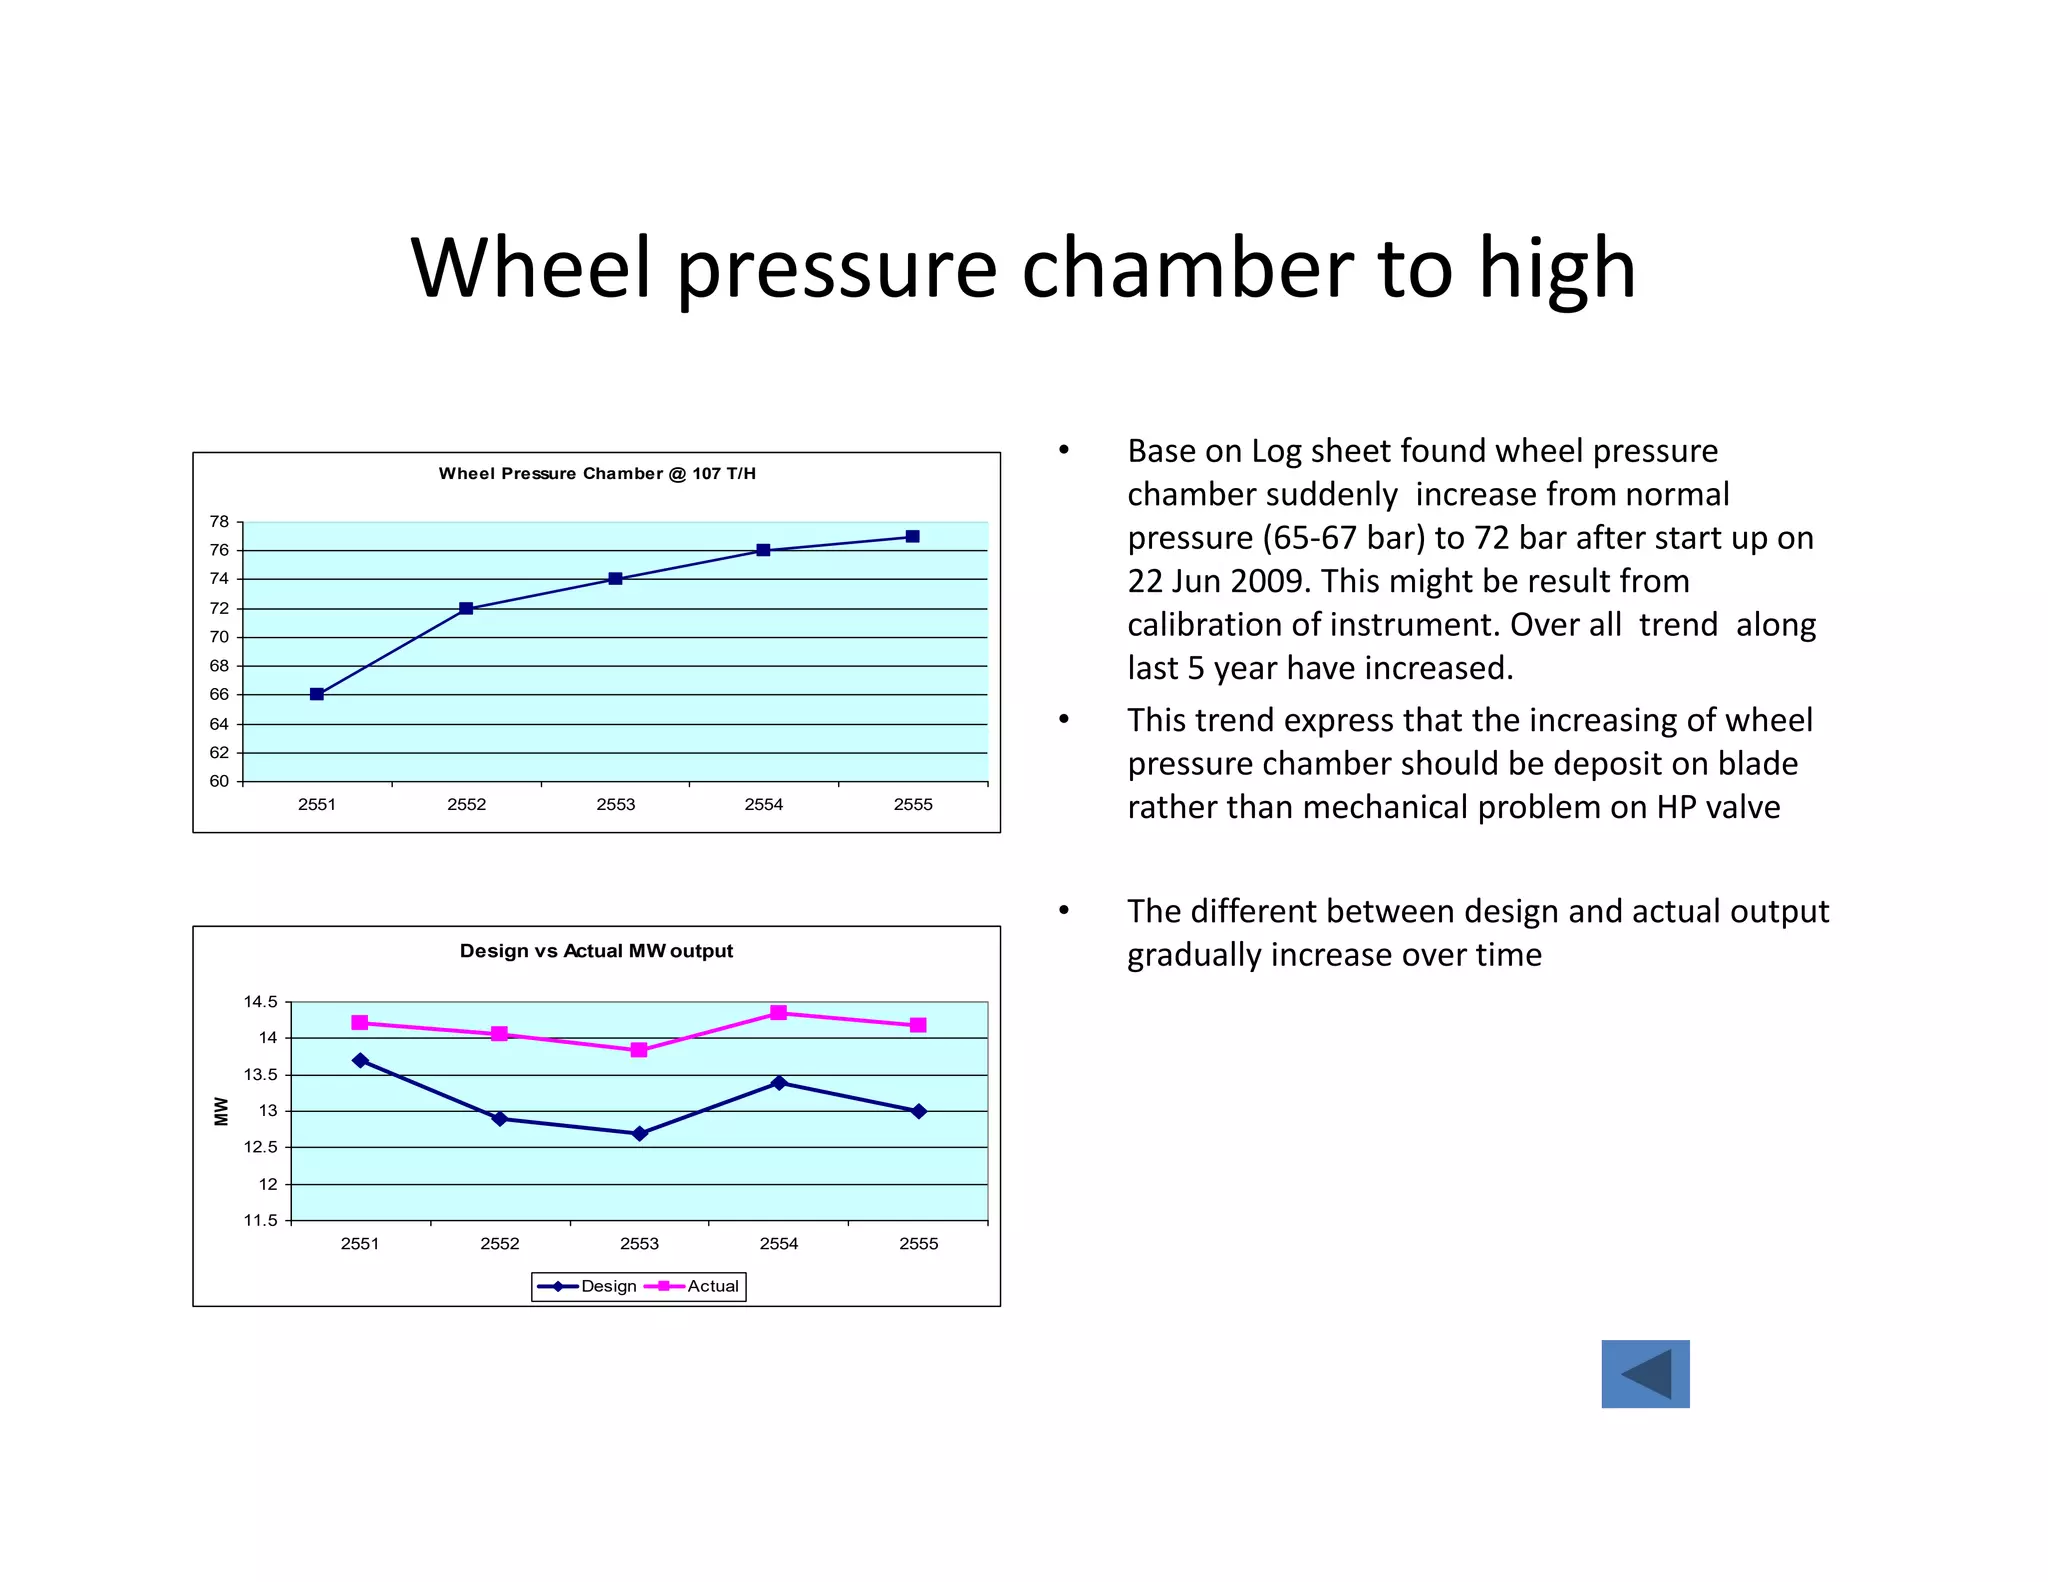
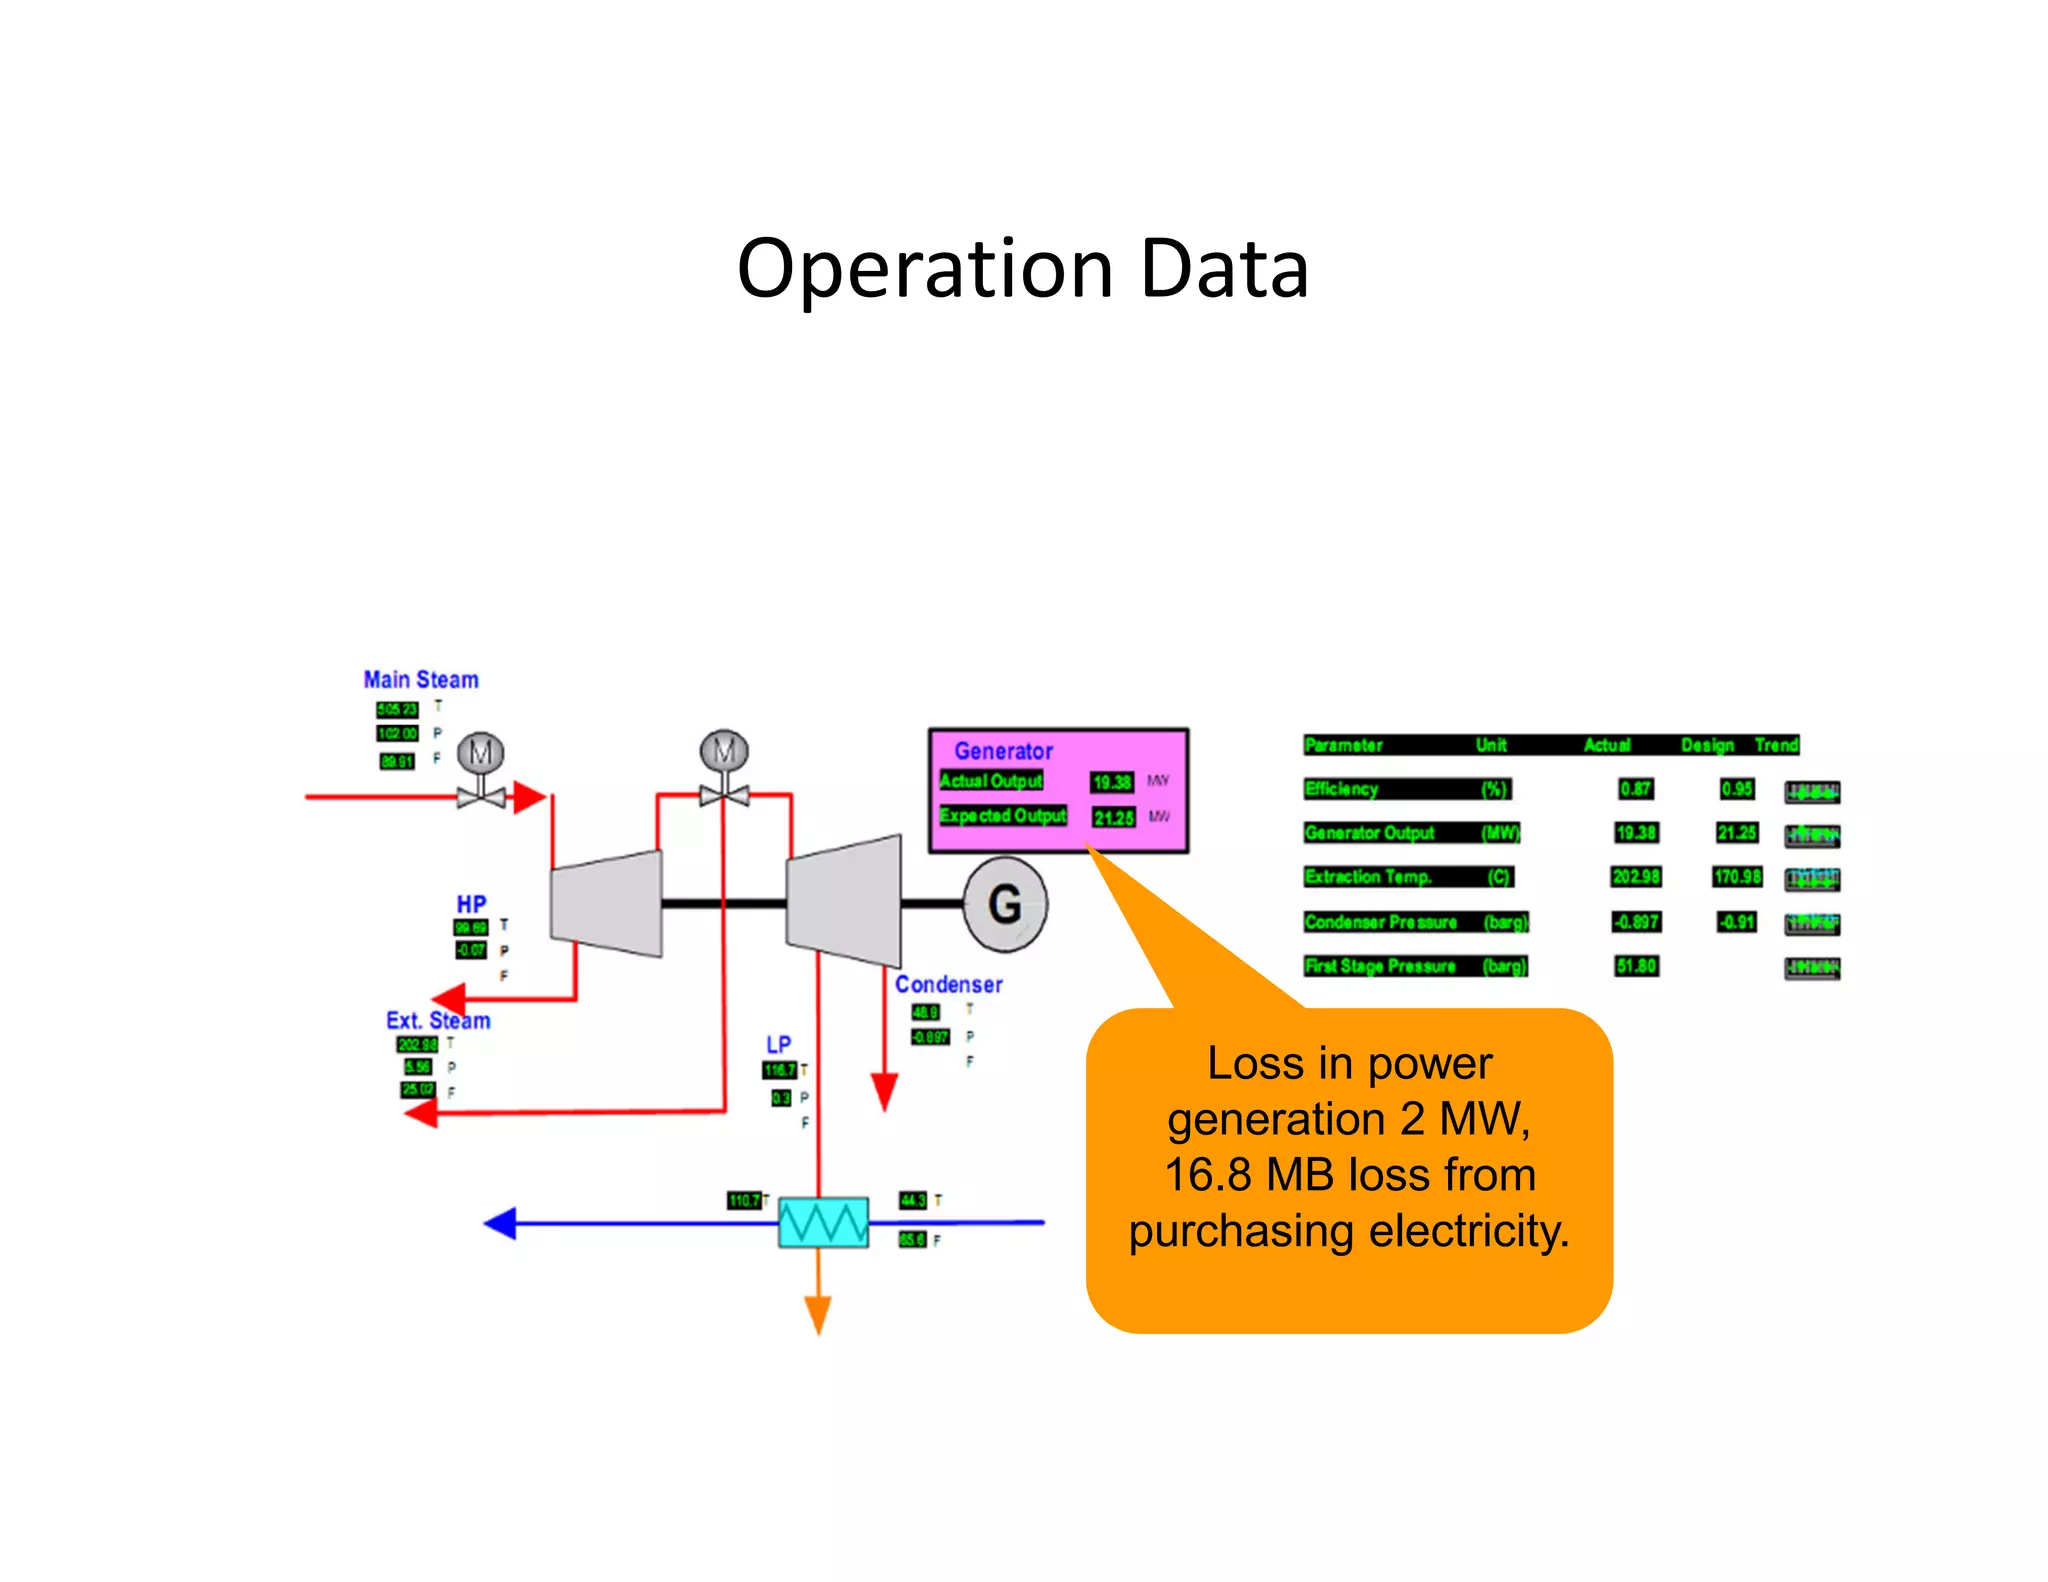
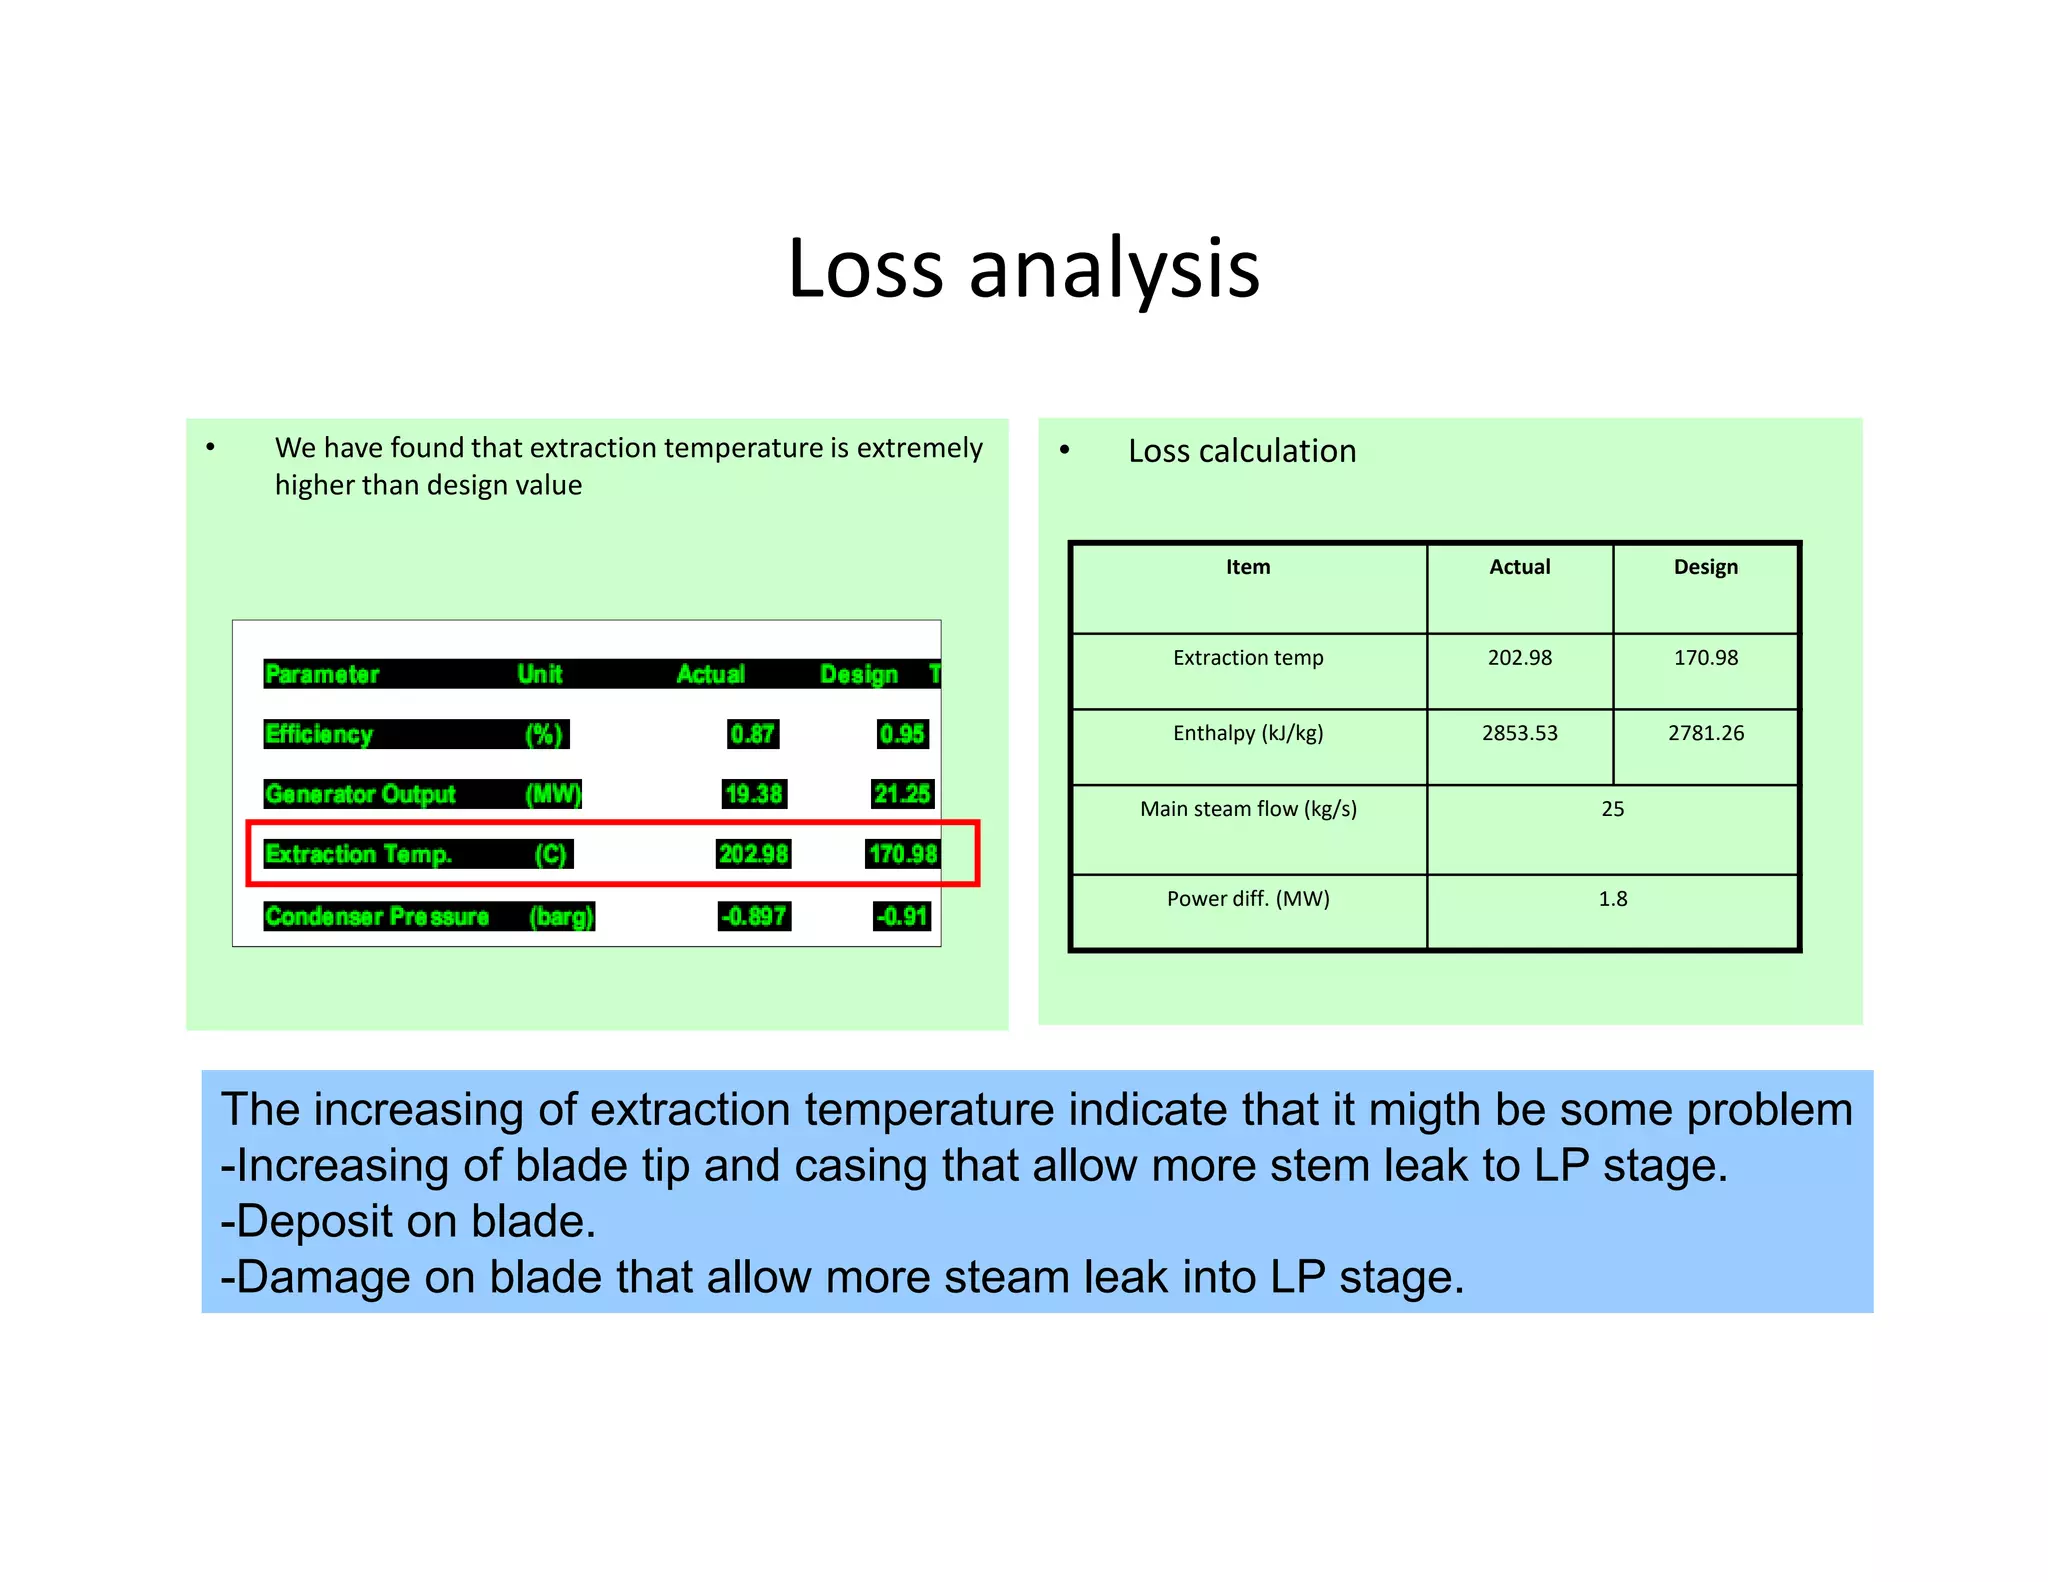
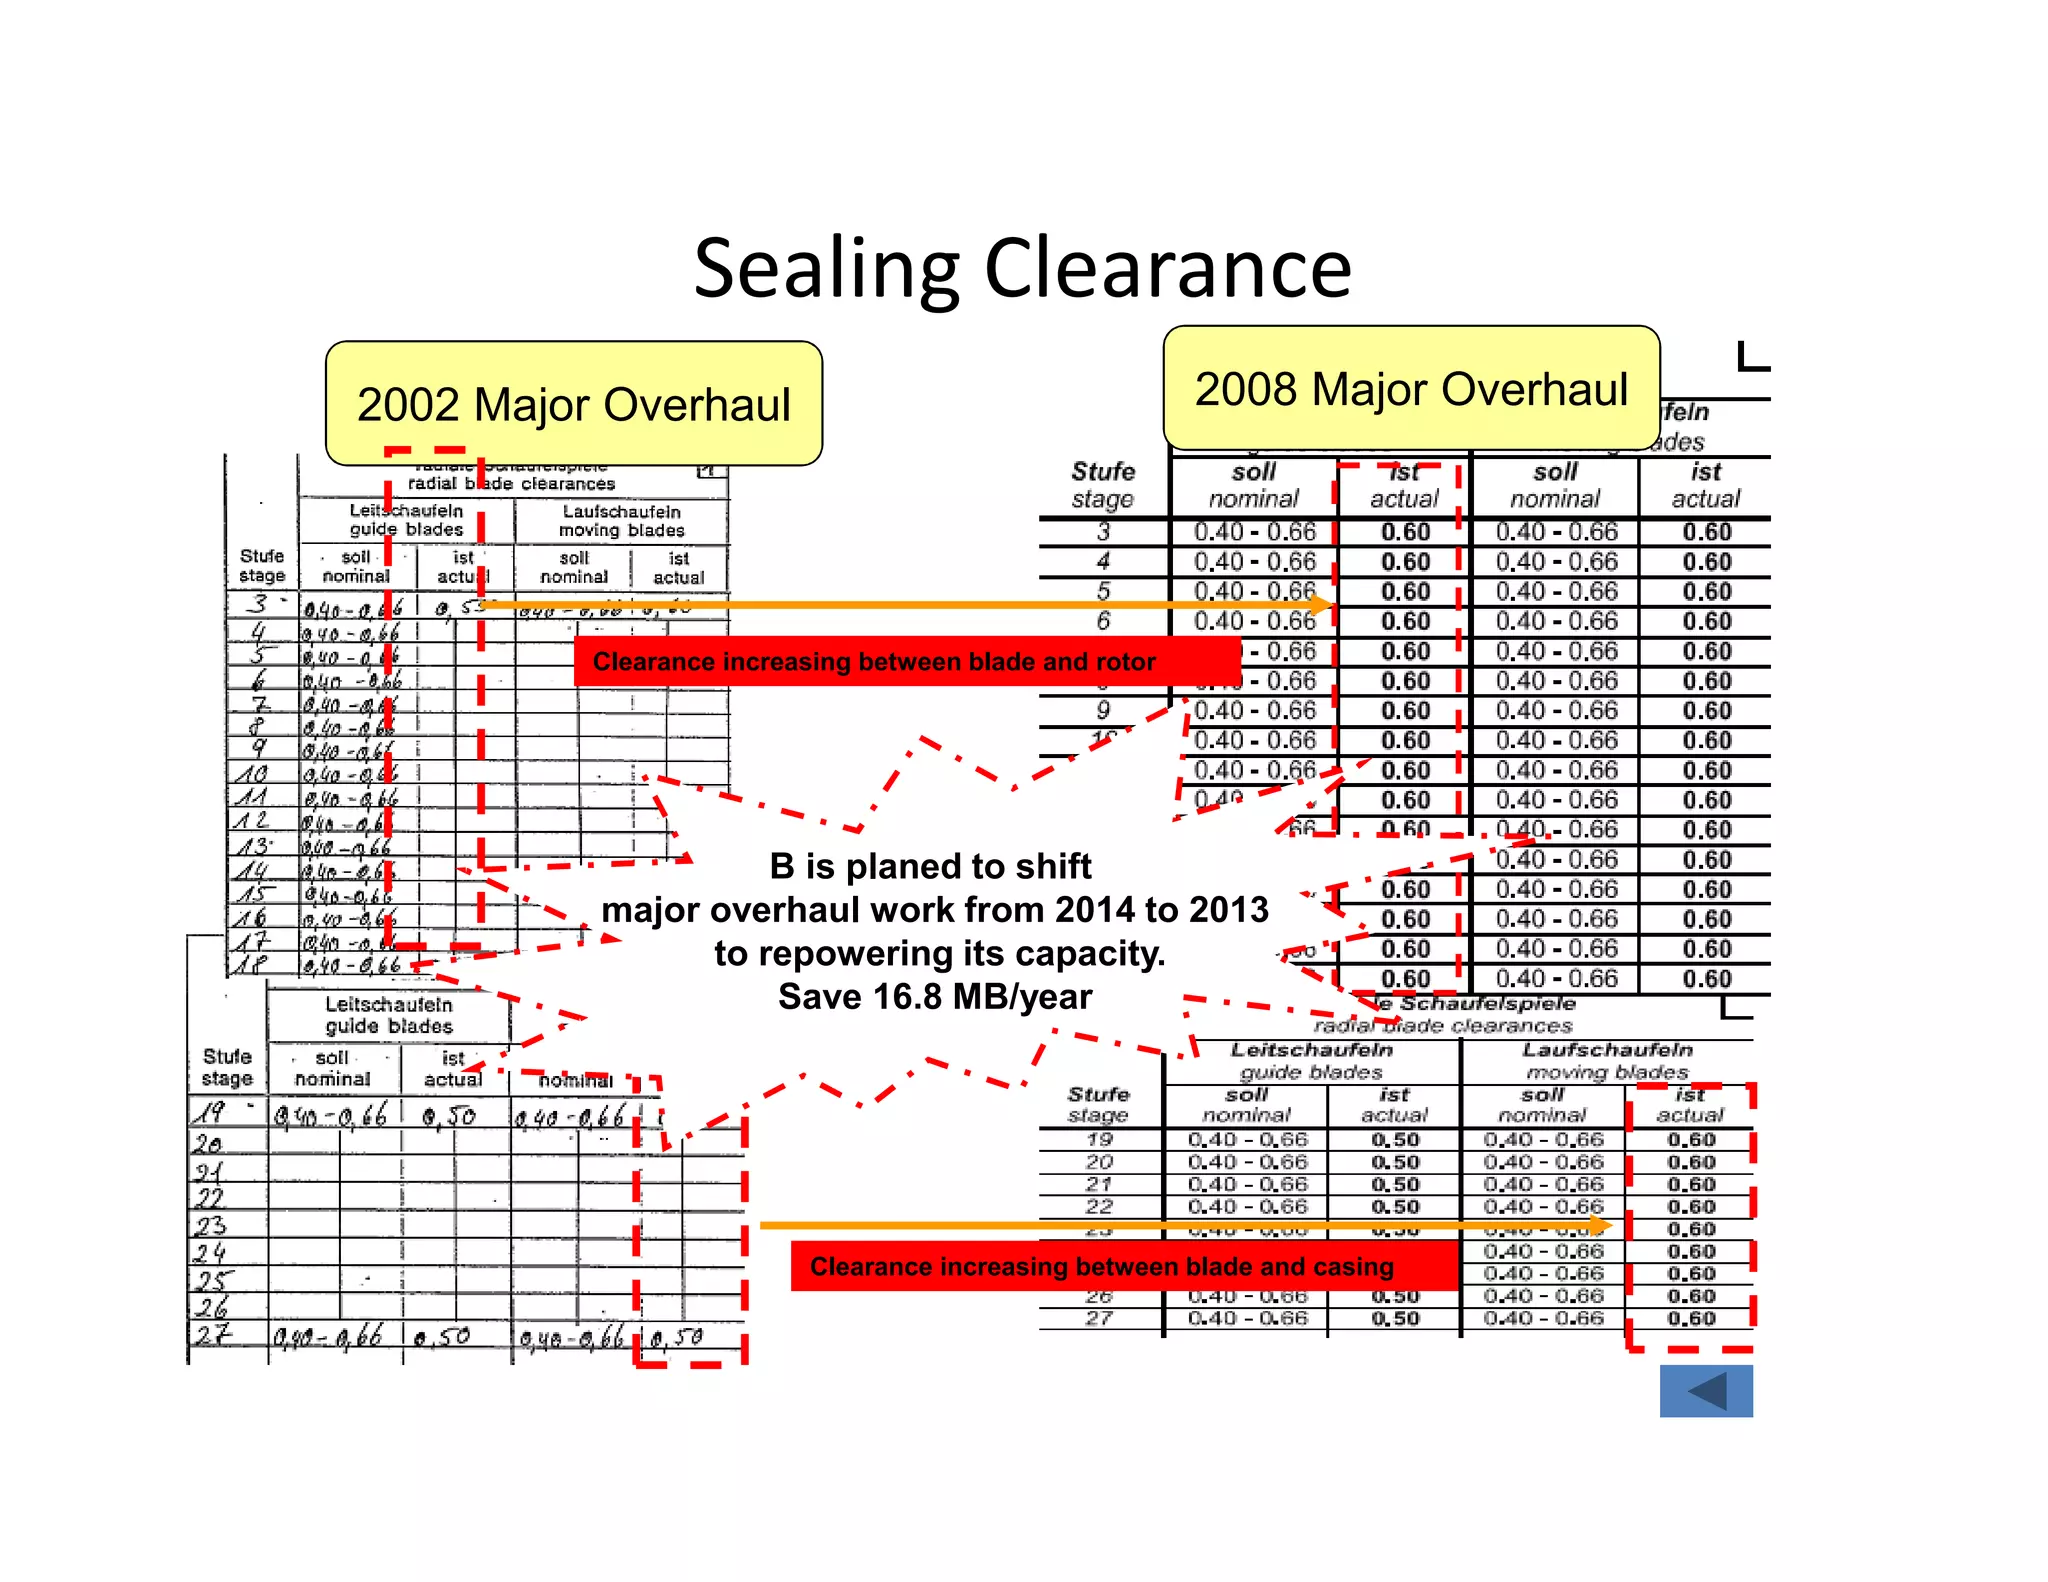
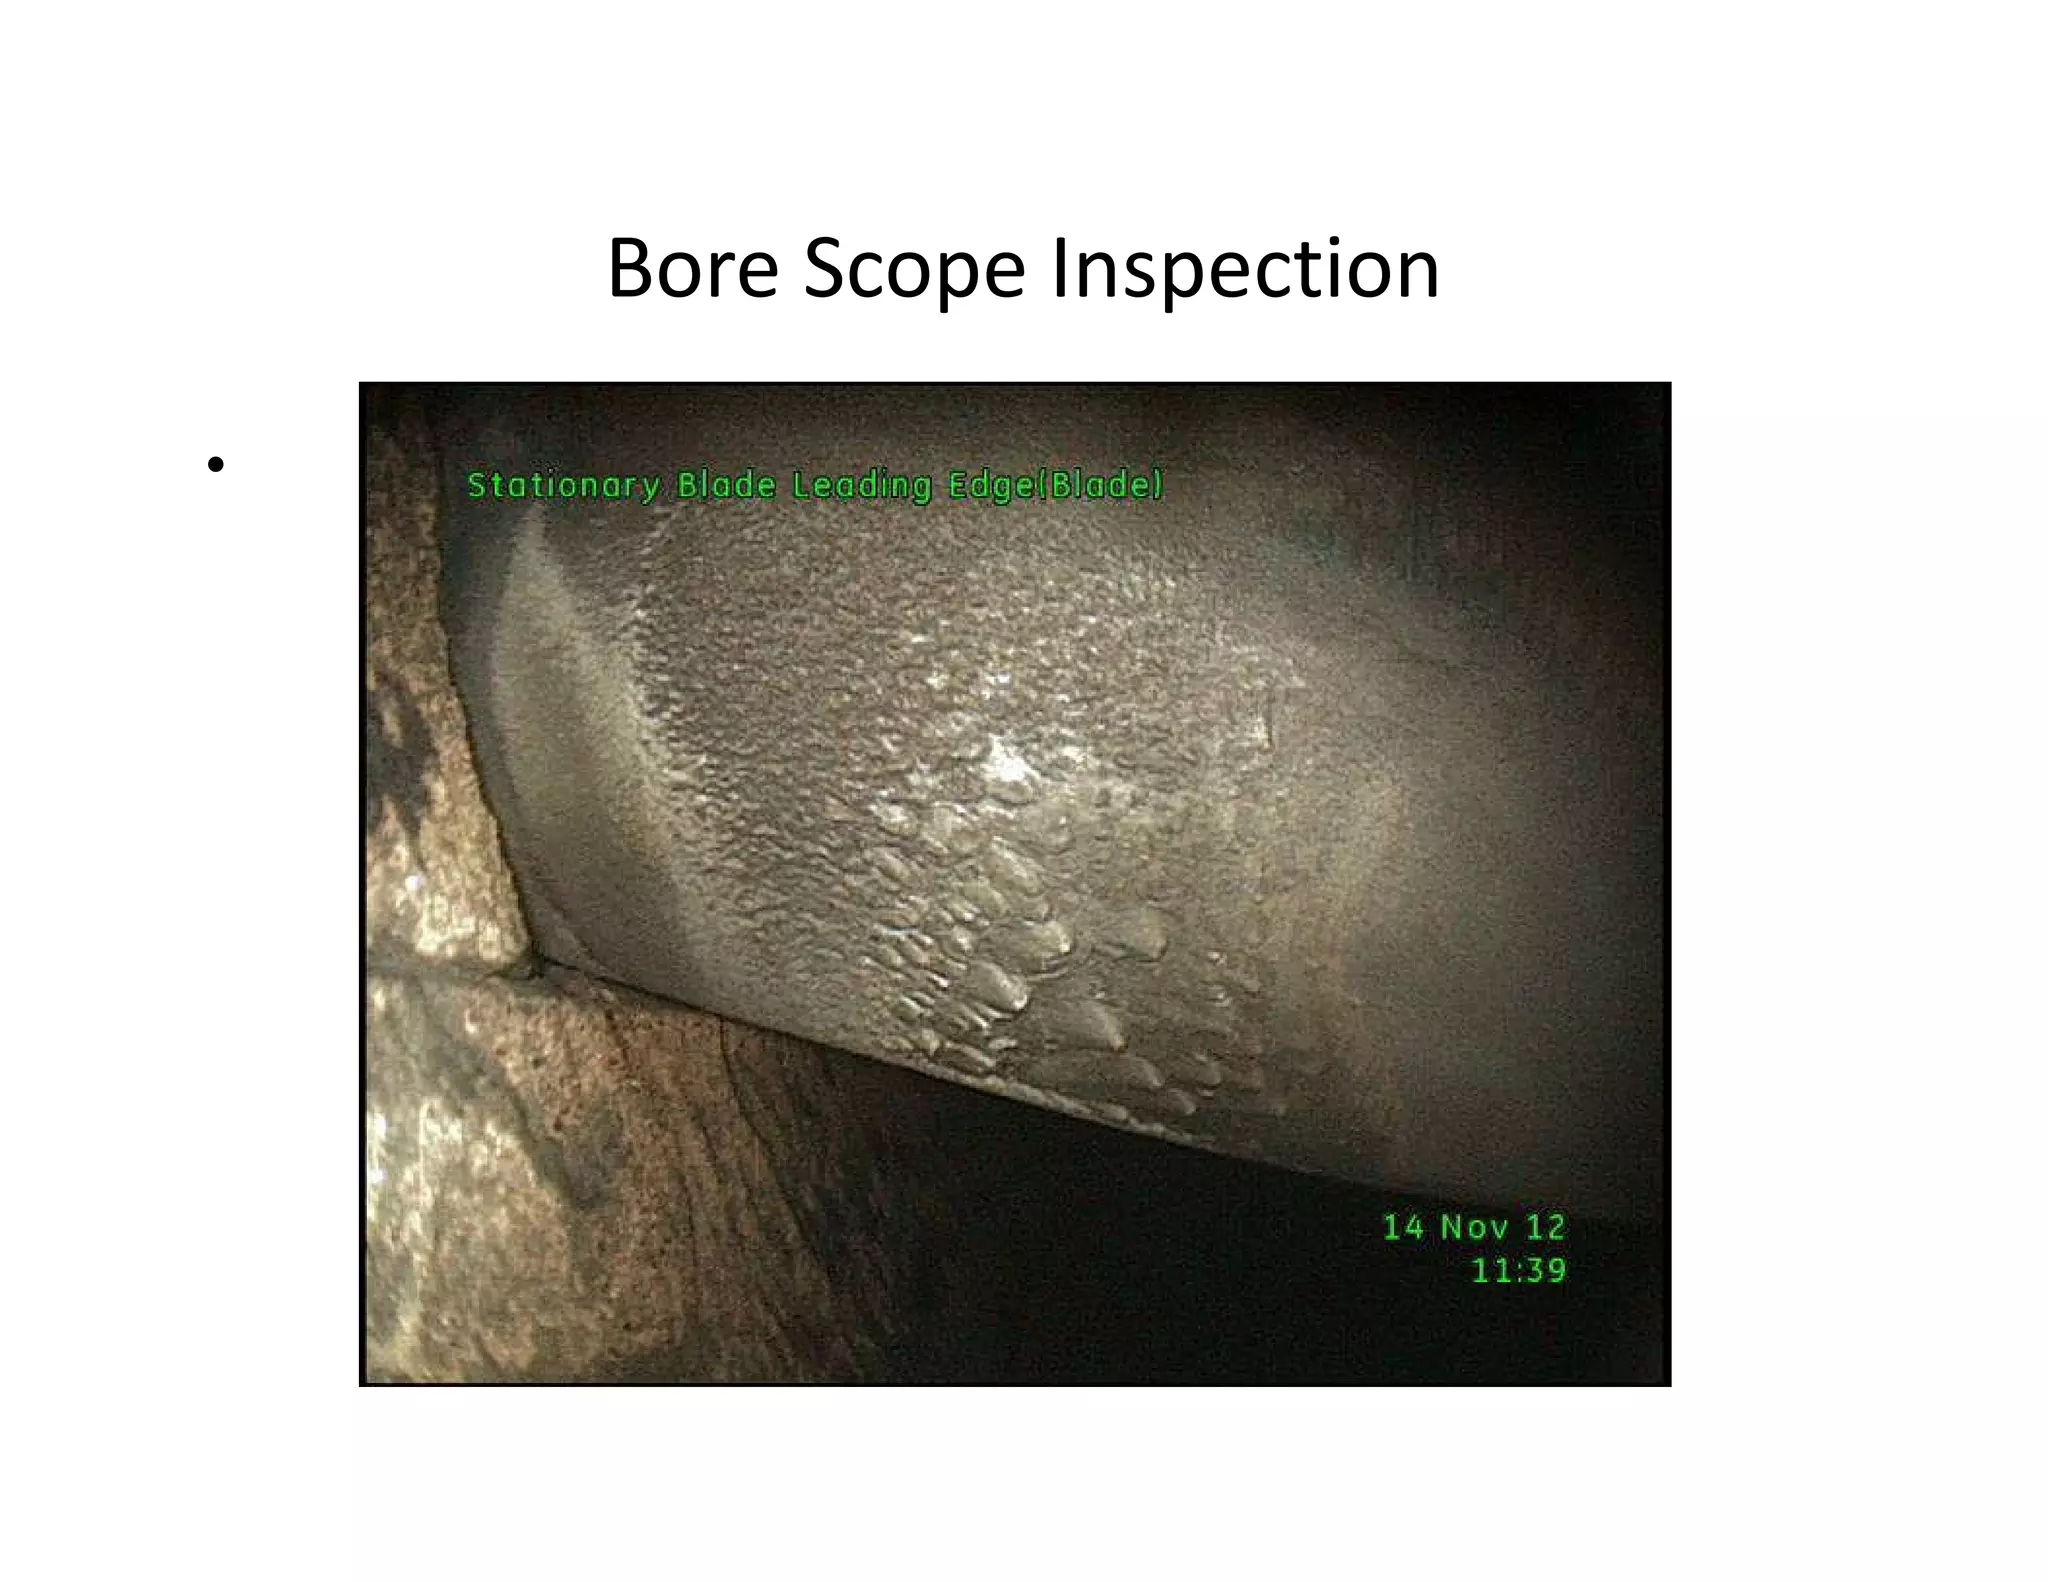
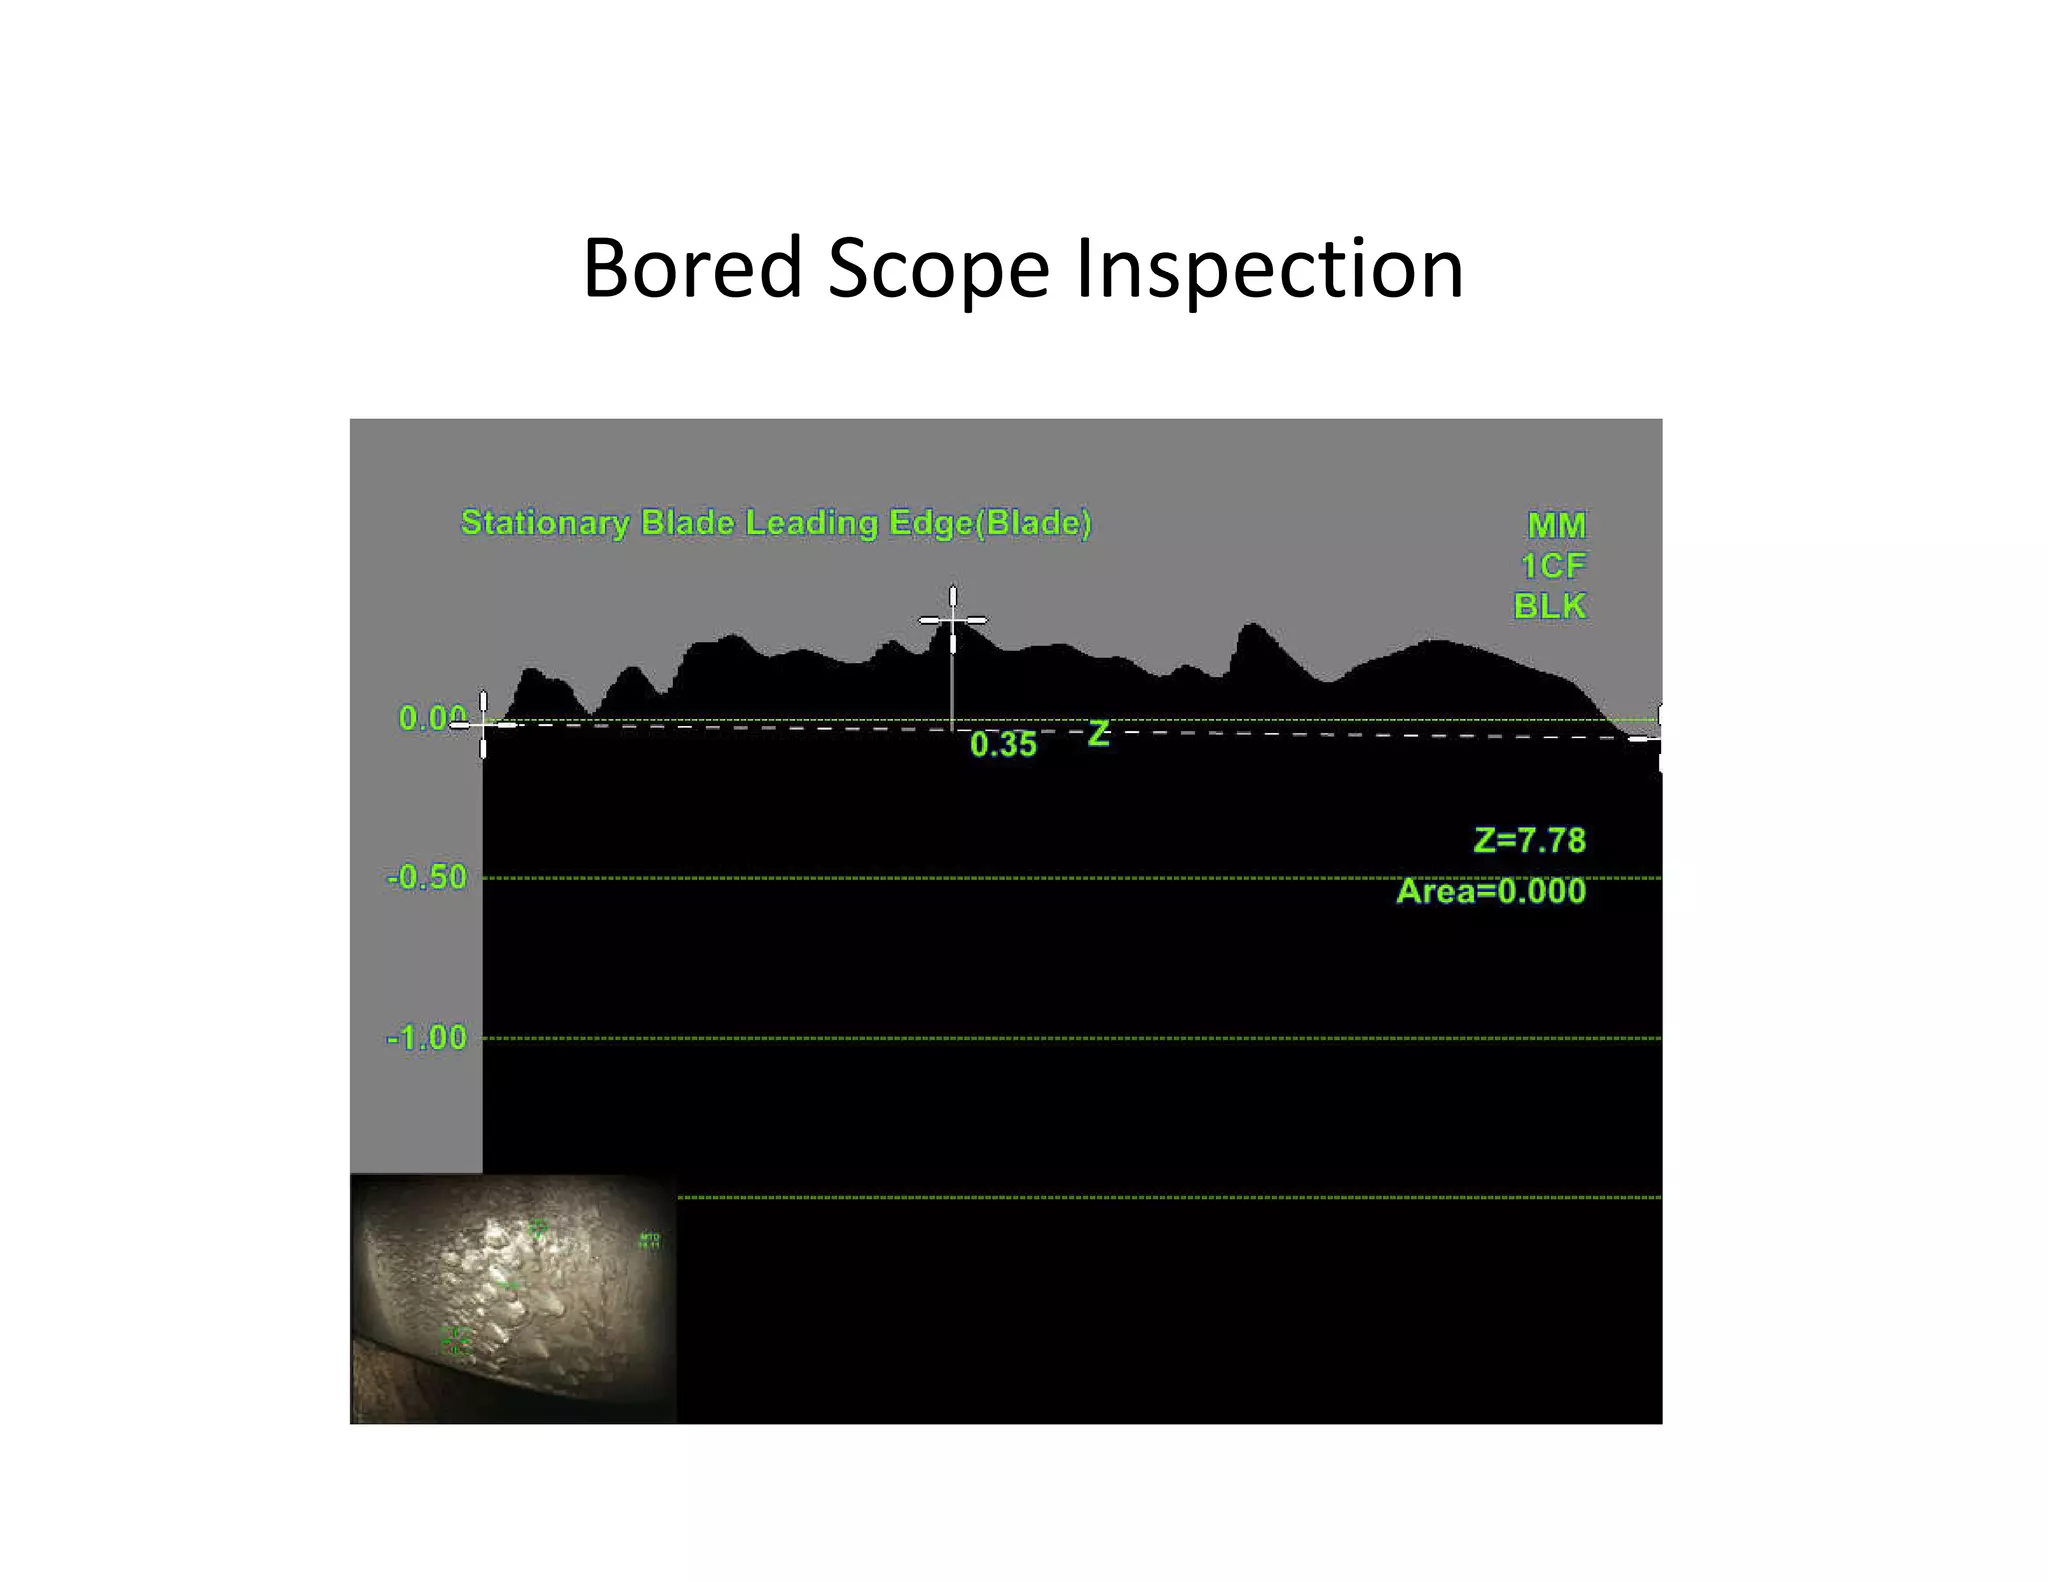
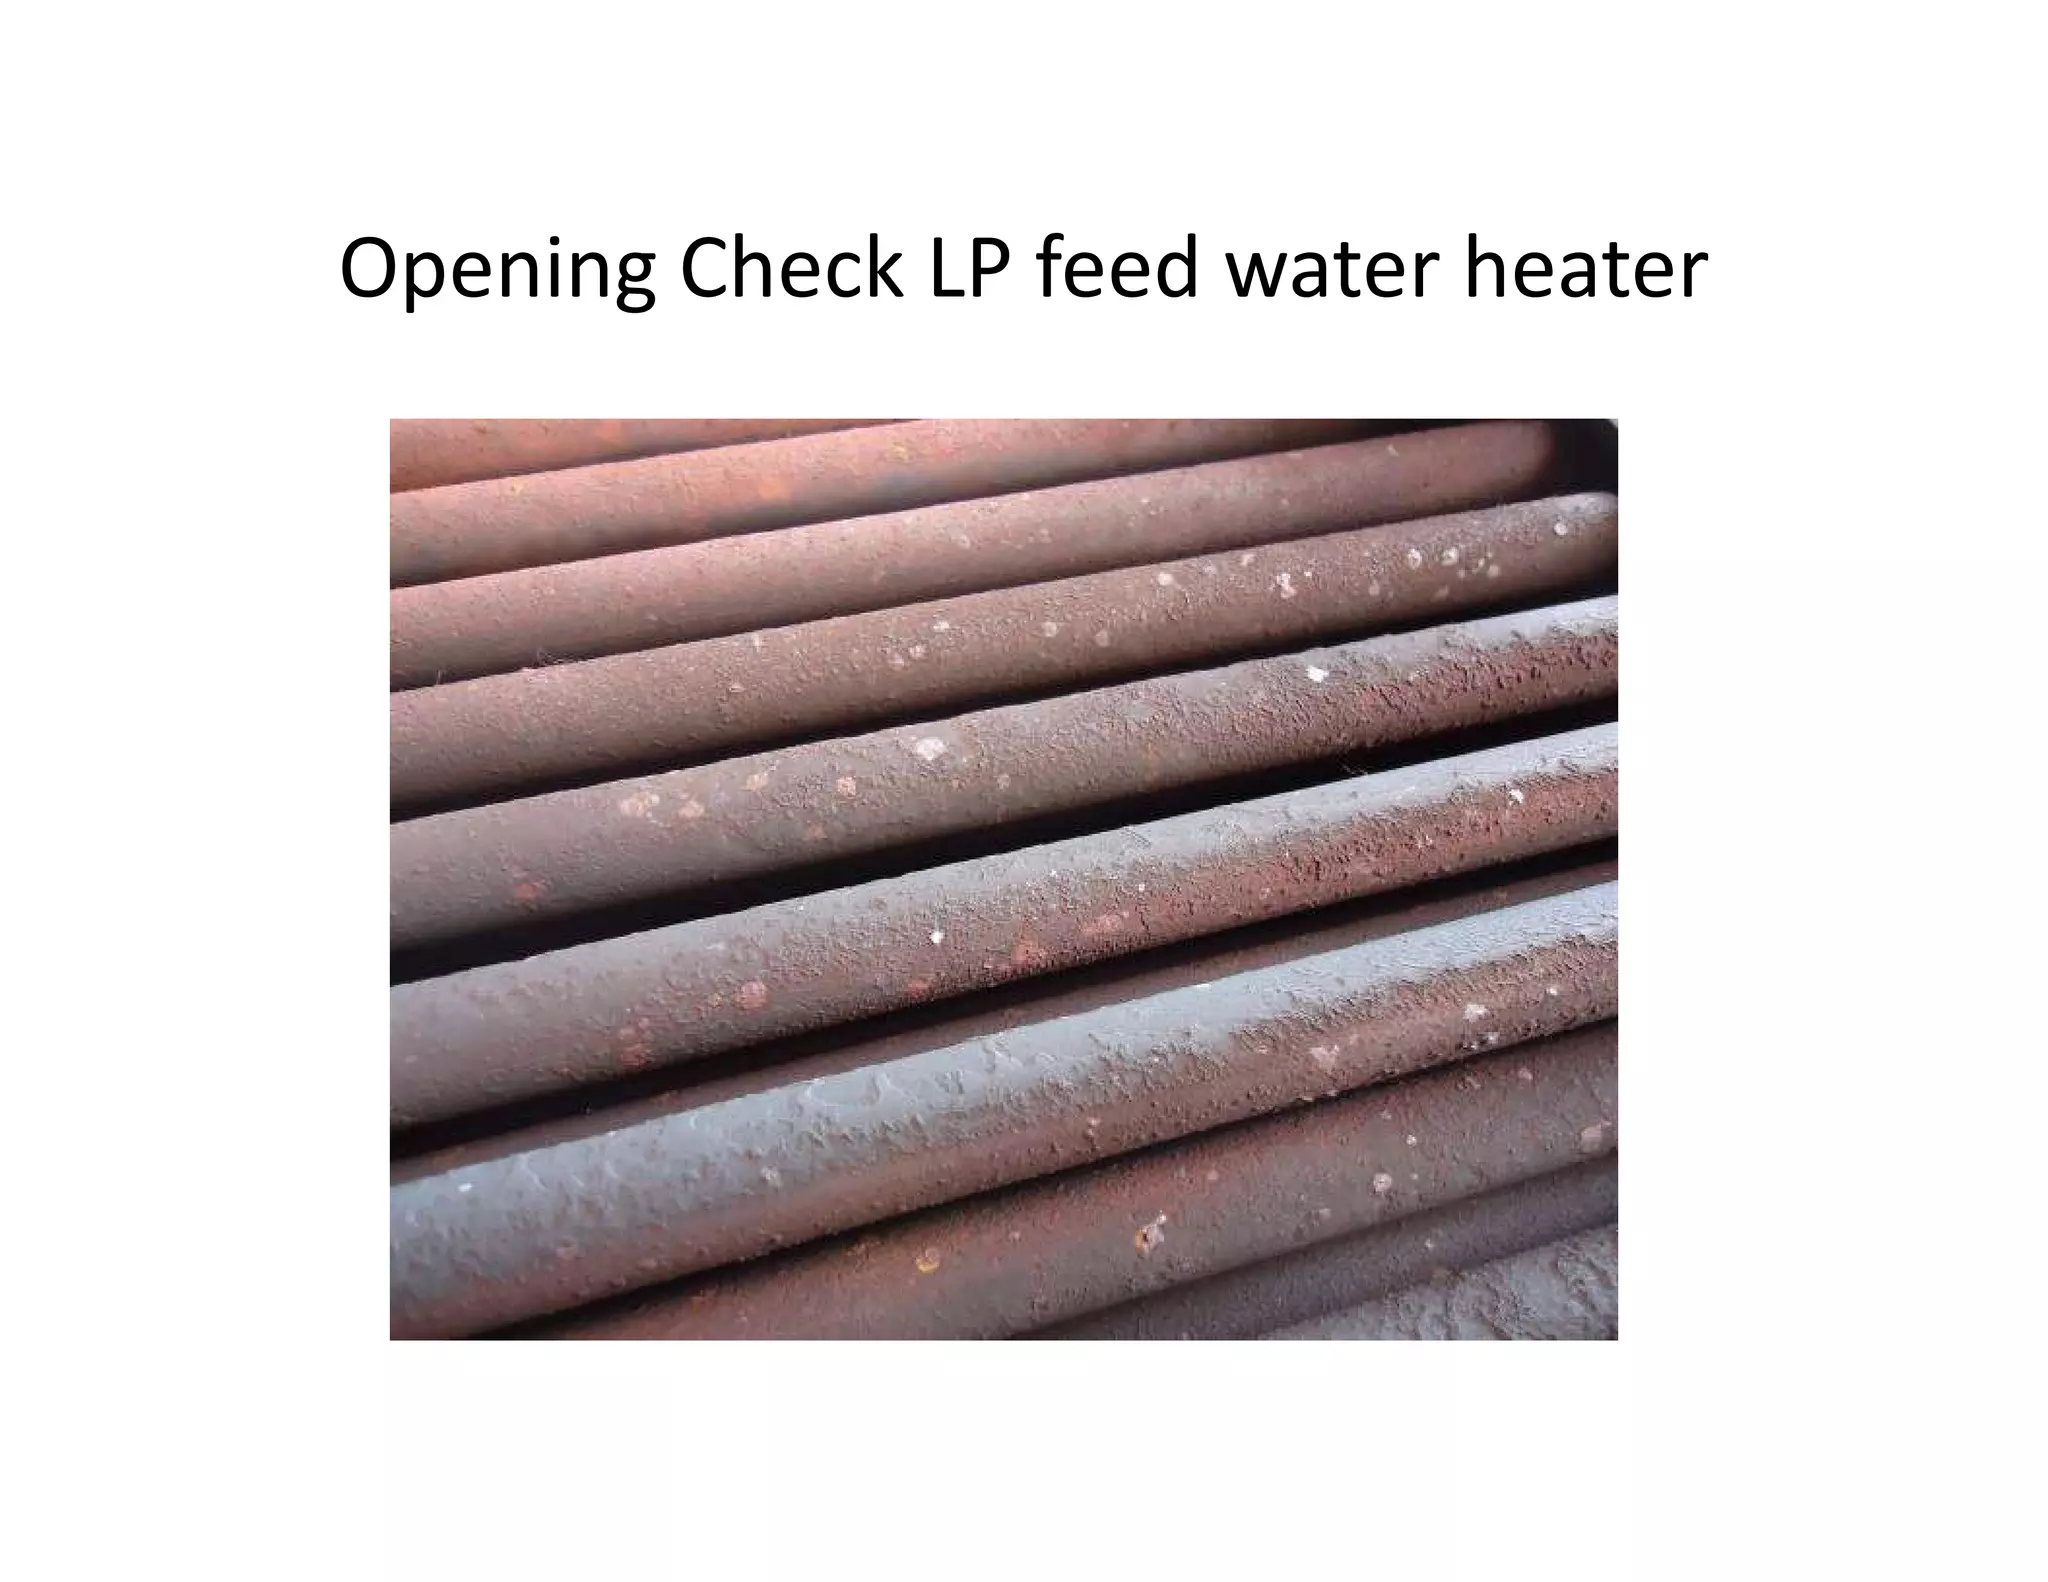
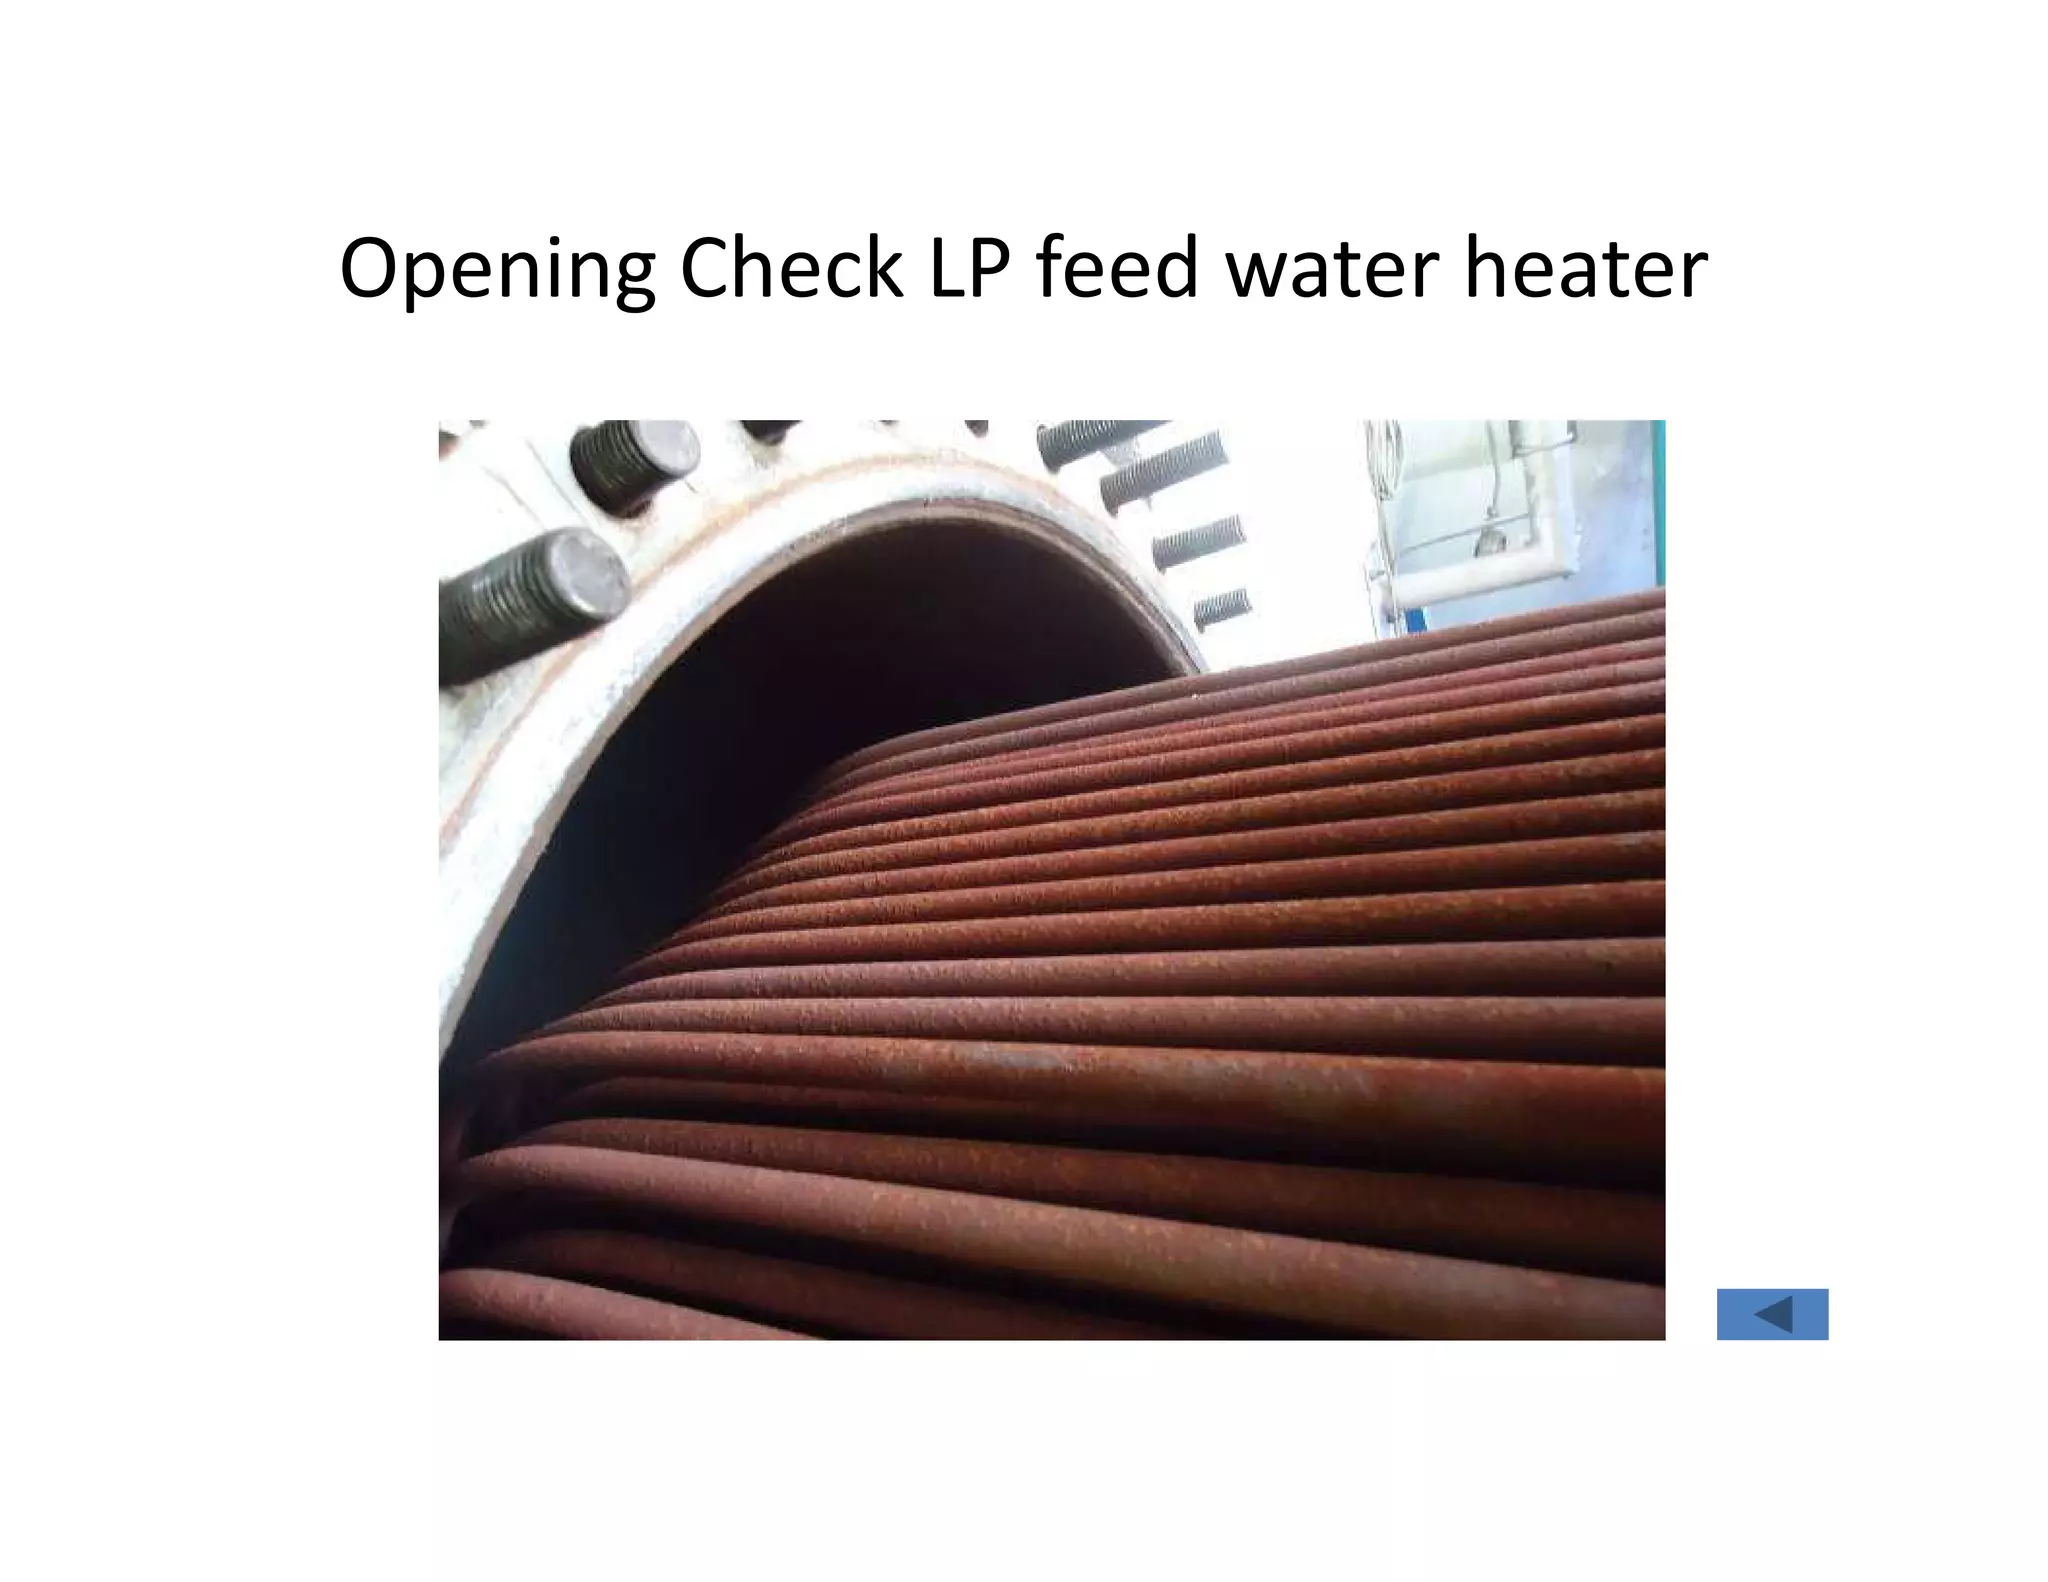
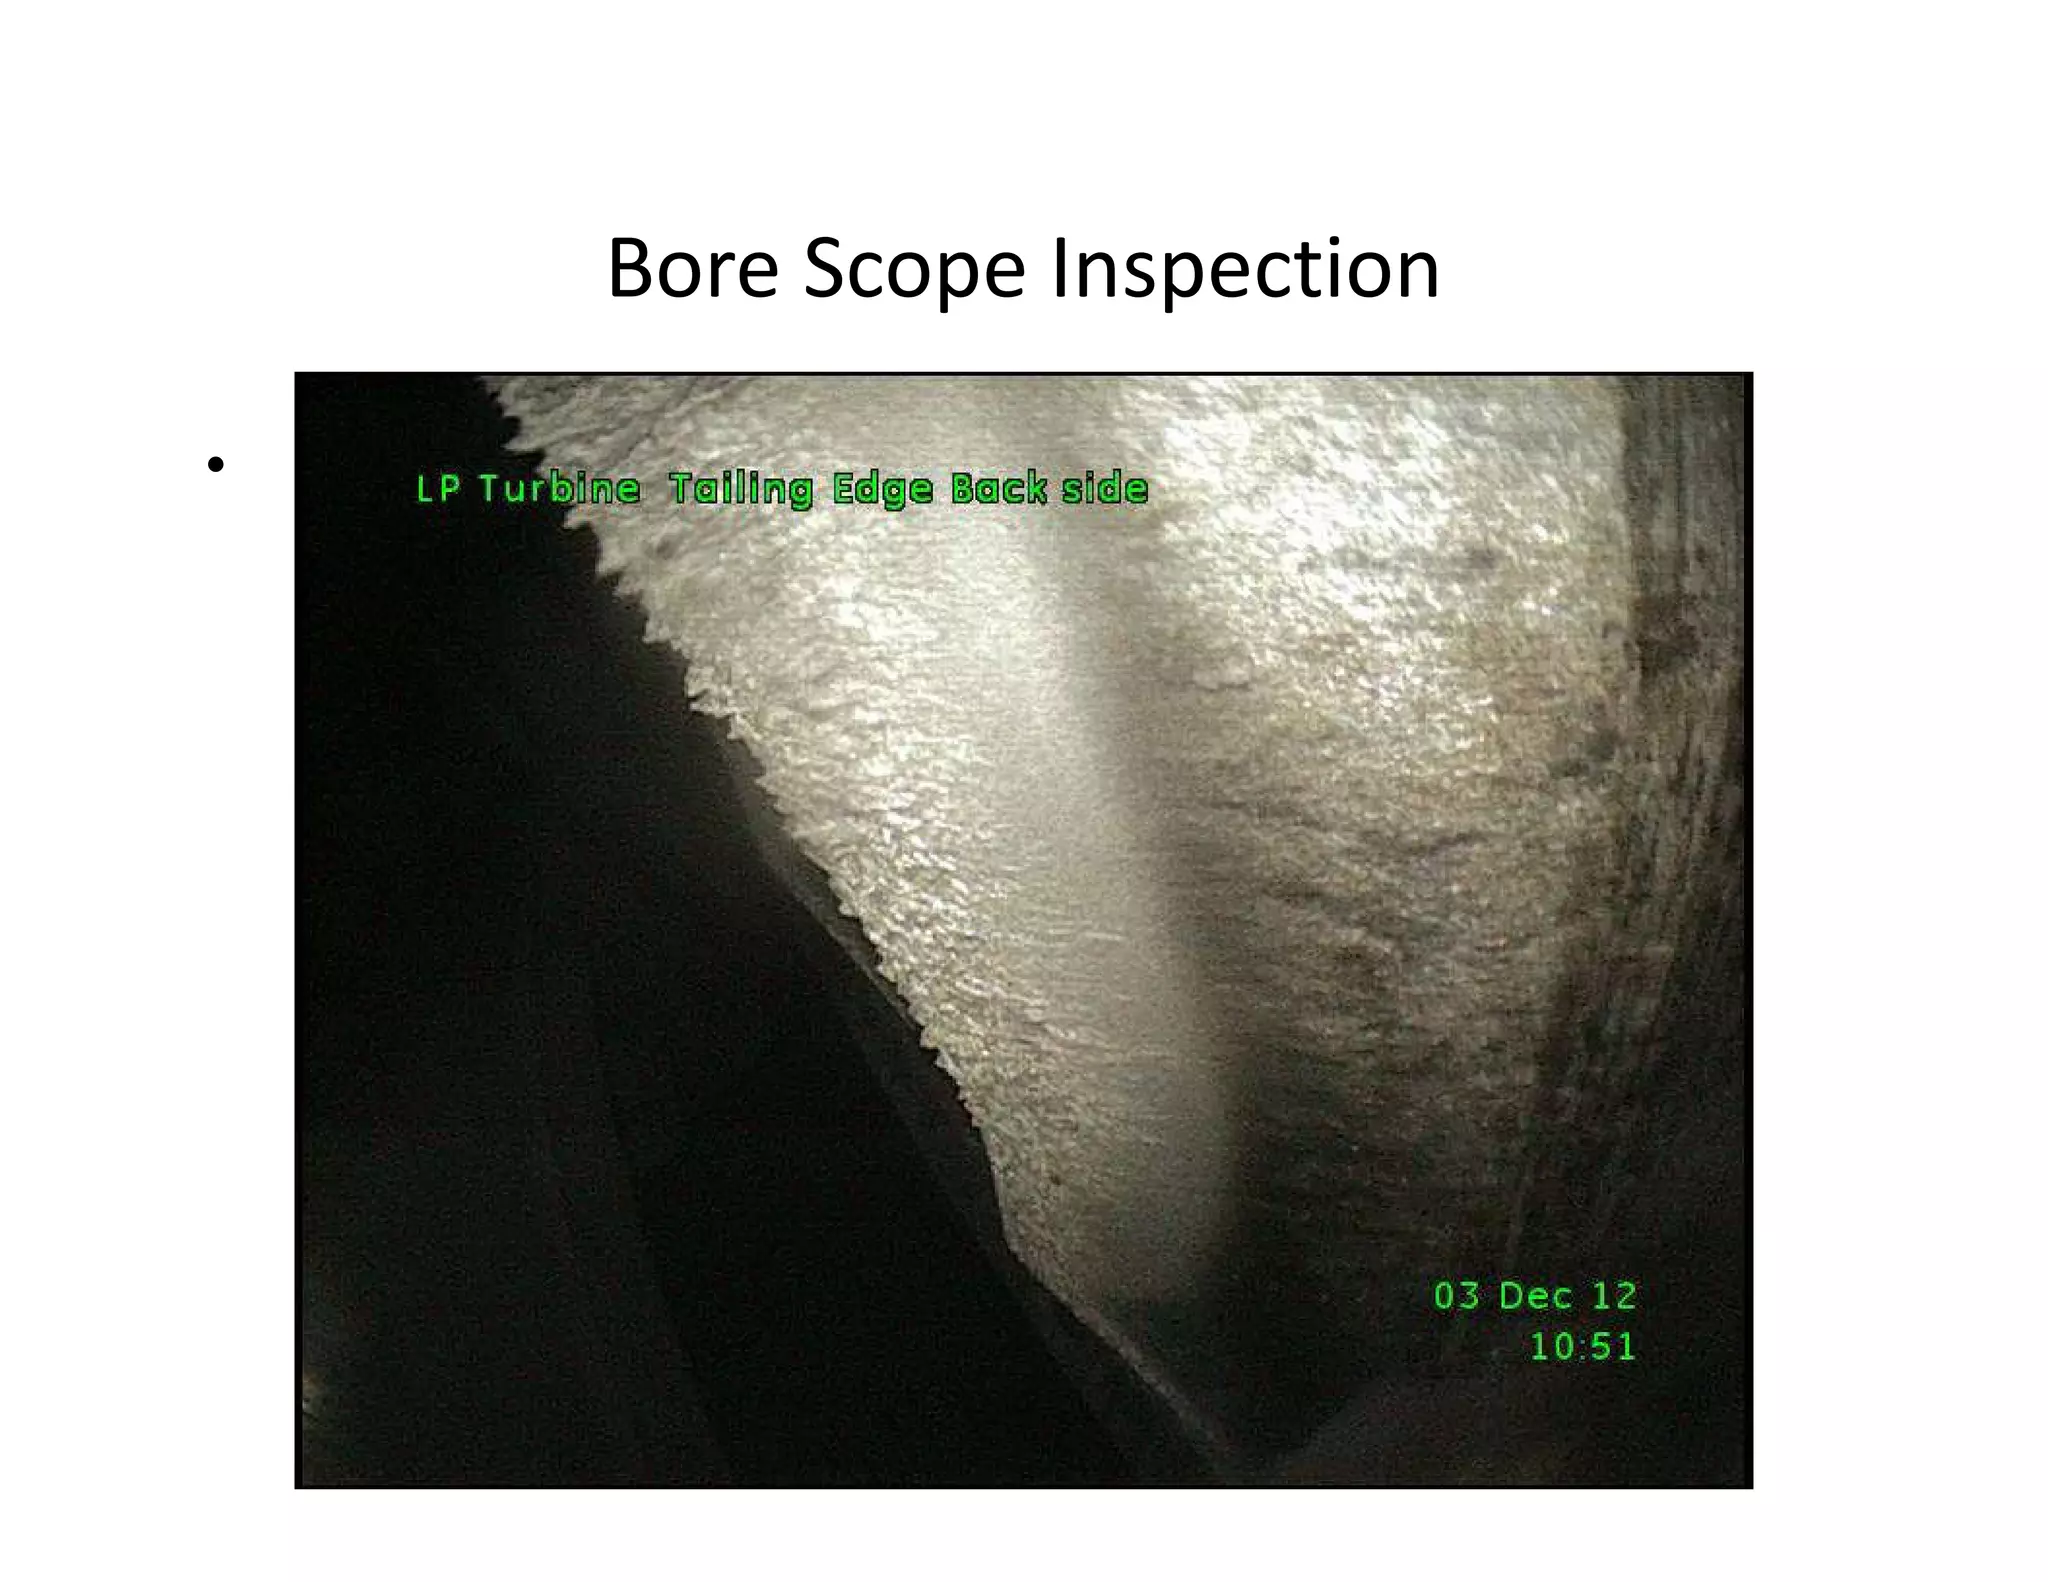
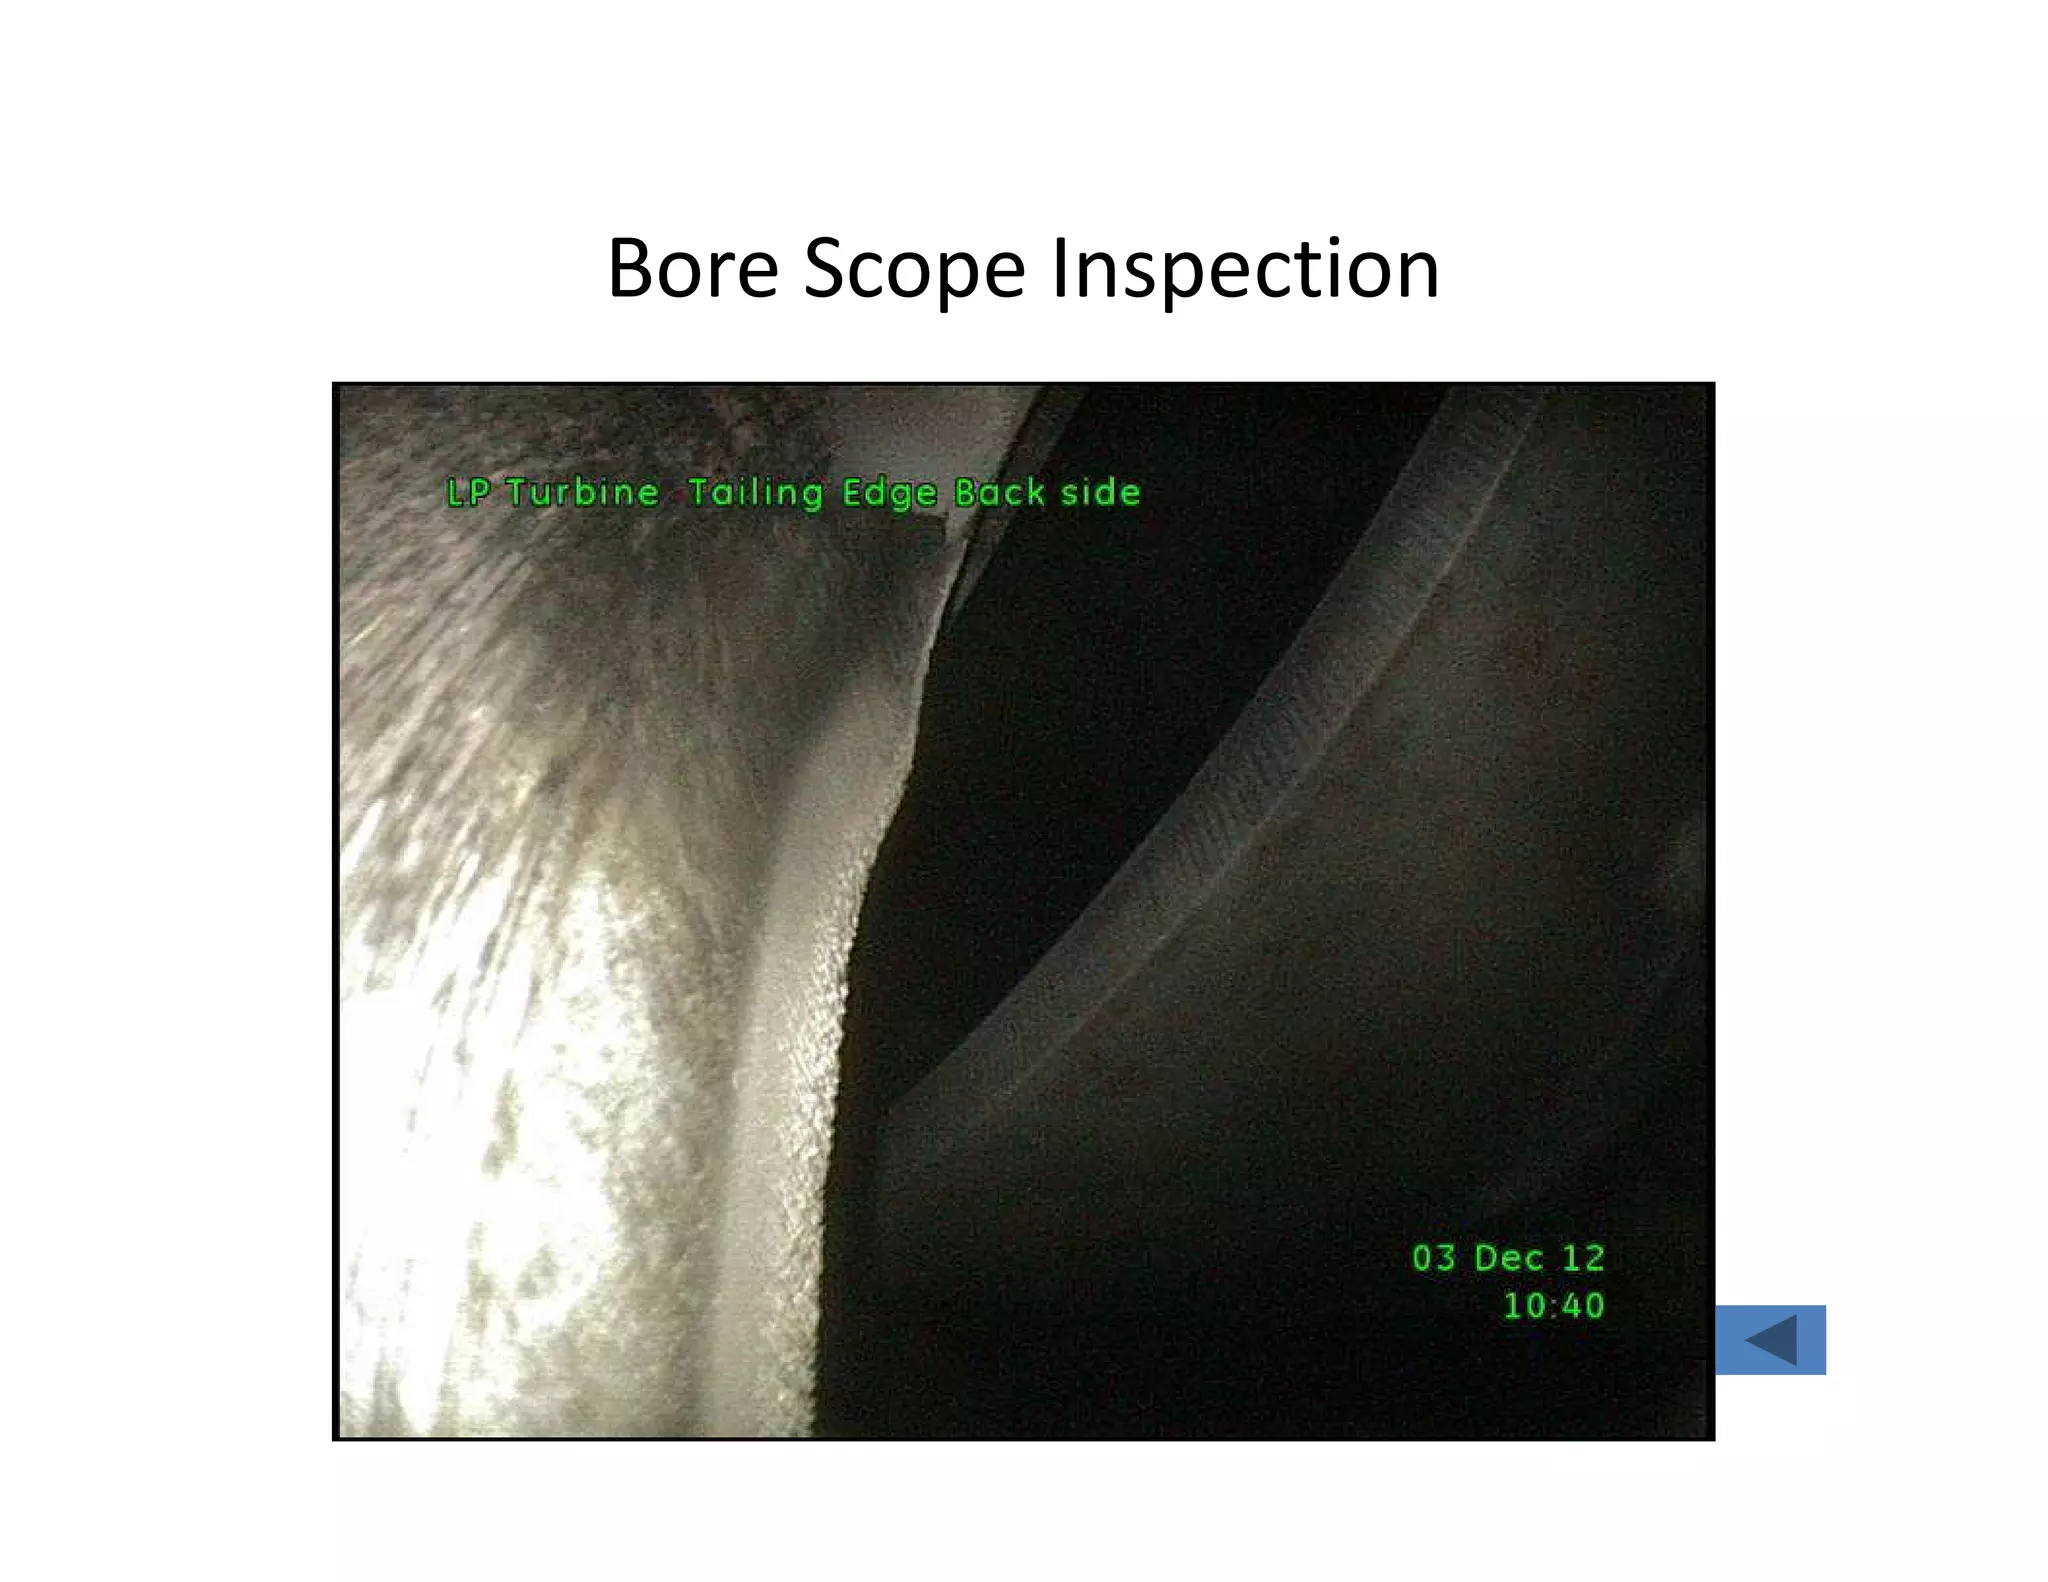
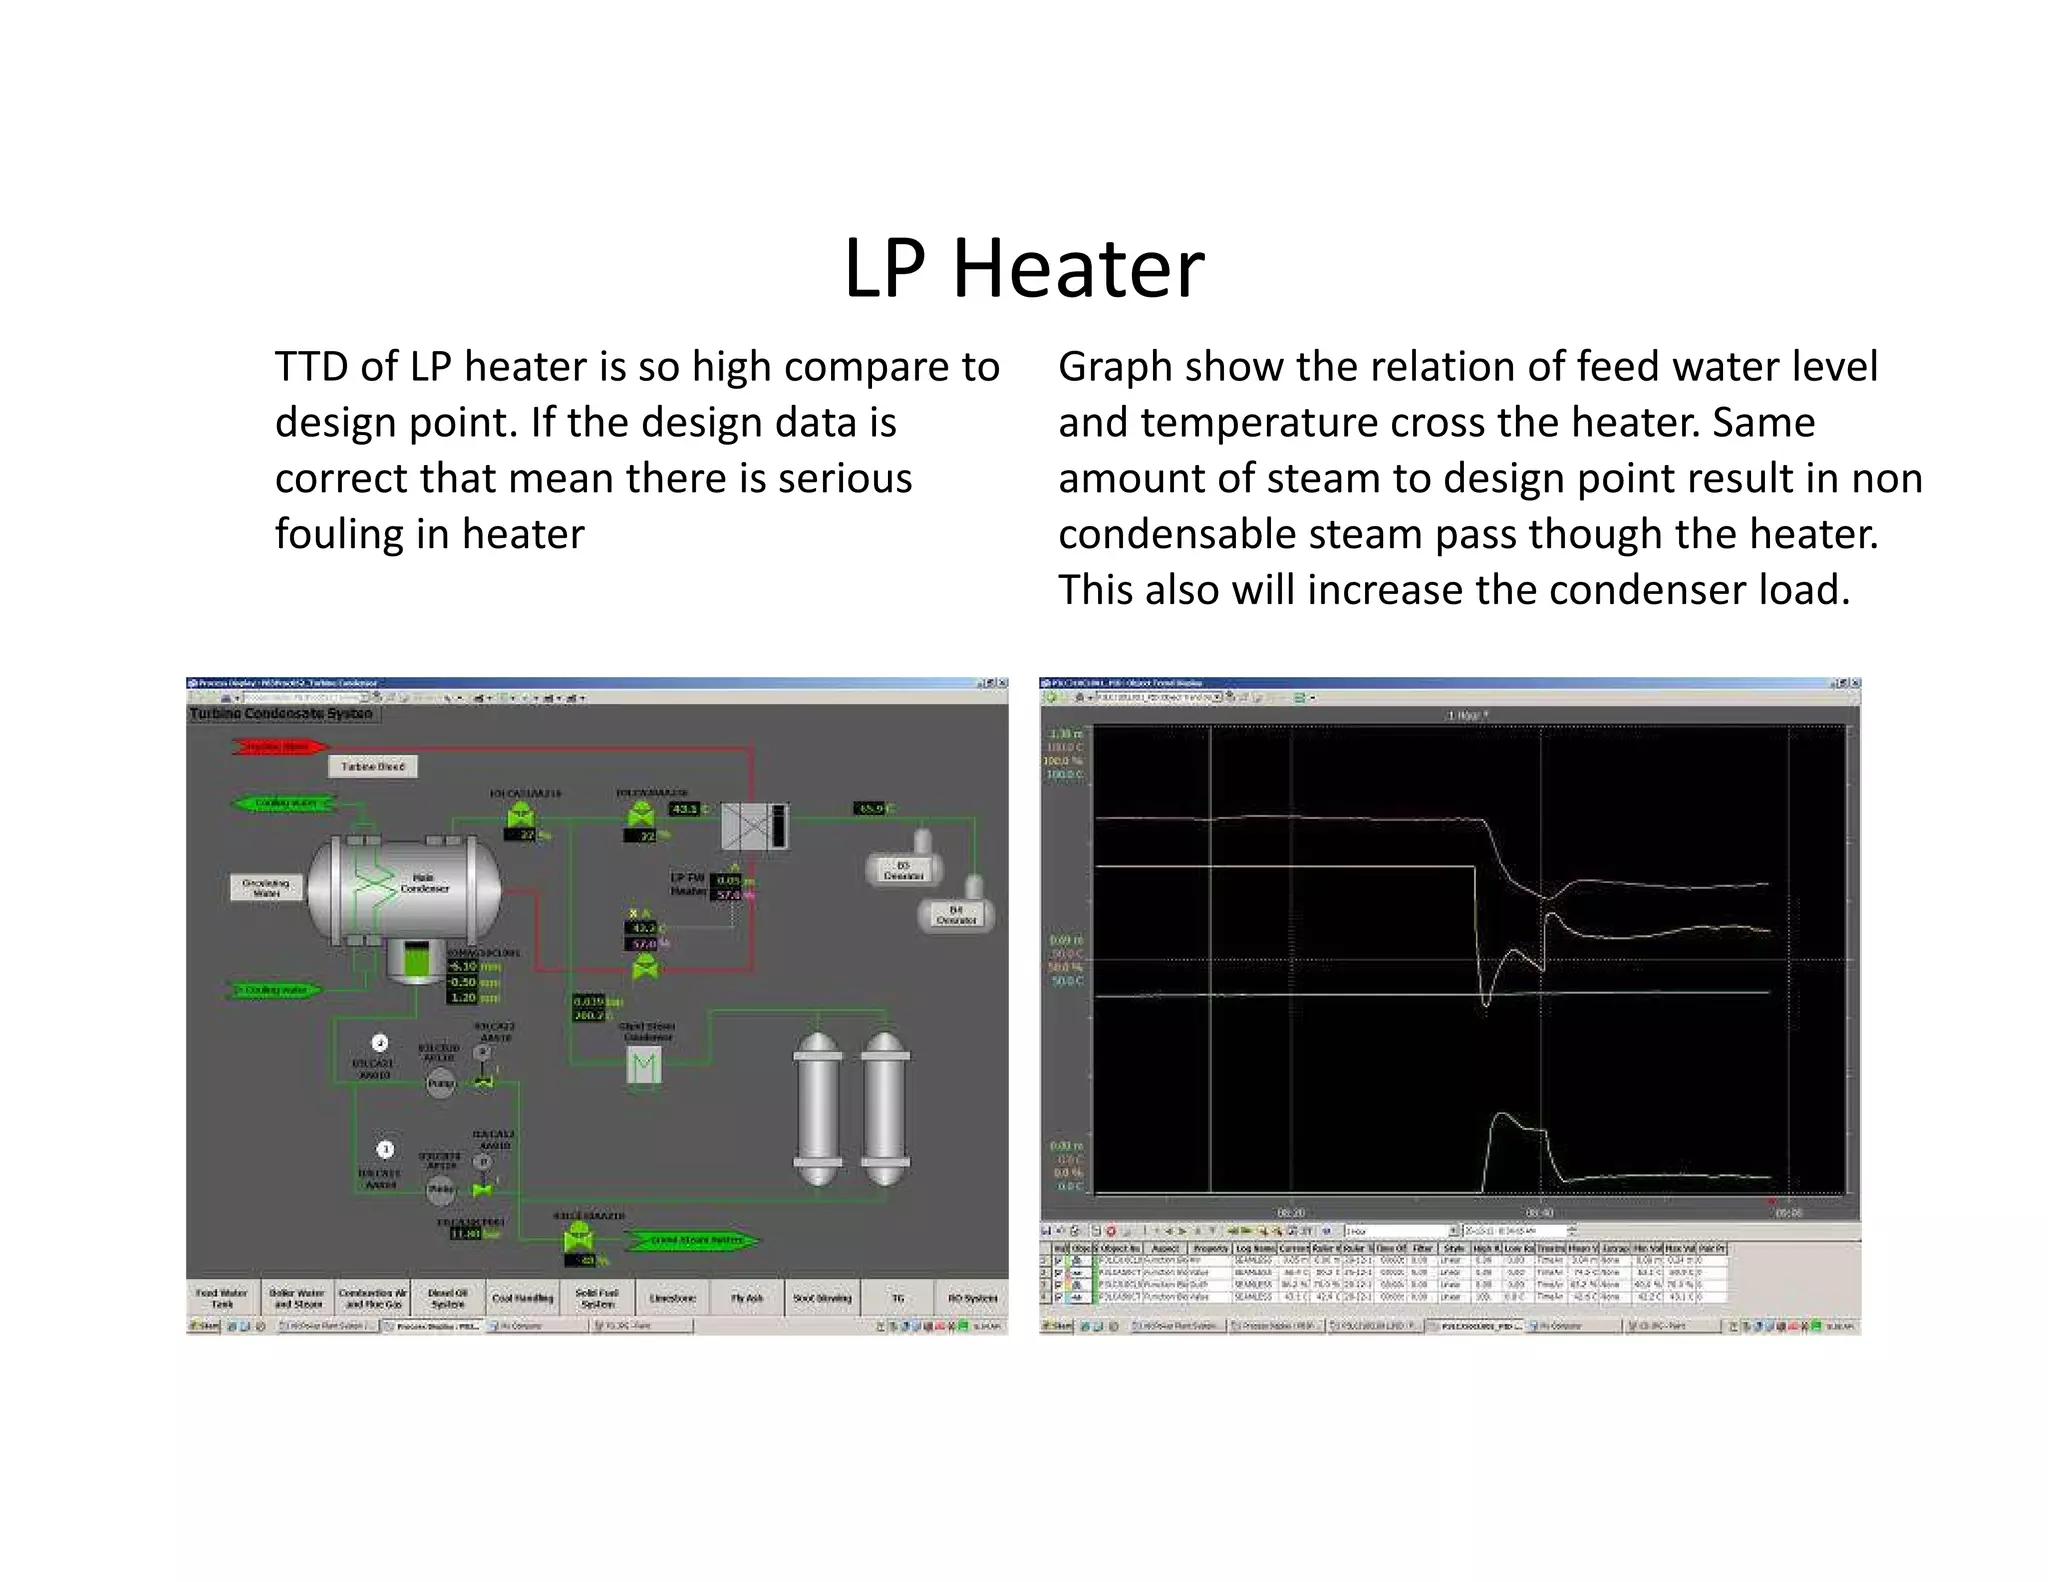
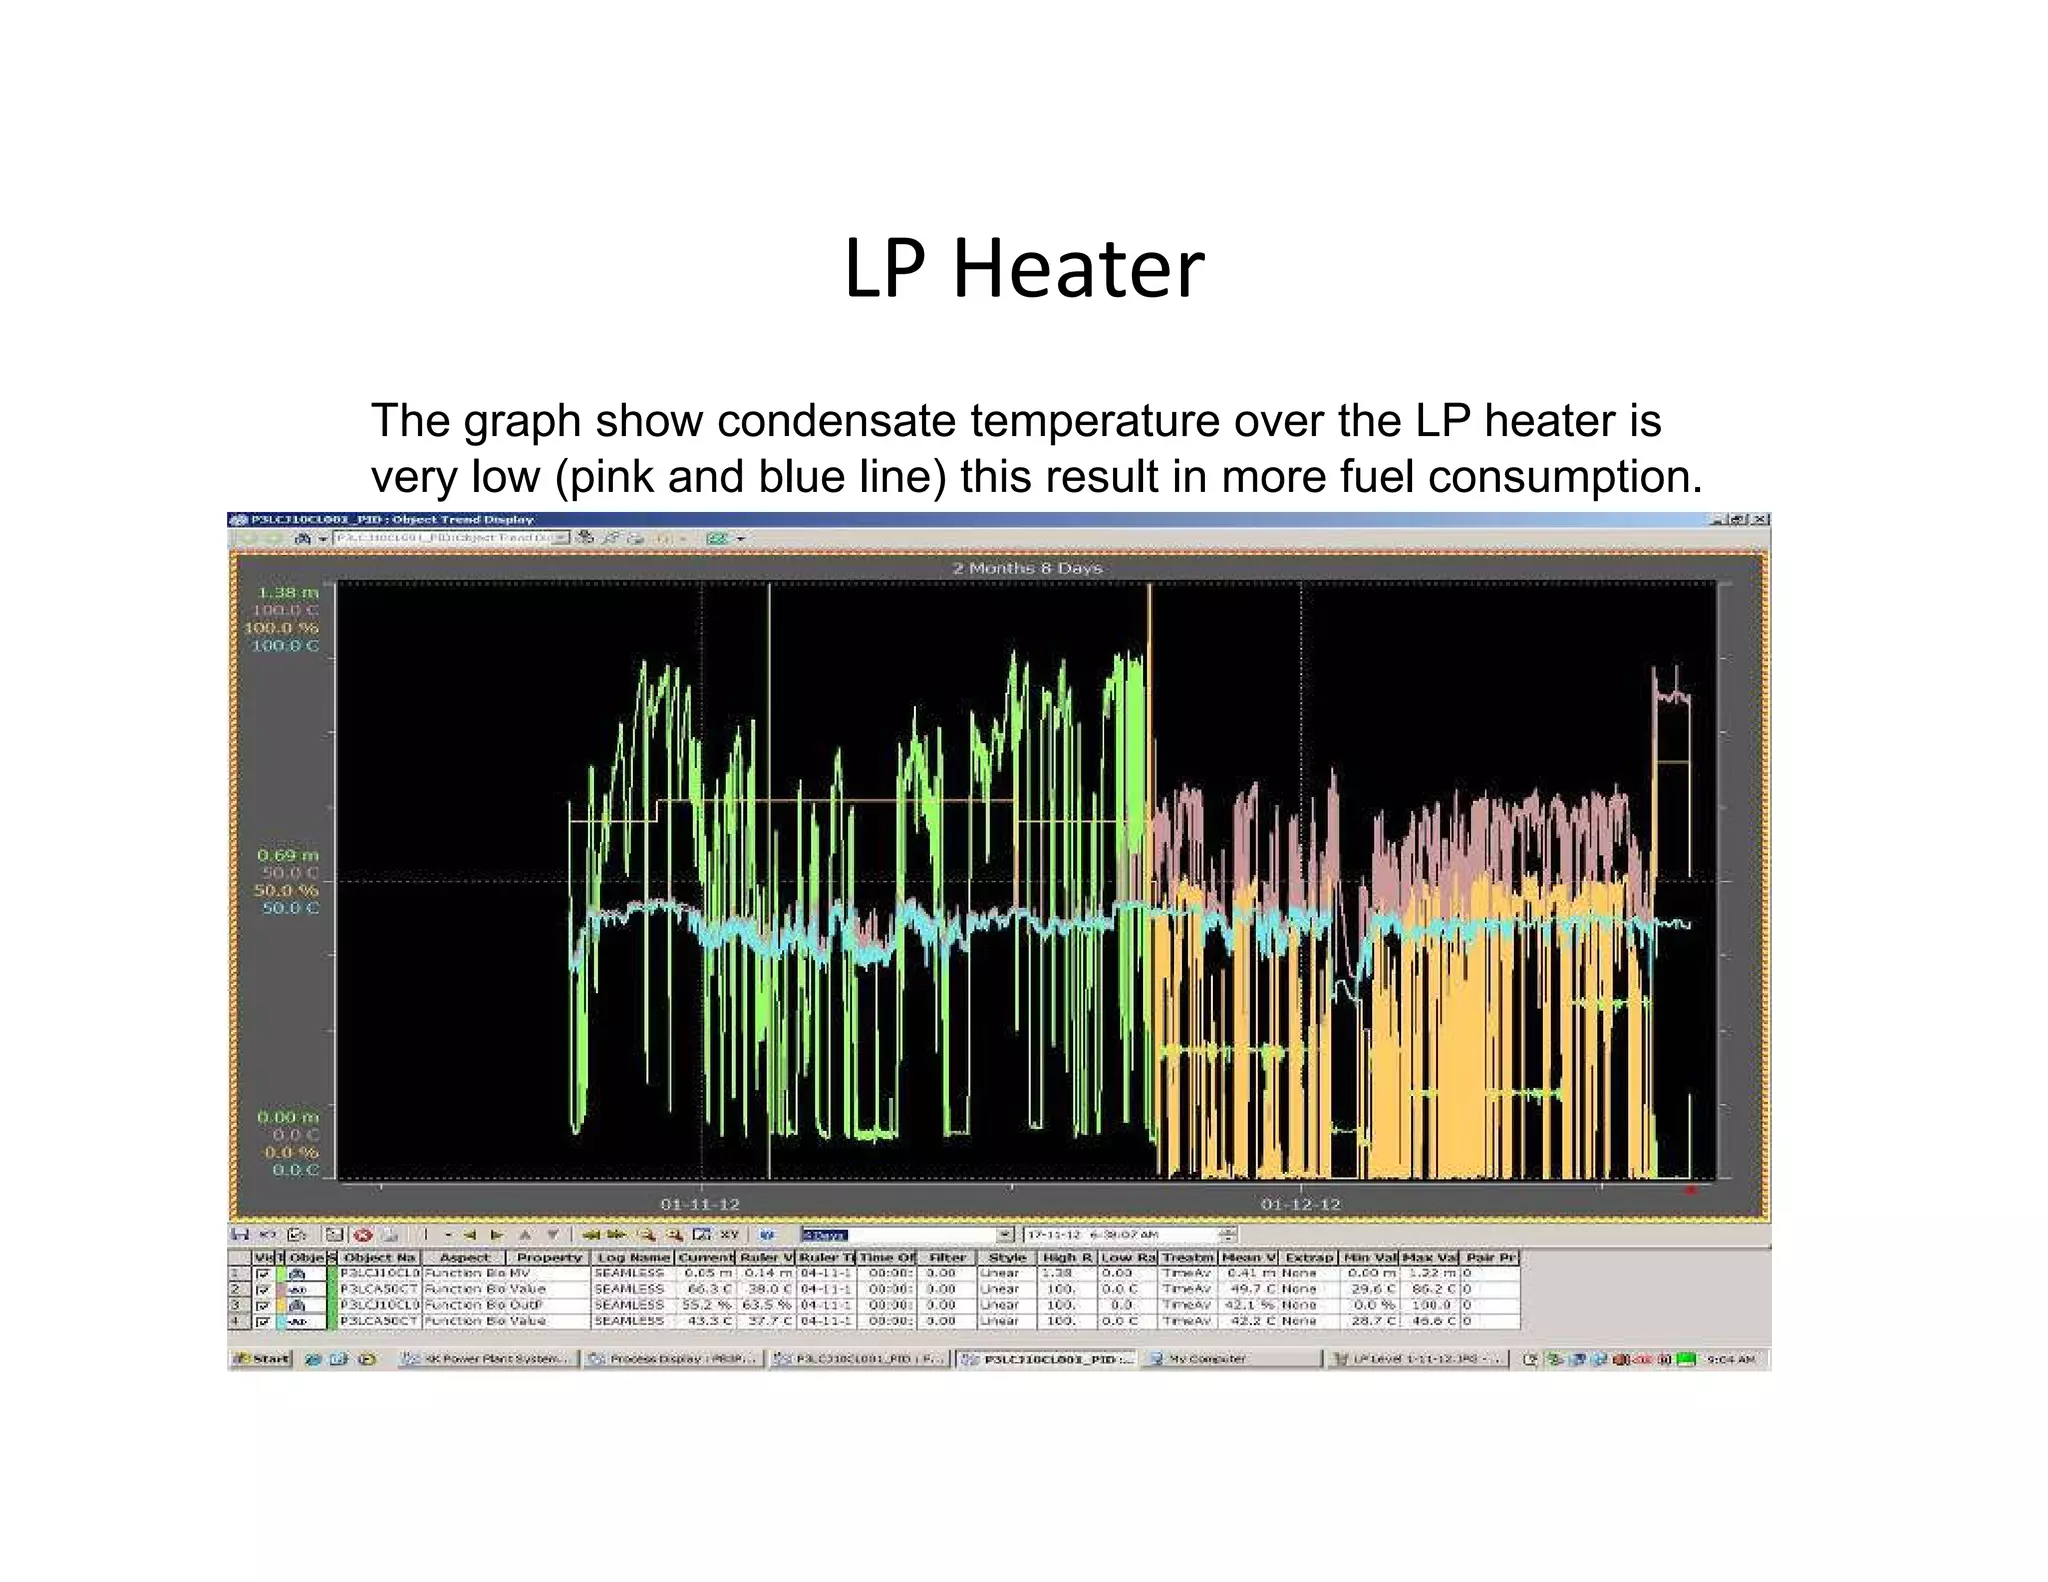

- The steam turbine was modeled using operational data to validate its performance against design specifications. The validated model was then used to analyze current performance and assess potential issues like fouling, blade deposits, and valve deterioration. - Analysis found the turbine was producing less power than designed and extraction temperatures were higher, indicating leaks into the low pressure stage from blade deposits or damage. Clearances between blades and casing had also increased. - Inspection of the low pressure feedwater heater found serious fouling, high metal temperatures, and poor condensate temperatures, reducing efficiency and increasing fuel use. Earlier performance analysis could help plan maintenance and repairs.


