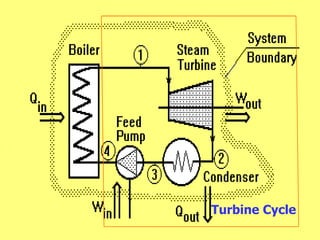
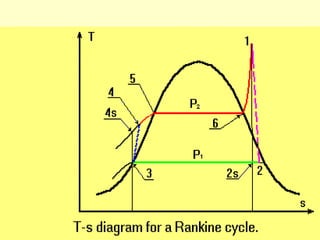
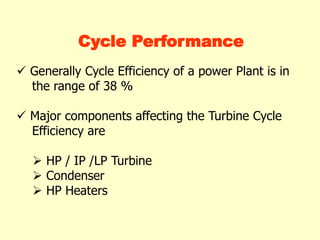
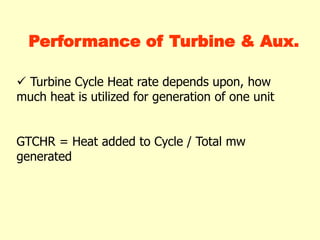
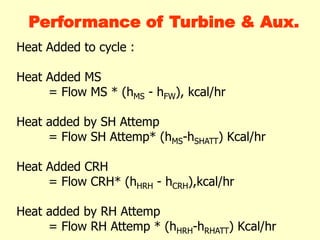
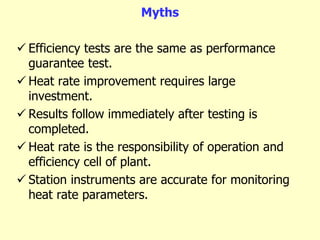
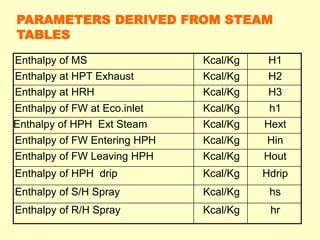
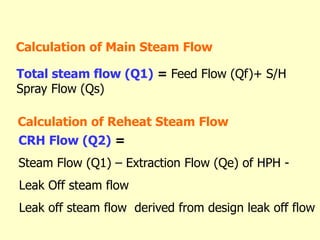
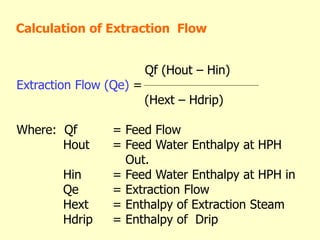
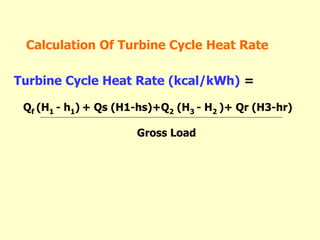
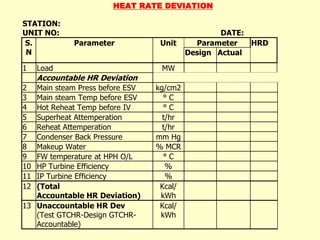
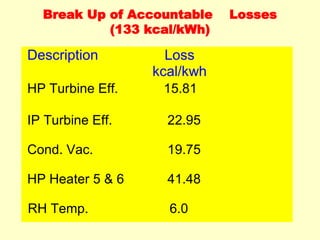
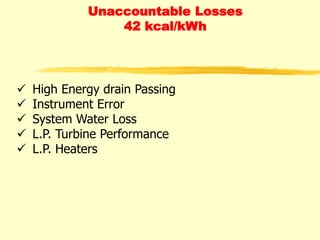
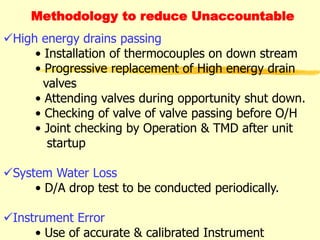
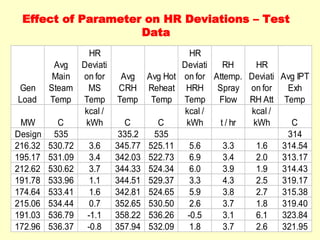
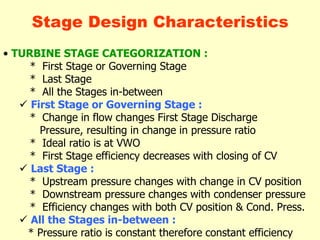
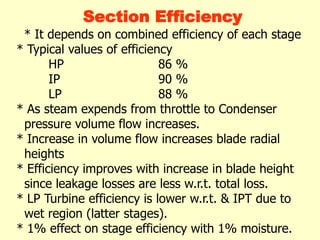
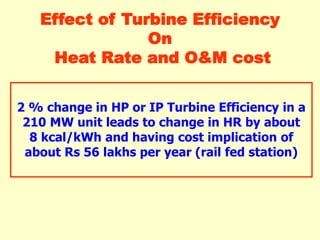
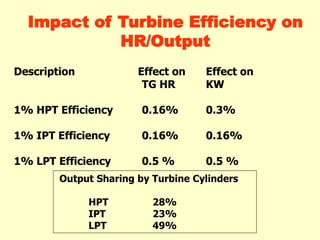
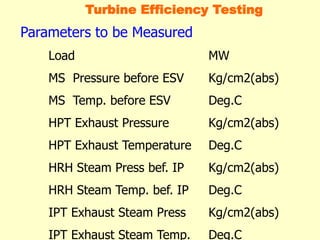
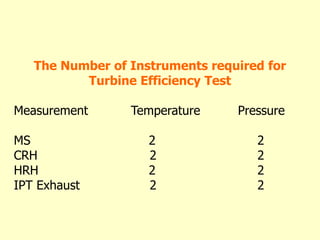
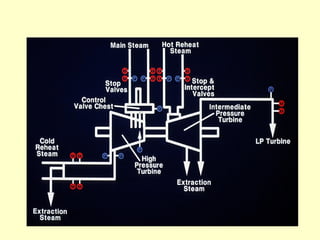
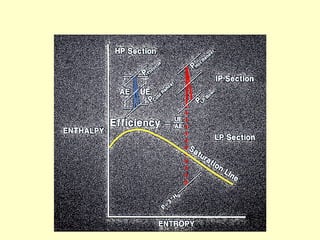
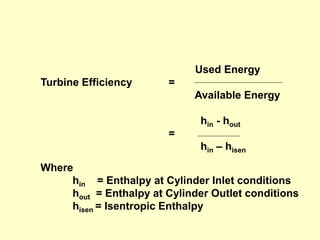
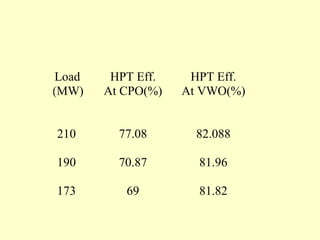
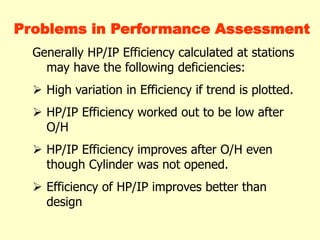
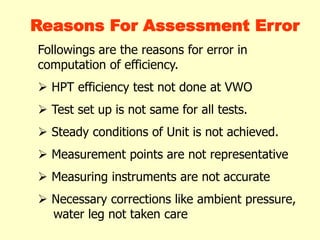
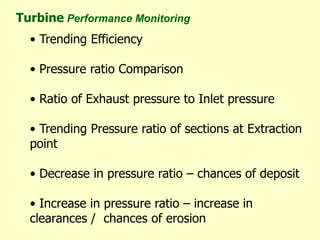
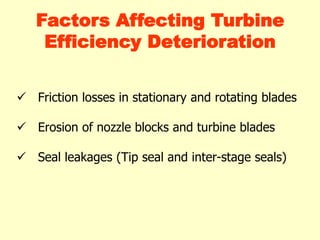
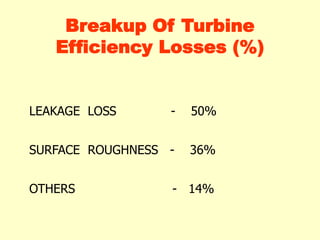
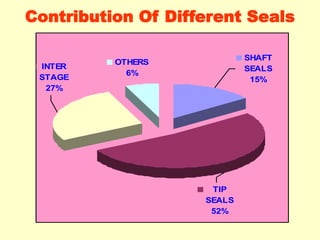
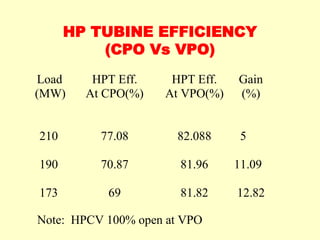
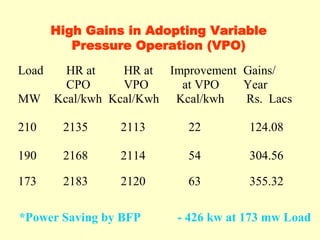
TURBINE PERFORMANCE
“total output power solutions”
By
Manohar Tatwawadi
Pune, 411045
Turbine Cycle
 Generally Cycle Efficiency of a power Plant is in
the range of 38 %
 Major components affecting the Turbine Cycle
Efficiency are
 HP / IP /LP Turbine
 Condenser
 HP Heaters
Cycle Performance
TURBINE CYCLE
HEAT RATE
 Turbine Cycle Heat rate depends upon, how
much heat is utilized for generation of one unit
GTCHR = Heat added to Cycle / Total mw
generated
Performance of Turbine & Aux.
Heat Added to cycle :
Heat Added MS
= Flow MS * (hMS - hFW), kcal/hr
Heat added by SH Attemp
= Flow SH Attemp* (hMS-hSHATT) Kcal/hr
Heat Added CRH
= Flow CRH* (hHRH - hCRH),kcal/hr
Heat added by RH Attemp
= Flow RH Attemp * (hHRH-hRHATT) Kcal/hr
Performance of Turbine & Aux.
How to Know Turbine Cycle Heat Rate ?
Turbine Cycle Heat Rate can be calculated
based upon
1. On line Instrument Testing
2. Off line Instrument Testing
Myth about Efficiency Testing ?
Myths
 Efficiency tests are the same as performance
guarantee test.
 Heat rate improvement requires large
investment.
 Results follow immediately after testing is
completed.
 Heat rate is the responsibility of operation and
efficiency cell of plant.
 Station instruments are accurate for monitoring
heat rate parameters.
Myths contd…
 Efficiency tests require deployment of large
manpower.
 Renovation and modernization (R&M) will take care of
efficiency and should precede any heat rate
improvement efforts by plant.
 Manufacturer has more knowledge of equipment and
should be involved in the efficiency test.
Turbine Cycle Testing
Instruments required for Turbine Cycle HR
Test
Measurement Temperature Pressure
MS 2 2
CRH 2 2
HRH 2 2
FW at Eco Inlet 1 1
FW Flow -- 1 (dp)
SH Spray -- 1 (dp)
RH Spray -- 1 (dp)
Unit Load -- --
1 Gross Load 13 FW Press HPH Inlet
2 MS Pressure before ESV 14 FW Temp HPH Inlet
3 MS Temp before ESV 15 FW Press HPH Outlet
4 HPT Exhaust Pressure 16 FW Temp HPH Outlet
5 HPT Exhaust Temp. 17 Main Steam Flow (Q1)
6 HRH Steam Press. before IV 18 Feed Water Flow (Qf)
7 HRH Steam Temp. before IV 19 CRH Flow (Q2)
8 FW press after top heater 20 S/H Spray Flow (Qs)
9 FW Temp at Eco inlet 21 R/H Spray Flow (Qr)
10 HPH Ext. Steam Temp 22 S/H Spray Temp.
11 HPH Shell Pressure 23 R/H Spray Temp.
12 HPH Drip Temp 24 Leak Off Flow
PARAMETERS TO BE MEASURED
Enthalpy of MS Kcal/Kg H1
Enthalpy at HPT Exhaust Kcal/Kg H2
Enthalpy at HRH Kcal/Kg H3
Enthalpy of FW at Eco.inlet Kcal/Kg h1
Enthalpy of HPH Ext Steam Kcal/Kg Hext
Enthalpy of FW Entering HPH Kcal/Kg Hin
Enthalpy of FW Leaving HPH Kcal/Kg Hout
Enthalpy of HPH drip Kcal/Kg Hdrip
Enthalpy of S/H Spray Kcal/Kg hs
Enthalpy of R/H Spray Kcal/Kg hr
PARAMETERS DERIVED FROM STEAM
TABLES
Total steam flow (Q1) = Feed Flow (Qf)+ S/H
Spray Flow (Qs)
Calculation of Main Steam Flow
Calculation of Reheat Steam Flow
CRH Flow (Q2) =
Steam Flow (Q1) – Extraction Flow (Qe) of HPH -
Leak Off steam flow
Leak off steam flow derived from design leak off flow
Qf (Hout – Hin)
Extraction Flow (Qe) =
(Hext – Hdrip)
Where: Qf = Feed Flow
Hout = Feed Water Enthalpy at HPH
Out.
Hin = Feed Water Enthalpy at HPH in
Qe = Extraction Flow
Hext = Enthalpy of Extraction Steam
Hdrip = Enthalpy of Drip
Calculation of Extraction Flow
Turbine Cycle Heat Rate (kcal/kWh) =
Qf (H1 - h1) + Qs (H1-hs)+Q2 (H3 - H2 )+ Qr (H3-hr)
Gross Load
Calculation Of Turbine Cycle Heat Rate
Precautions to be taken
Test Conditions
 Unit Off Load Control and Steady
 Main Steam Pressure at Design Value
 Main Steam and Reheat Steam Temperatures at
Current Expected Value
 Boiler Outlet O2 at Current Expected Value
 All Feed water Heaters in Service, Normal Levels
and Vent Settings, Normal Drain Routing
 No Auxiliary Steam Cross Tie to Other Units.
 No Soot Blowing.
 Test Engineer to ensure the load is steady
Computation Error & Remedial action
Feed Flow :
One of the most important parameters measured in
any power plant is the fluid flow rate in the various
system and components. For Feed water flow there
are flow nozzles/orifice, the DP measurement
across the device is further used for flow
computation.
Flow measuring devices dp transmitter should be
calibrated every year.
Power Measurement :
Other most important parameters is the power
measurement . Power measuring devices should be
of high accuracy preferably 0.2 % accuracy class.
Test Result
Test GTCHR – 2156 kcal/kWh
Design GTCHR- 1981 kcal/kWh
Gap-175 kcal/kWh
Type of Losses
Accountable Loss- 133 kcal/kWh
Un accountable Loss – 42 kcal/kWh
HEAT RATE DEVIATION
STATION:
UNIT NO: DATE:
ParameterS.
N
Parameter Unit
Design Actual
HRD
1 Load MW
Accountable HR Deviation
2 Main steam Press before ESV kg/cm2
3 Main steam Temp before ESV ° C
4 Hot Reheat Temp before IV ° C
5 Superheat Attemperation t/hr
6 Reheat Attemperation t/hr
7 Condenser Back Pressure mm Hg
8 Makeup Water % MCR
9 FW temperature at HPH O/L ° C
10 HP Turbine Efficiency %
11 IP Turbine Efficiency %
12 (Total
Accountable HR Deviation)
Kcal/
kWh
13 Unaccountable HR Dev
(Test GTCHR-Design GTCHR-
Accountable)
Kcal/
kWh
Break Up of Accountable Losses
(133 kcal/kWh)
Description Loss
kcal/kwh
HP Turbine Eff. 15.81
IP Turbine Eff. 22.95
Cond. Vac. 19.75
HP Heater 5 & 6 41.48
RH Temp. 6.0
Unaccountable Losses
42 kcal/kWh
 High Energy drain Passing
 Instrument Error
 System Water Loss
 L.P. Turbine Performance
 L.P. Heaters
Methodology to reduce Unaccountable
High energy drains passing
• Installation of thermocouples on down stream
• Progressive replacement of High energy drain
valves
• Attending valves during opportunity shut down.
• Checking of valve of valve passing before O/H
• Joint checking by Operation & TMD after unit
startup
System Water Loss
• D/A drop test to be conducted periodically.
Instrument Error
• Use of accurate & calibrated Instrument
Effect of Parameter on HR Deviations – Test
Data
Gen
Load
Avg
Main
Steam
Temp
HR
Deviati
on for
MS
Temp
Avg
CRH
Temp
Avg Hot
Reheat
Temp
HR
Deviati
on for
HRH
Temp
RH
Attemp.
Spray
Flow
HR
Deviati
on for
RH Att
Avg IPT
Exh
Temp
MW C
kcal /
kWh C C
kcal /
kWh t / hr
kcal /
kWh C
Design 535 335.2 535 314
216.32 530.72 3.6 345.77 525.11 5.6 3.3 1.6 314.54
195.17 531.09 3.4 342.03 522.73 6.9 3.4 2.0 313.17
212.62 530.62 3.7 344.33 524.34 6.0 3.9 1.9 314.43
191.78 533.96 1.1 344.51 529.37 3.3 4.3 2.5 319.17
174.64 533.41 1.6 342.81 524.65 5.9 3.8 2.7 315.38
215.06 534.44 0.7 352.65 530.50 2.6 3.7 1.8 319.40
191.03 536.79 -1.1 358.22 536.26 -0.5 3.1 6.1 323.84
172.96 536.37 -0.8 357.94 532.09 1.8 3.7 2.6 321.95
HP/IP/LP Turbine
Efficiency
STEAM TURBINES ARE DEVICES WHICH CONVERT
THE ENERGY STORED IN STEAM INTO
ROTATIONAL MECHANICAL ENERGY.
First step is expansion of steam in nozzles, which
convert some of this heat & pressure energy in to
kinetic energy of steam jet.
In second step kinetic energy of the jet is used
with moving blades to change that energy into
useful mechanical energy.
Steam Turbine
Typical Combination
• TURBINE STAGE CATEGORIZATION :
* First Stage or Governing Stage
* Last Stage
* All the Stages in-between
 First Stage or Governing Stage :
* Change in flow changes First Stage Discharge
Pressure, resulting in change in pressure ratio
* Ideal ratio is at VWO
* First Stage efficiency decreases with closing of CV
 Last Stage :
* Upstream pressure changes with change in CV position
* Downstream pressure changes with condenser pressure
* Efficiency changes with both CV position & Cond. Press.
 All the Stages in-between :
* Pressure ratio is constant therefore constant efficiency
Stage Design Characteristics
Section Efficiency
* It depends on combined efficiency of each stage
* Typical values of efficiency
HP 86 %
IP 90 %
LP 88 %
* As steam expends from throttle to Condenser
pressure volume flow increases.
* Increase in volume flow increases blade radial
heights
* Efficiency improves with increase in blade height
since leakage losses are less w.r.t. total loss.
* LP Turbine efficiency is lower w.r.t. & IPT due to
wet region (latter stages).
* 1% effect on stage efficiency with 1% moisture.
2 % change in HP or IP Turbine Efficiency in a
210 MW unit leads to change in HR by about
8 kcal/kWh and having cost implication of
about Rs 56 lakhs per year (rail fed station)
Effect of Turbine Efficiency
On
Heat Rate and O&M cost
Description Effect on Effect on
TG HR KW
1% HPT Efficiency 0.16% 0.3%
1% IPT Efficiency 0.16% 0.16%
1% LPT Efficiency 0.5 % 0.5 %
Output Sharing by Turbine Cylinders
HPT 28%
IPT 23%
LPT 49%
Impact of Turbine Efficiency on
HR/Output
Turbine
Performance
Assesment
Parameters to be Measured
Load MW
MS Pressure before ESV Kg/cm2(abs)
MS Temp. before ESV Deg.C
HPT Exhaust Pressure Kg/cm2(abs)
HPT Exhaust Temperature Deg.C
HRH Steam Press bef. IP Kg/cm2(abs)
HRH Steam Temp. bef. IP Deg.C
IPT Exhaust Steam Press Kg/cm2(abs)
IPT Exhaust Steam Temp. Deg.C
Turbine Efficiency Testing
The Number of Instruments required for
Turbine Efficiency Test
Measurement Temperature Pressure
MS 2 2
CRH 2 2
HRH 2 2
IPT Exhaust 2 2
Used Energy
Turbine Efficiency =
Available Energy
hin - hout
=
hin – hisen
Where
hin = Enthalpy at Cylinder Inlet conditions
hout = Enthalpy at Cylinder Outlet conditions
hisen = Isentropic Enthalpy
Load
(MW)
210
HPT Eff.
At CPO(%)
77.08
HPT Eff.
At VWO(%)
82.088
190 70.87 81.96
173 69 81.82
Problems in Performance Assessment
Generally HP/IP Efficiency calculated at stations
may have the following deficiencies:
 High variation in Efficiency if trend is plotted.
 HP/IP Efficiency worked out to be low after
O/H
 HP/IP Efficiency improves after O/H even
though Cylinder was not opened.
 Efficiency of HP/IP improves better than
design
Reasons For Assessment Error
Followings are the reasons for error in
computation of efficiency.
 HPT efficiency test not done at VWO
 Test set up is not same for all tests.
 Steady conditions of Unit is not achieved.
 Measurement points are not representative
 Measuring instruments are not accurate
 Necessary corrections like ambient pressure,
water leg not taken care
• Trending Efficiency
• Pressure ratio Comparison
• Ratio of Exhaust pressure to Inlet pressure
• Trending Pressure ratio of sections at Extraction
point
• Decrease in pressure ratio – chances of deposit
• Increase in pressure ratio – increase in
clearances / chances of erosion
Turbine Performance Monitoring
 Friction losses in stationary and rotating blades
 Erosion of nozzle blocks and turbine blades
 Seal leakages (Tip seal and inter-stage seals)
Factors Affecting Turbine
Efficiency Deterioration
LEAKAGE LOSS - 50%
SURFACE ROUGHNESS - 36%
OTHERS - 14%
Breakup Of Turbine
Efficiency Losses (%)
OTHERS
6%
SHAFT
SEALS
15%
INTER
STAGE
27%
TIP
SEALS
52%
Contribution Of Different Seals
DIAPHRAGM
TIP
SPILL STRIPS
BALANCE HOLE
W HEEL
PACKING
SHAFT
STEAM FLOW
ROOT
SPILL STRIPS
ROTATING
BLADE
STATIONARY
BLADESTAGE
PRESSURE
DOVETAIL
INTERSTAGE PACKING LEAKAGE
BALANCE HOLE
FLOW
ROOT LEAKAGE
TIP
LEAKAGE
COVER OR
SHROUD
TENON
Impulse Wheel and Diaphragm
Construction
ROTOR
TRAILING
EDGE
BLADE
CARRIER
LEADING
EDGE
INTERSTAGE
PACKING
TIP SPILL
STRIPS
STATIONARY
BLADE
ROTATING
BLADE
TENONTIP
LEAKAGE
COVER
Reaction Drum Rotor
Construction
Identification Of
Area Of Losses
Steam Path Audit
What is a Steam Path Audit?
A detailed inspection of the stationary and
rotating steam path components
An accounting of performance losses on a
stage-by-stage basis
Benefits of a SPA
√Provides detailed inspection of steam path
√Repair/replacement decisions, early in
outage
√Aid decisions for future repair
√Provides excellent record/history of
equipment condition for future reference
The specific areas of concern addressed
by the audit are:
1) Leakages:
- past stationary stage blading
- past rotating stage blading
- past shaft end packings where
rotors emerge from casings
- across poorly fitting joints
- other miscellaneous leakages
3) Flow blockages from:
- deposits
- foreign objects
- mechanical damage
2) Surface finish degradation:
- deposits
- corrosion
- solid particle erosion
- mechanical damage
4) Flow path modification
from:
- solid particle erosion
- water droplet erosion
- mechanical damage
√ Inspect casing horizontal joint for leakage paths
√ Measure blade geometry
√ Measure packing teeth, interstage, tip, root, and
& shaft end
Measurements & Observations
Casing Lifted
√Chart rotor for actual radial clearances
 Inter stage packings
 Shaft end packings
 Root spill strip clearances
 Tip spill strip clearances
Before Lifting Rotor
Measurements & Observations
√Measure lower half tooth heights
 Inter stage packing and shaft end packing
 Root and tip spill strips
√Inspect lower half diaphragms
 Surface roughness
 Solid particle erosion
 Mechanical damage
After Lifting Rotor
Measurements & Observations
Rotor
√Inspect rotating blades
Surface finish
Solid particle erosion
Mechanical damage
Cover deposits
Measurements & Observations
Geometric Data
√ Geometric data for the steam path must be
obtained to properly model turbine
Blade heights and widths
Blade root diameters
Balance holes
Measurements & Observations
Case Studies
HP/IP Turbine Efficiency Testing
HP Turbine Efficiency
 HPT Efficiency as per (HBD) 86.71%
 HPT Efficiency as per Test Data 82.08%
 Deterioration in HPT Efficiency 04.08%
IP Turbine Efficiency
√ IPT Efficiency as per HBD 90.58%
√ IPT Efficiency as per Test Data 81.62%
√ Deterioration in IPT Efficiency 8.96%
Turbine Efficiency Vs CV Position – Test
Data
Gen
Load
HP
Turbine
Efficiency
IP Turbine
Efficiency
CV
Position
MW % % %
Design 86.71 90.58 VWO
Run 1- CP 216.32 78.40 81.88 42/74
Run 2- CP 195.17 73.54 81.40 34/58
Run 3- CP 212.62 77.08 81.68 40/70
Run 4- CP 191.78 70.87 81.21 32/55
Run 5- CP 174.64 69.00 80.64 30/50
Run 1- VP 215.06 82.08 81.62 100
Run 2- VP 191.03 81.96 81.40 100
Run 3- VP 172.96 81.82 80.21 100
HP TUBINE EFFICIENCY
(CPO Vs VPO)
Load
(MW)
210
HPT Eff.
At CPO(%)
77.08
HPT Eff.
At VPO(%)
82.088
Gain
(%)
5
190 70.87 81.96 11.09
173 69 81.82 12.82
Note: HPCV 100% open at VPO
Load
MW
HR at
CPO
Kcal/kwh
HR at
VPO
Kcal/Kwh
Improvement
at VPO
Kcal/kwh
Gains/
Year
Rs. Lacs
210 2135 2113 22 124.08
190 2168 2114 54 304.56
173 2183 2120 63 355.32
High Gains in Adopting Variable
Pressure Operation (VPO)
*Power Saving by BFP - 426 kw at 173 mw Load
Thank You
Questions
Please ..

Steam Turbine Performance in TPS

  • 1.
    TURBINE PERFORMANCE “total outputpower solutions” By Manohar Tatwawadi Pune, 411045
  • 2.
  • 4.
     Generally CycleEfficiency of a power Plant is in the range of 38 %  Major components affecting the Turbine Cycle Efficiency are  HP / IP /LP Turbine  Condenser  HP Heaters Cycle Performance
  • 5.
  • 6.
     Turbine CycleHeat rate depends upon, how much heat is utilized for generation of one unit GTCHR = Heat added to Cycle / Total mw generated Performance of Turbine & Aux.
  • 7.
    Heat Added tocycle : Heat Added MS = Flow MS * (hMS - hFW), kcal/hr Heat added by SH Attemp = Flow SH Attemp* (hMS-hSHATT) Kcal/hr Heat Added CRH = Flow CRH* (hHRH - hCRH),kcal/hr Heat added by RH Attemp = Flow RH Attemp * (hHRH-hRHATT) Kcal/hr Performance of Turbine & Aux.
  • 8.
    How to KnowTurbine Cycle Heat Rate ?
  • 9.
    Turbine Cycle HeatRate can be calculated based upon 1. On line Instrument Testing 2. Off line Instrument Testing
  • 10.
  • 11.
    Myths  Efficiency testsare the same as performance guarantee test.  Heat rate improvement requires large investment.  Results follow immediately after testing is completed.  Heat rate is the responsibility of operation and efficiency cell of plant.  Station instruments are accurate for monitoring heat rate parameters.
  • 12.
    Myths contd…  Efficiencytests require deployment of large manpower.  Renovation and modernization (R&M) will take care of efficiency and should precede any heat rate improvement efforts by plant.  Manufacturer has more knowledge of equipment and should be involved in the efficiency test.
  • 13.
  • 14.
    Instruments required forTurbine Cycle HR Test Measurement Temperature Pressure MS 2 2 CRH 2 2 HRH 2 2 FW at Eco Inlet 1 1 FW Flow -- 1 (dp) SH Spray -- 1 (dp) RH Spray -- 1 (dp) Unit Load -- --
  • 16.
    1 Gross Load13 FW Press HPH Inlet 2 MS Pressure before ESV 14 FW Temp HPH Inlet 3 MS Temp before ESV 15 FW Press HPH Outlet 4 HPT Exhaust Pressure 16 FW Temp HPH Outlet 5 HPT Exhaust Temp. 17 Main Steam Flow (Q1) 6 HRH Steam Press. before IV 18 Feed Water Flow (Qf) 7 HRH Steam Temp. before IV 19 CRH Flow (Q2) 8 FW press after top heater 20 S/H Spray Flow (Qs) 9 FW Temp at Eco inlet 21 R/H Spray Flow (Qr) 10 HPH Ext. Steam Temp 22 S/H Spray Temp. 11 HPH Shell Pressure 23 R/H Spray Temp. 12 HPH Drip Temp 24 Leak Off Flow PARAMETERS TO BE MEASURED
  • 17.
    Enthalpy of MSKcal/Kg H1 Enthalpy at HPT Exhaust Kcal/Kg H2 Enthalpy at HRH Kcal/Kg H3 Enthalpy of FW at Eco.inlet Kcal/Kg h1 Enthalpy of HPH Ext Steam Kcal/Kg Hext Enthalpy of FW Entering HPH Kcal/Kg Hin Enthalpy of FW Leaving HPH Kcal/Kg Hout Enthalpy of HPH drip Kcal/Kg Hdrip Enthalpy of S/H Spray Kcal/Kg hs Enthalpy of R/H Spray Kcal/Kg hr PARAMETERS DERIVED FROM STEAM TABLES
  • 18.
    Total steam flow(Q1) = Feed Flow (Qf)+ S/H Spray Flow (Qs) Calculation of Main Steam Flow Calculation of Reheat Steam Flow CRH Flow (Q2) = Steam Flow (Q1) – Extraction Flow (Qe) of HPH - Leak Off steam flow Leak off steam flow derived from design leak off flow
  • 19.
    Qf (Hout –Hin) Extraction Flow (Qe) = (Hext – Hdrip) Where: Qf = Feed Flow Hout = Feed Water Enthalpy at HPH Out. Hin = Feed Water Enthalpy at HPH in Qe = Extraction Flow Hext = Enthalpy of Extraction Steam Hdrip = Enthalpy of Drip Calculation of Extraction Flow
  • 20.
    Turbine Cycle HeatRate (kcal/kWh) = Qf (H1 - h1) + Qs (H1-hs)+Q2 (H3 - H2 )+ Qr (H3-hr) Gross Load Calculation Of Turbine Cycle Heat Rate
  • 21.
    Precautions to betaken Test Conditions  Unit Off Load Control and Steady  Main Steam Pressure at Design Value  Main Steam and Reheat Steam Temperatures at Current Expected Value  Boiler Outlet O2 at Current Expected Value  All Feed water Heaters in Service, Normal Levels and Vent Settings, Normal Drain Routing  No Auxiliary Steam Cross Tie to Other Units.  No Soot Blowing.  Test Engineer to ensure the load is steady
  • 22.
    Computation Error &Remedial action Feed Flow : One of the most important parameters measured in any power plant is the fluid flow rate in the various system and components. For Feed water flow there are flow nozzles/orifice, the DP measurement across the device is further used for flow computation. Flow measuring devices dp transmitter should be calibrated every year. Power Measurement : Other most important parameters is the power measurement . Power measuring devices should be of high accuracy preferably 0.2 % accuracy class.
  • 23.
    Test Result Test GTCHR– 2156 kcal/kWh Design GTCHR- 1981 kcal/kWh Gap-175 kcal/kWh
  • 24.
    Type of Losses AccountableLoss- 133 kcal/kWh Un accountable Loss – 42 kcal/kWh
  • 25.
    HEAT RATE DEVIATION STATION: UNITNO: DATE: ParameterS. N Parameter Unit Design Actual HRD 1 Load MW Accountable HR Deviation 2 Main steam Press before ESV kg/cm2 3 Main steam Temp before ESV ° C 4 Hot Reheat Temp before IV ° C 5 Superheat Attemperation t/hr 6 Reheat Attemperation t/hr 7 Condenser Back Pressure mm Hg 8 Makeup Water % MCR 9 FW temperature at HPH O/L ° C 10 HP Turbine Efficiency % 11 IP Turbine Efficiency % 12 (Total Accountable HR Deviation) Kcal/ kWh 13 Unaccountable HR Dev (Test GTCHR-Design GTCHR- Accountable) Kcal/ kWh
  • 26.
    Break Up ofAccountable Losses (133 kcal/kWh) Description Loss kcal/kwh HP Turbine Eff. 15.81 IP Turbine Eff. 22.95 Cond. Vac. 19.75 HP Heater 5 & 6 41.48 RH Temp. 6.0
  • 27.
    Unaccountable Losses 42 kcal/kWh High Energy drain Passing  Instrument Error  System Water Loss  L.P. Turbine Performance  L.P. Heaters
  • 28.
    Methodology to reduceUnaccountable High energy drains passing • Installation of thermocouples on down stream • Progressive replacement of High energy drain valves • Attending valves during opportunity shut down. • Checking of valve of valve passing before O/H • Joint checking by Operation & TMD after unit startup System Water Loss • D/A drop test to be conducted periodically. Instrument Error • Use of accurate & calibrated Instrument
  • 29.
    Effect of Parameteron HR Deviations – Test Data Gen Load Avg Main Steam Temp HR Deviati on for MS Temp Avg CRH Temp Avg Hot Reheat Temp HR Deviati on for HRH Temp RH Attemp. Spray Flow HR Deviati on for RH Att Avg IPT Exh Temp MW C kcal / kWh C C kcal / kWh t / hr kcal / kWh C Design 535 335.2 535 314 216.32 530.72 3.6 345.77 525.11 5.6 3.3 1.6 314.54 195.17 531.09 3.4 342.03 522.73 6.9 3.4 2.0 313.17 212.62 530.62 3.7 344.33 524.34 6.0 3.9 1.9 314.43 191.78 533.96 1.1 344.51 529.37 3.3 4.3 2.5 319.17 174.64 533.41 1.6 342.81 524.65 5.9 3.8 2.7 315.38 215.06 534.44 0.7 352.65 530.50 2.6 3.7 1.8 319.40 191.03 536.79 -1.1 358.22 536.26 -0.5 3.1 6.1 323.84 172.96 536.37 -0.8 357.94 532.09 1.8 3.7 2.6 321.95
  • 30.
  • 31.
    STEAM TURBINES AREDEVICES WHICH CONVERT THE ENERGY STORED IN STEAM INTO ROTATIONAL MECHANICAL ENERGY. First step is expansion of steam in nozzles, which convert some of this heat & pressure energy in to kinetic energy of steam jet. In second step kinetic energy of the jet is used with moving blades to change that energy into useful mechanical energy. Steam Turbine
  • 32.
  • 33.
    • TURBINE STAGECATEGORIZATION : * First Stage or Governing Stage * Last Stage * All the Stages in-between  First Stage or Governing Stage : * Change in flow changes First Stage Discharge Pressure, resulting in change in pressure ratio * Ideal ratio is at VWO * First Stage efficiency decreases with closing of CV  Last Stage : * Upstream pressure changes with change in CV position * Downstream pressure changes with condenser pressure * Efficiency changes with both CV position & Cond. Press.  All the Stages in-between : * Pressure ratio is constant therefore constant efficiency Stage Design Characteristics
  • 34.
    Section Efficiency * Itdepends on combined efficiency of each stage * Typical values of efficiency HP 86 % IP 90 % LP 88 % * As steam expends from throttle to Condenser pressure volume flow increases. * Increase in volume flow increases blade radial heights * Efficiency improves with increase in blade height since leakage losses are less w.r.t. total loss. * LP Turbine efficiency is lower w.r.t. & IPT due to wet region (latter stages). * 1% effect on stage efficiency with 1% moisture.
  • 35.
    2 % changein HP or IP Turbine Efficiency in a 210 MW unit leads to change in HR by about 8 kcal/kWh and having cost implication of about Rs 56 lakhs per year (rail fed station) Effect of Turbine Efficiency On Heat Rate and O&M cost
  • 36.
    Description Effect onEffect on TG HR KW 1% HPT Efficiency 0.16% 0.3% 1% IPT Efficiency 0.16% 0.16% 1% LPT Efficiency 0.5 % 0.5 % Output Sharing by Turbine Cylinders HPT 28% IPT 23% LPT 49% Impact of Turbine Efficiency on HR/Output
  • 37.
  • 38.
    Parameters to beMeasured Load MW MS Pressure before ESV Kg/cm2(abs) MS Temp. before ESV Deg.C HPT Exhaust Pressure Kg/cm2(abs) HPT Exhaust Temperature Deg.C HRH Steam Press bef. IP Kg/cm2(abs) HRH Steam Temp. bef. IP Deg.C IPT Exhaust Steam Press Kg/cm2(abs) IPT Exhaust Steam Temp. Deg.C Turbine Efficiency Testing
  • 39.
    The Number ofInstruments required for Turbine Efficiency Test Measurement Temperature Pressure MS 2 2 CRH 2 2 HRH 2 2 IPT Exhaust 2 2
  • 42.
    Used Energy Turbine Efficiency= Available Energy hin - hout = hin – hisen Where hin = Enthalpy at Cylinder Inlet conditions hout = Enthalpy at Cylinder Outlet conditions hisen = Isentropic Enthalpy
  • 43.
    Load (MW) 210 HPT Eff. At CPO(%) 77.08 HPTEff. At VWO(%) 82.088 190 70.87 81.96 173 69 81.82
  • 44.
    Problems in PerformanceAssessment Generally HP/IP Efficiency calculated at stations may have the following deficiencies:  High variation in Efficiency if trend is plotted.  HP/IP Efficiency worked out to be low after O/H  HP/IP Efficiency improves after O/H even though Cylinder was not opened.  Efficiency of HP/IP improves better than design
  • 45.
    Reasons For AssessmentError Followings are the reasons for error in computation of efficiency.  HPT efficiency test not done at VWO  Test set up is not same for all tests.  Steady conditions of Unit is not achieved.  Measurement points are not representative  Measuring instruments are not accurate  Necessary corrections like ambient pressure, water leg not taken care
  • 46.
    • Trending Efficiency •Pressure ratio Comparison • Ratio of Exhaust pressure to Inlet pressure • Trending Pressure ratio of sections at Extraction point • Decrease in pressure ratio – chances of deposit • Increase in pressure ratio – increase in clearances / chances of erosion Turbine Performance Monitoring
  • 47.
     Friction lossesin stationary and rotating blades  Erosion of nozzle blocks and turbine blades  Seal leakages (Tip seal and inter-stage seals) Factors Affecting Turbine Efficiency Deterioration
  • 48.
    LEAKAGE LOSS -50% SURFACE ROUGHNESS - 36% OTHERS - 14% Breakup Of Turbine Efficiency Losses (%)
  • 49.
  • 50.
    DIAPHRAGM TIP SPILL STRIPS BALANCE HOLE WHEEL PACKING SHAFT STEAM FLOW ROOT SPILL STRIPS ROTATING BLADE STATIONARY BLADESTAGE PRESSURE DOVETAIL INTERSTAGE PACKING LEAKAGE BALANCE HOLE FLOW ROOT LEAKAGE TIP LEAKAGE COVER OR SHROUD TENON Impulse Wheel and Diaphragm Construction
  • 51.
  • 52.
  • 53.
  • 54.
    What is aSteam Path Audit? A detailed inspection of the stationary and rotating steam path components An accounting of performance losses on a stage-by-stage basis
  • 55.
    Benefits of aSPA √Provides detailed inspection of steam path √Repair/replacement decisions, early in outage √Aid decisions for future repair √Provides excellent record/history of equipment condition for future reference
  • 56.
    The specific areasof concern addressed by the audit are: 1) Leakages: - past stationary stage blading - past rotating stage blading - past shaft end packings where rotors emerge from casings - across poorly fitting joints - other miscellaneous leakages 3) Flow blockages from: - deposits - foreign objects - mechanical damage 2) Surface finish degradation: - deposits - corrosion - solid particle erosion - mechanical damage 4) Flow path modification from: - solid particle erosion - water droplet erosion - mechanical damage
  • 57.
    √ Inspect casinghorizontal joint for leakage paths √ Measure blade geometry √ Measure packing teeth, interstage, tip, root, and & shaft end Measurements & Observations Casing Lifted
  • 58.
    √Chart rotor foractual radial clearances  Inter stage packings  Shaft end packings  Root spill strip clearances  Tip spill strip clearances Before Lifting Rotor Measurements & Observations
  • 59.
    √Measure lower halftooth heights  Inter stage packing and shaft end packing  Root and tip spill strips √Inspect lower half diaphragms  Surface roughness  Solid particle erosion  Mechanical damage After Lifting Rotor Measurements & Observations
  • 60.
    Rotor √Inspect rotating blades Surfacefinish Solid particle erosion Mechanical damage Cover deposits Measurements & Observations
  • 61.
    Geometric Data √ Geometricdata for the steam path must be obtained to properly model turbine Blade heights and widths Blade root diameters Balance holes Measurements & Observations
  • 62.
  • 63.
    HP/IP Turbine EfficiencyTesting HP Turbine Efficiency  HPT Efficiency as per (HBD) 86.71%  HPT Efficiency as per Test Data 82.08%  Deterioration in HPT Efficiency 04.08% IP Turbine Efficiency √ IPT Efficiency as per HBD 90.58% √ IPT Efficiency as per Test Data 81.62% √ Deterioration in IPT Efficiency 8.96%
  • 64.
    Turbine Efficiency VsCV Position – Test Data Gen Load HP Turbine Efficiency IP Turbine Efficiency CV Position MW % % % Design 86.71 90.58 VWO Run 1- CP 216.32 78.40 81.88 42/74 Run 2- CP 195.17 73.54 81.40 34/58 Run 3- CP 212.62 77.08 81.68 40/70 Run 4- CP 191.78 70.87 81.21 32/55 Run 5- CP 174.64 69.00 80.64 30/50 Run 1- VP 215.06 82.08 81.62 100 Run 2- VP 191.03 81.96 81.40 100 Run 3- VP 172.96 81.82 80.21 100
  • 65.
    HP TUBINE EFFICIENCY (CPOVs VPO) Load (MW) 210 HPT Eff. At CPO(%) 77.08 HPT Eff. At VPO(%) 82.088 Gain (%) 5 190 70.87 81.96 11.09 173 69 81.82 12.82 Note: HPCV 100% open at VPO
  • 66.
    Load MW HR at CPO Kcal/kwh HR at VPO Kcal/Kwh Improvement atVPO Kcal/kwh Gains/ Year Rs. Lacs 210 2135 2113 22 124.08 190 2168 2114 54 304.56 173 2183 2120 63 355.32 High Gains in Adopting Variable Pressure Operation (VPO) *Power Saving by BFP - 426 kw at 173 mw Load
  • 67.