Download to read offline


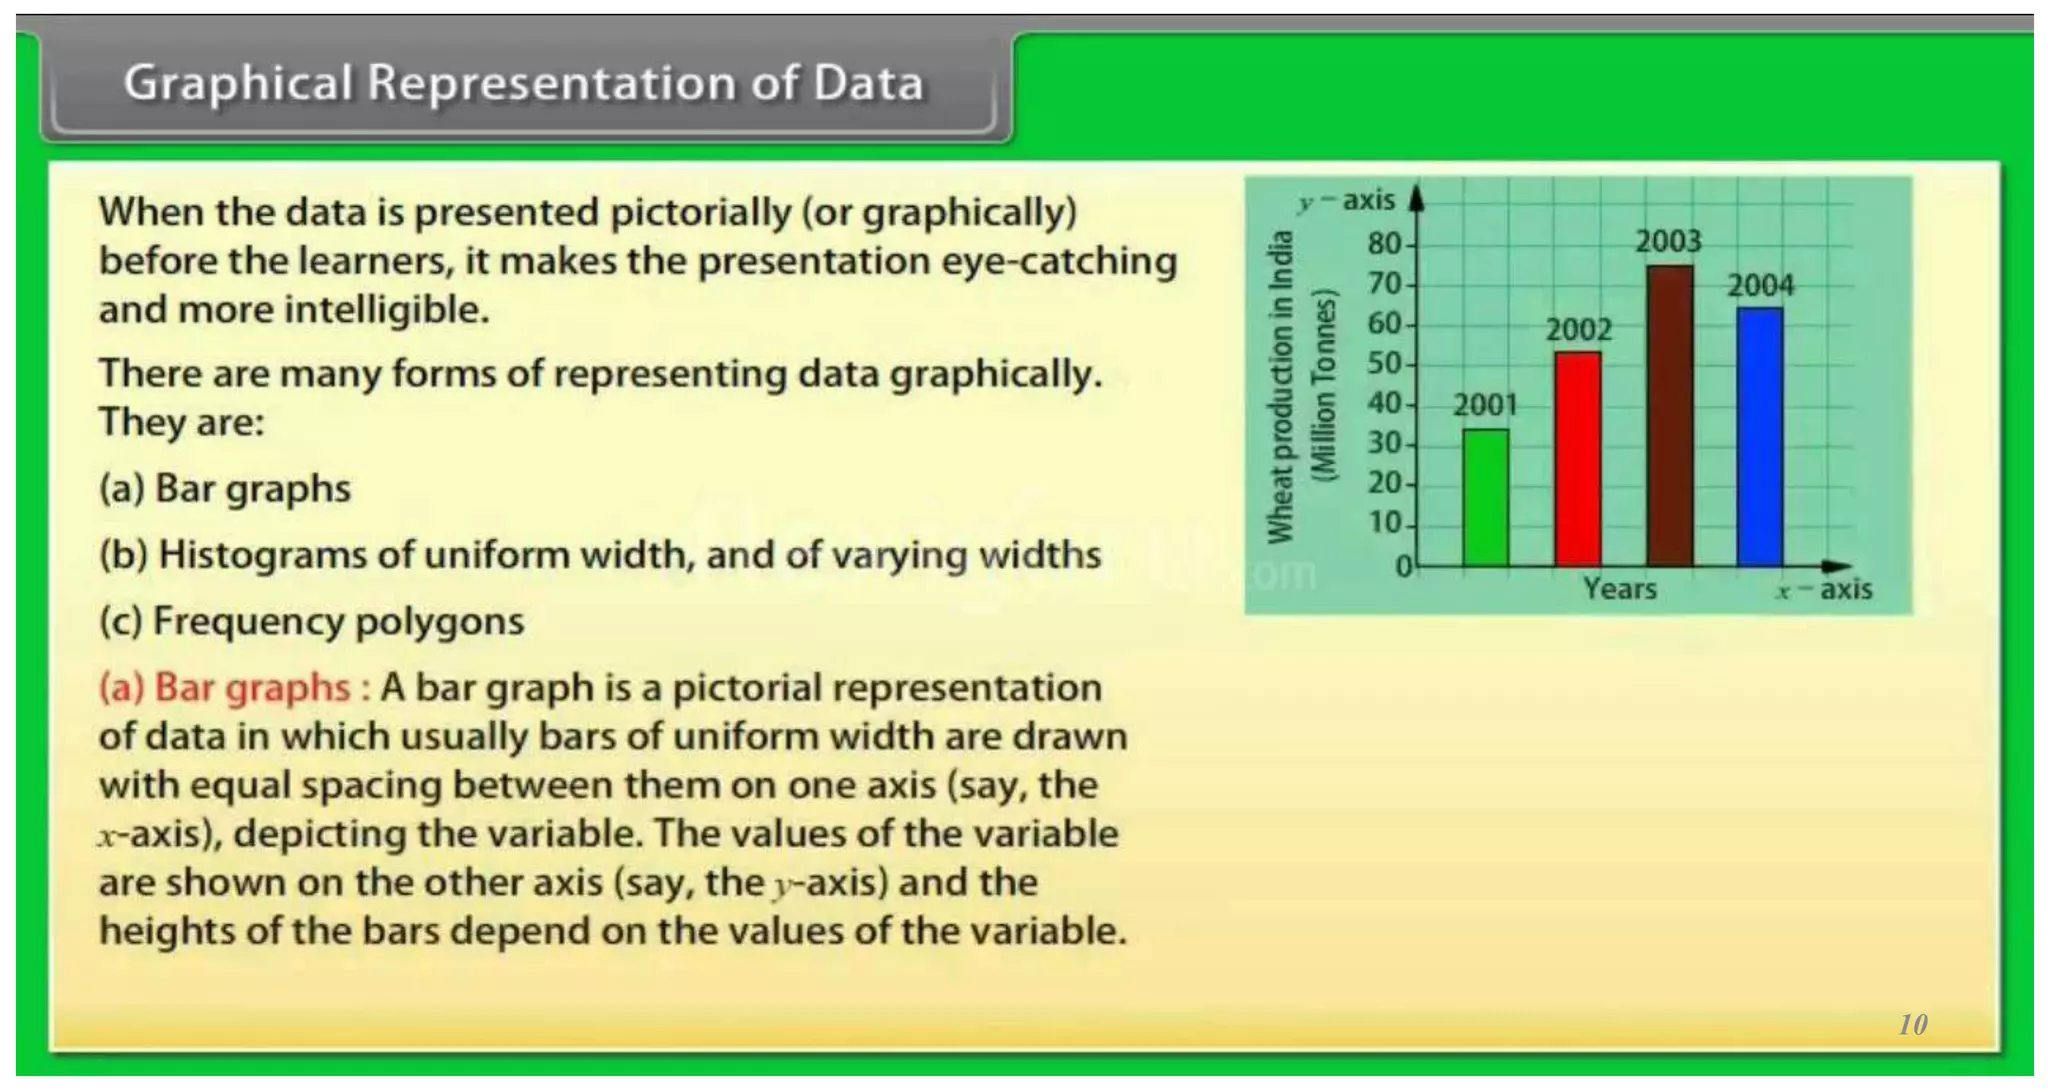
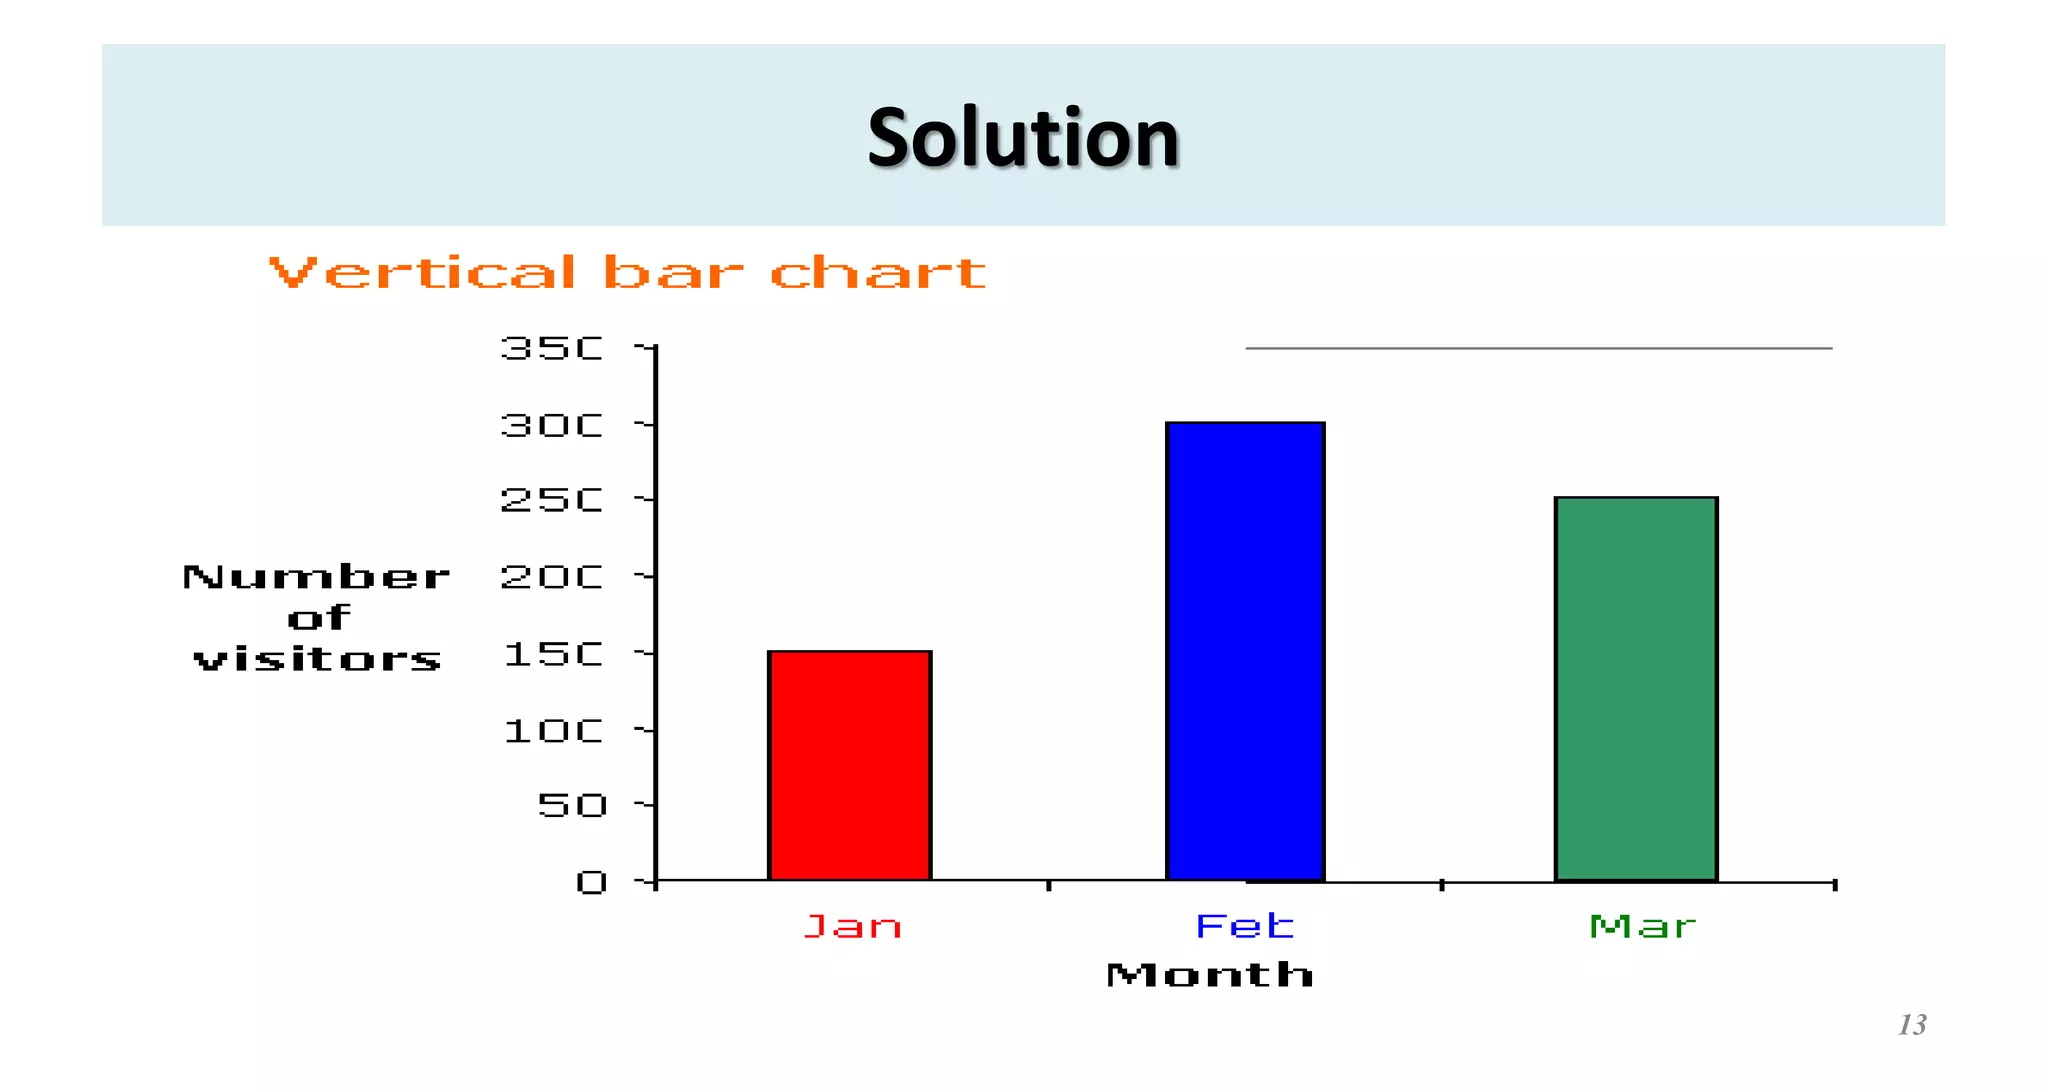
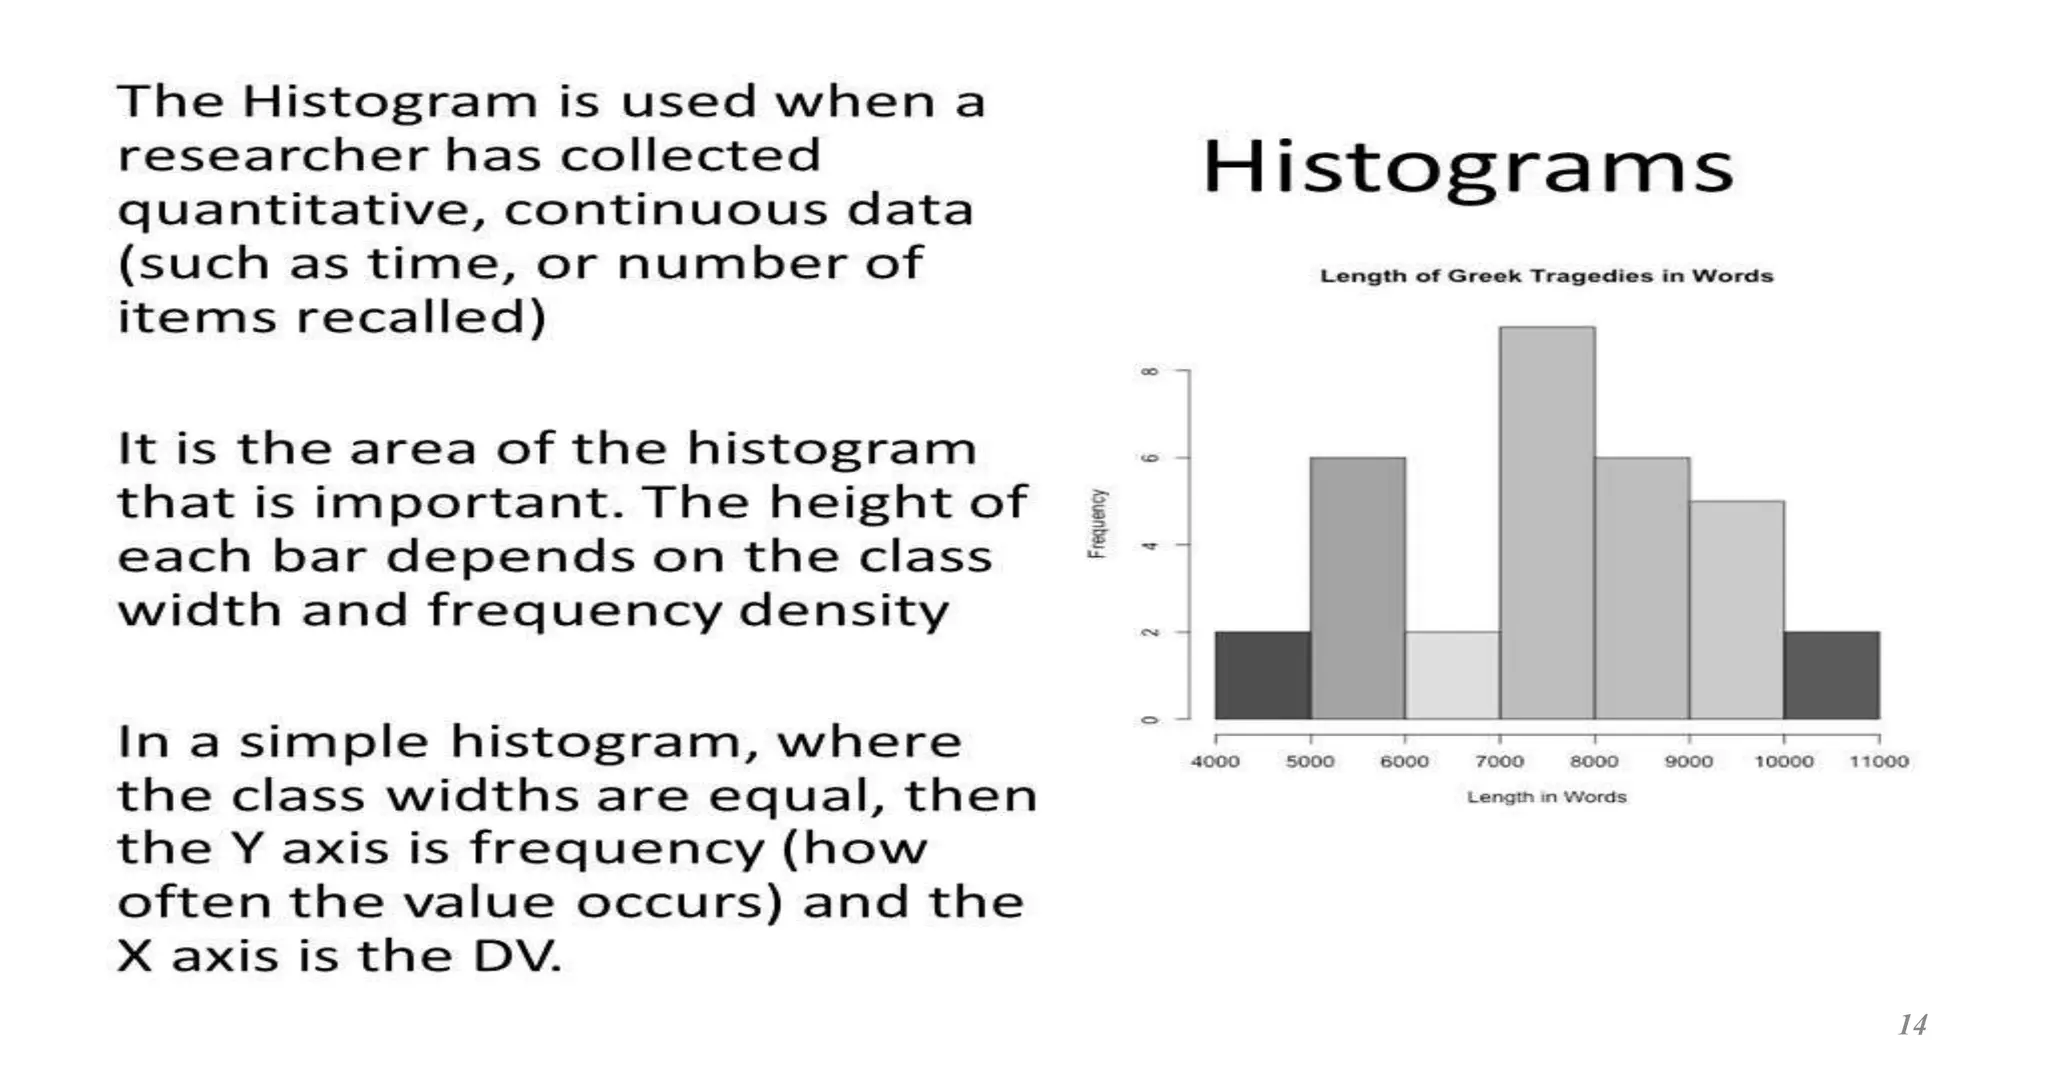
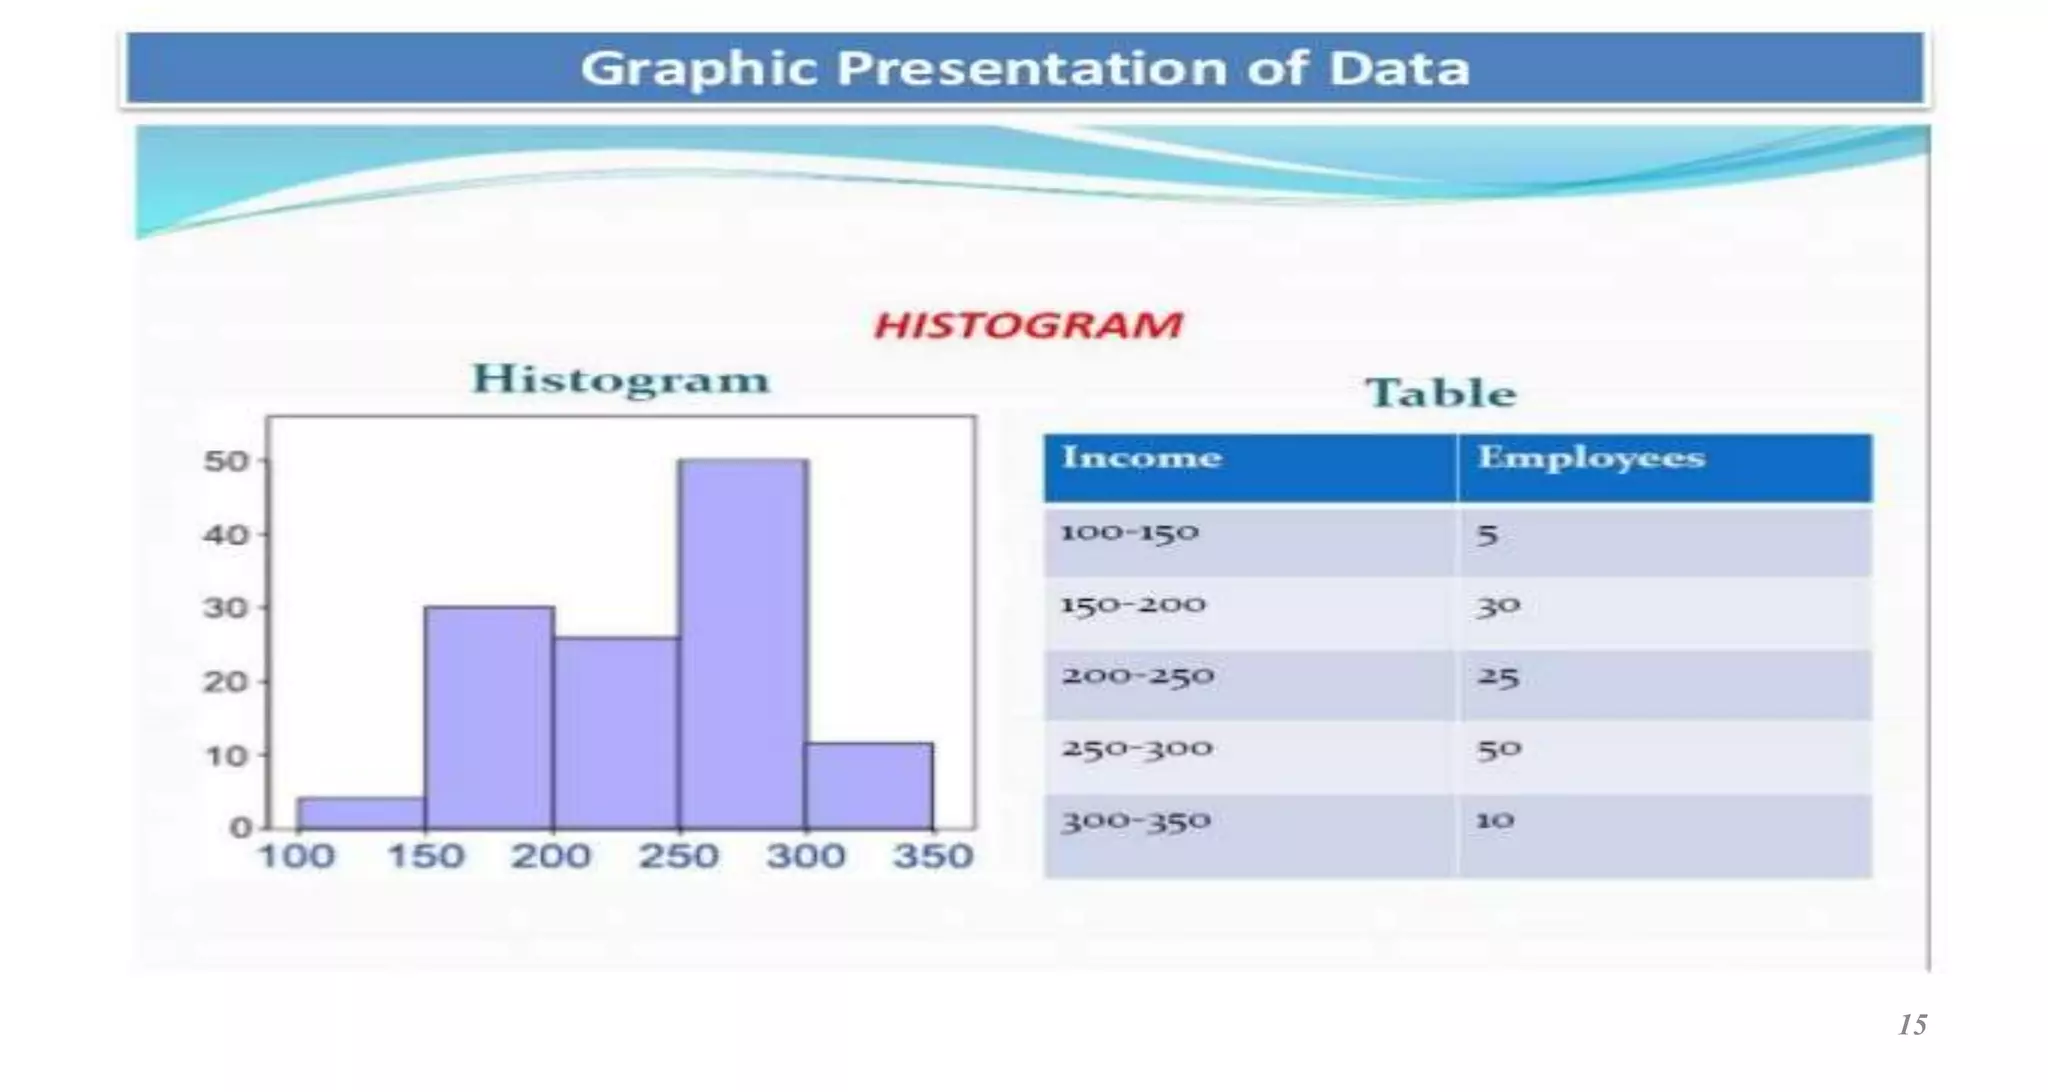

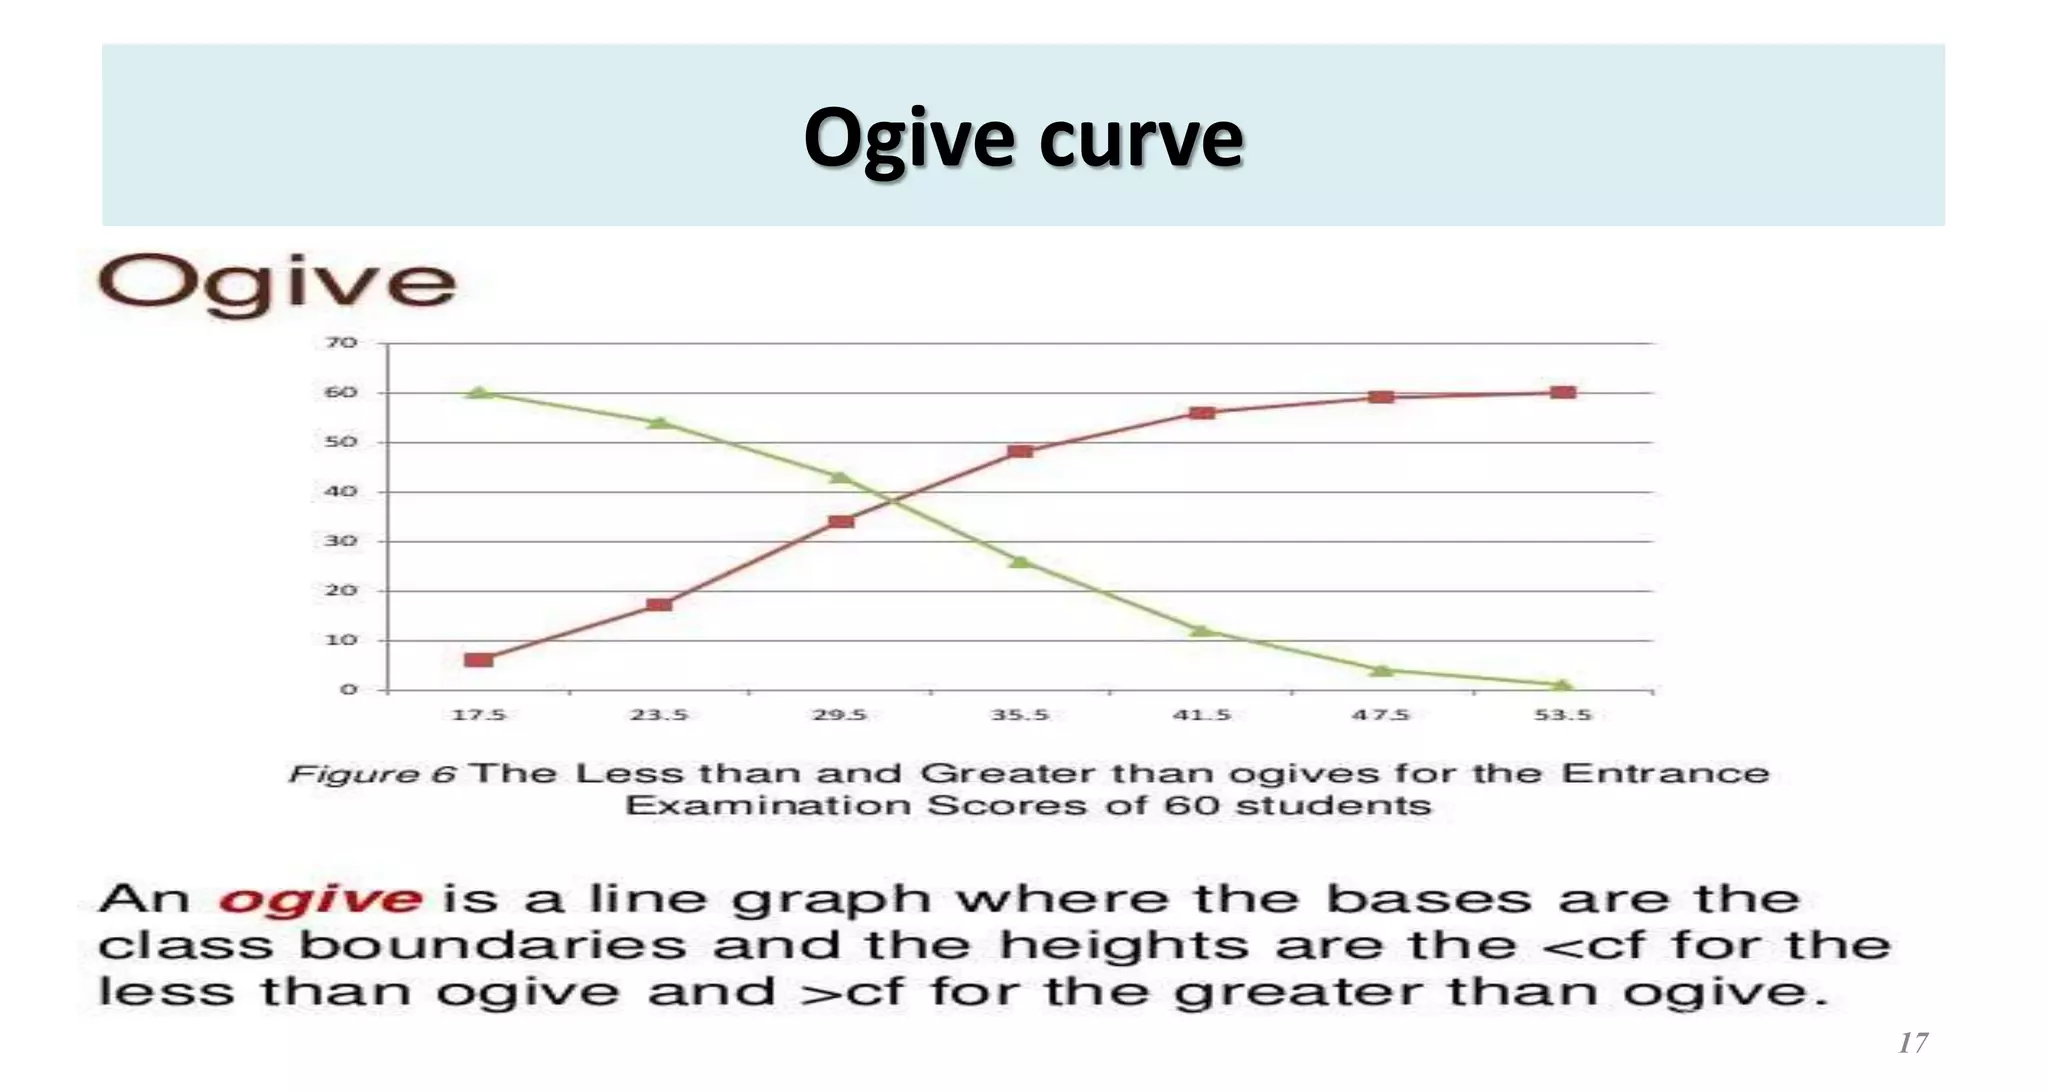


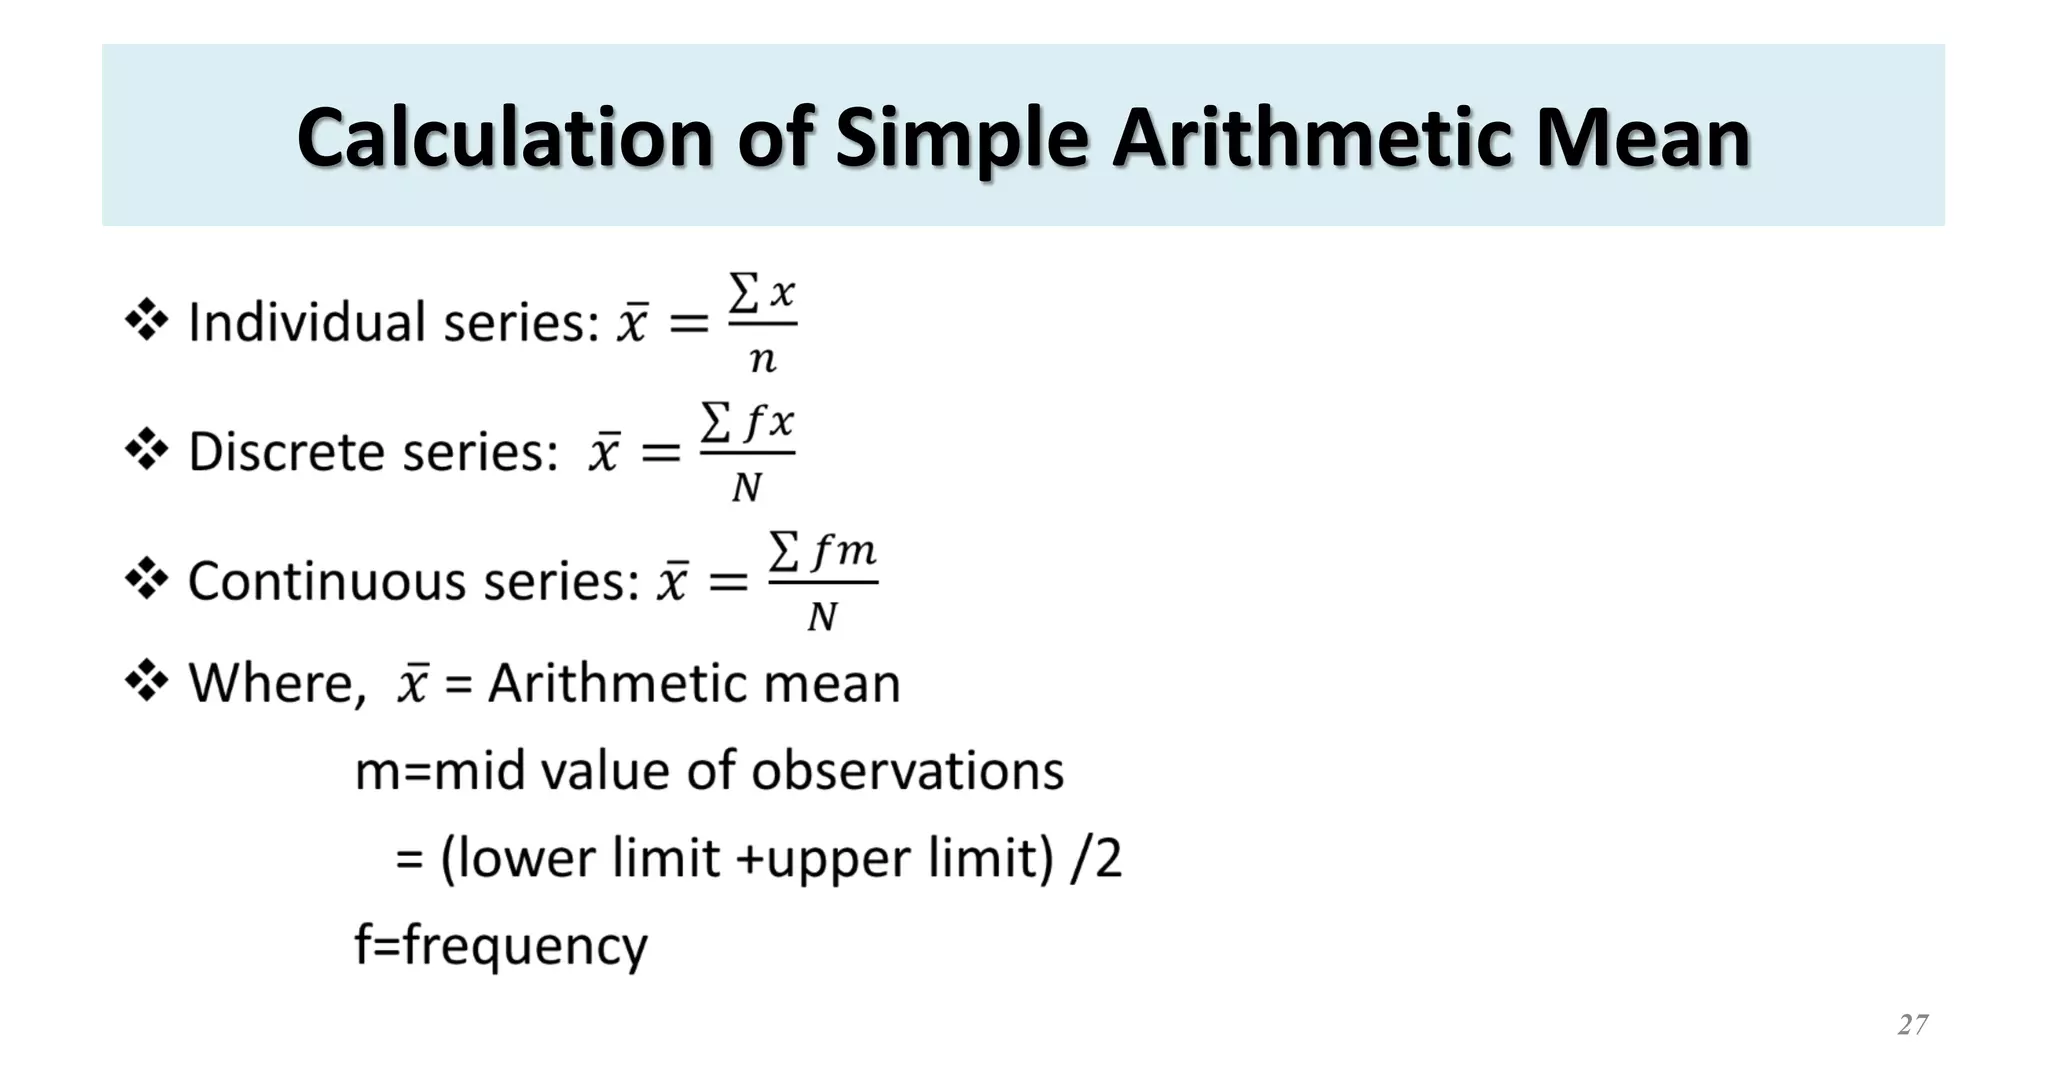


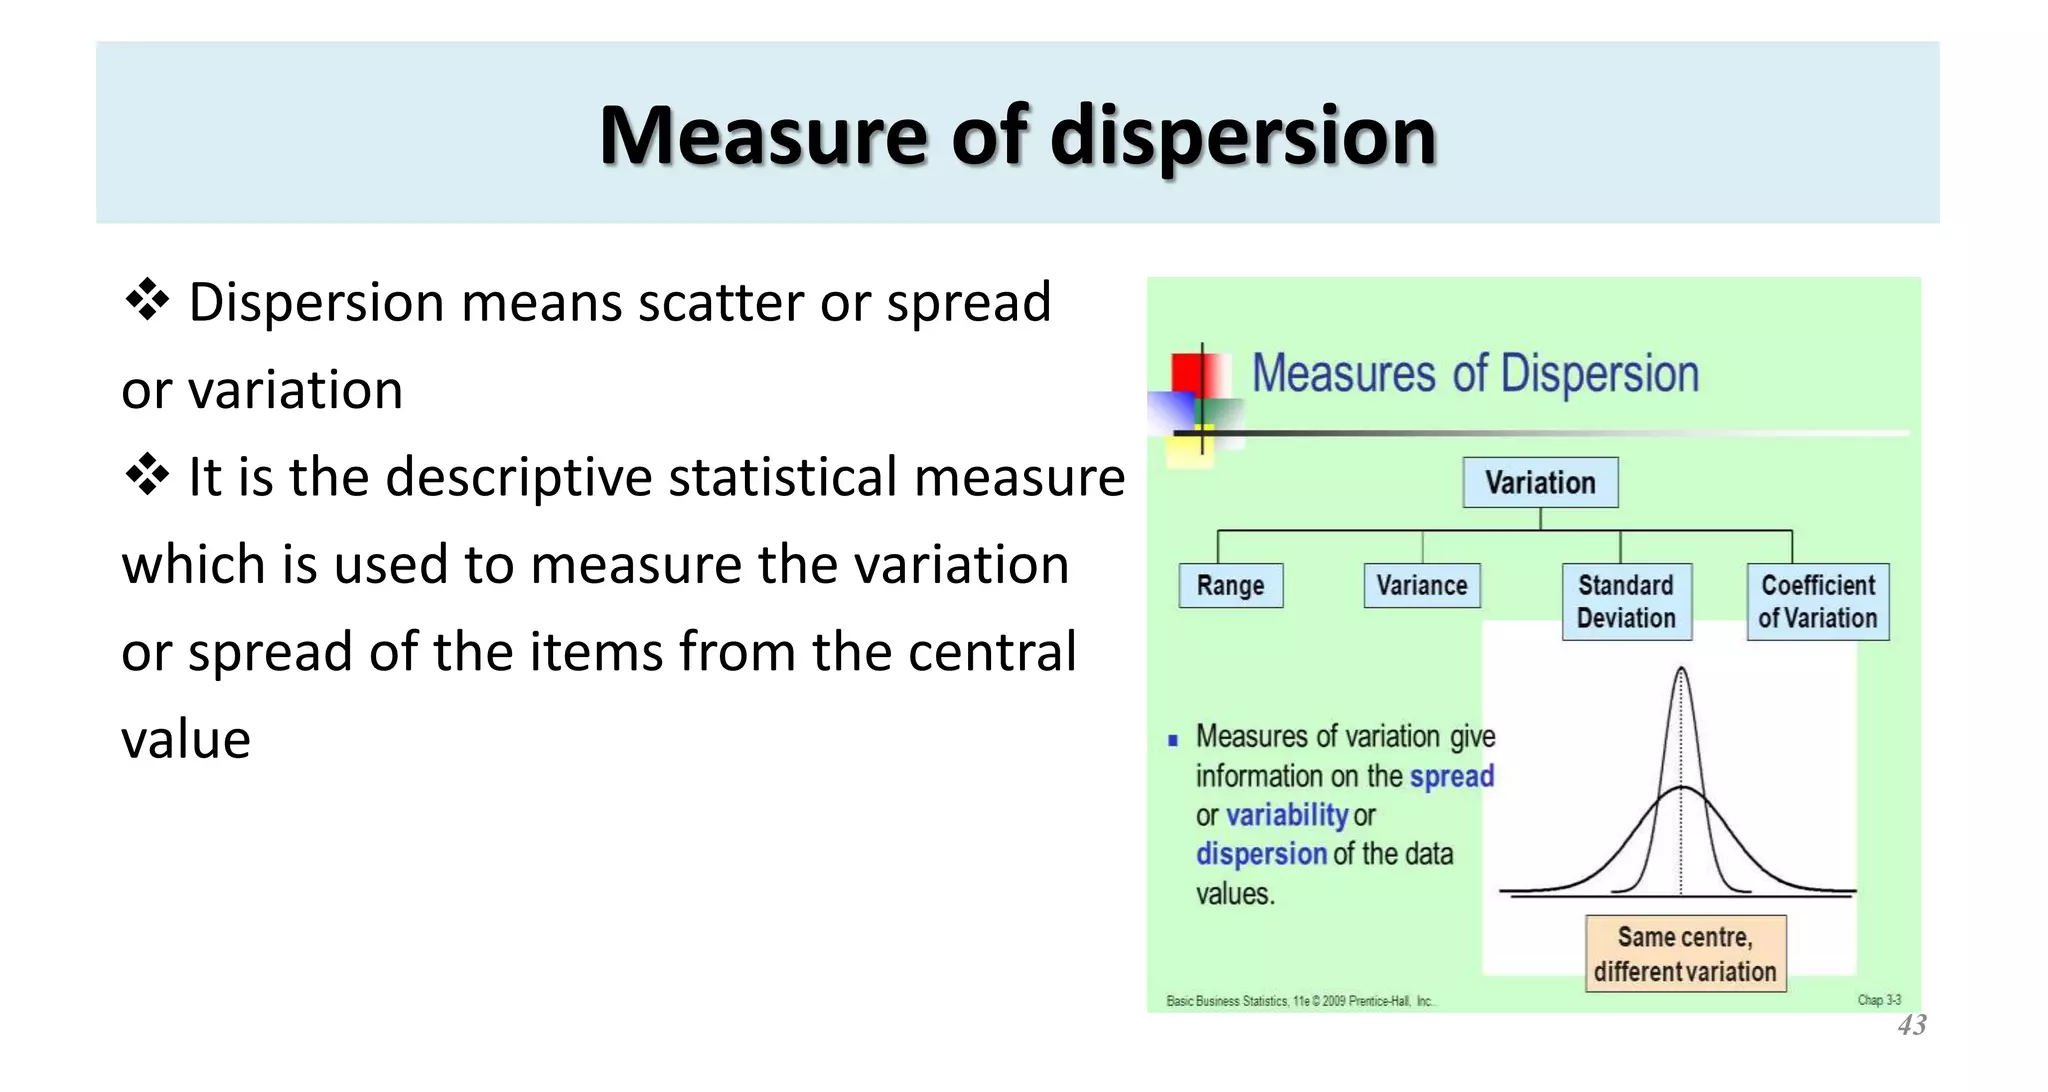
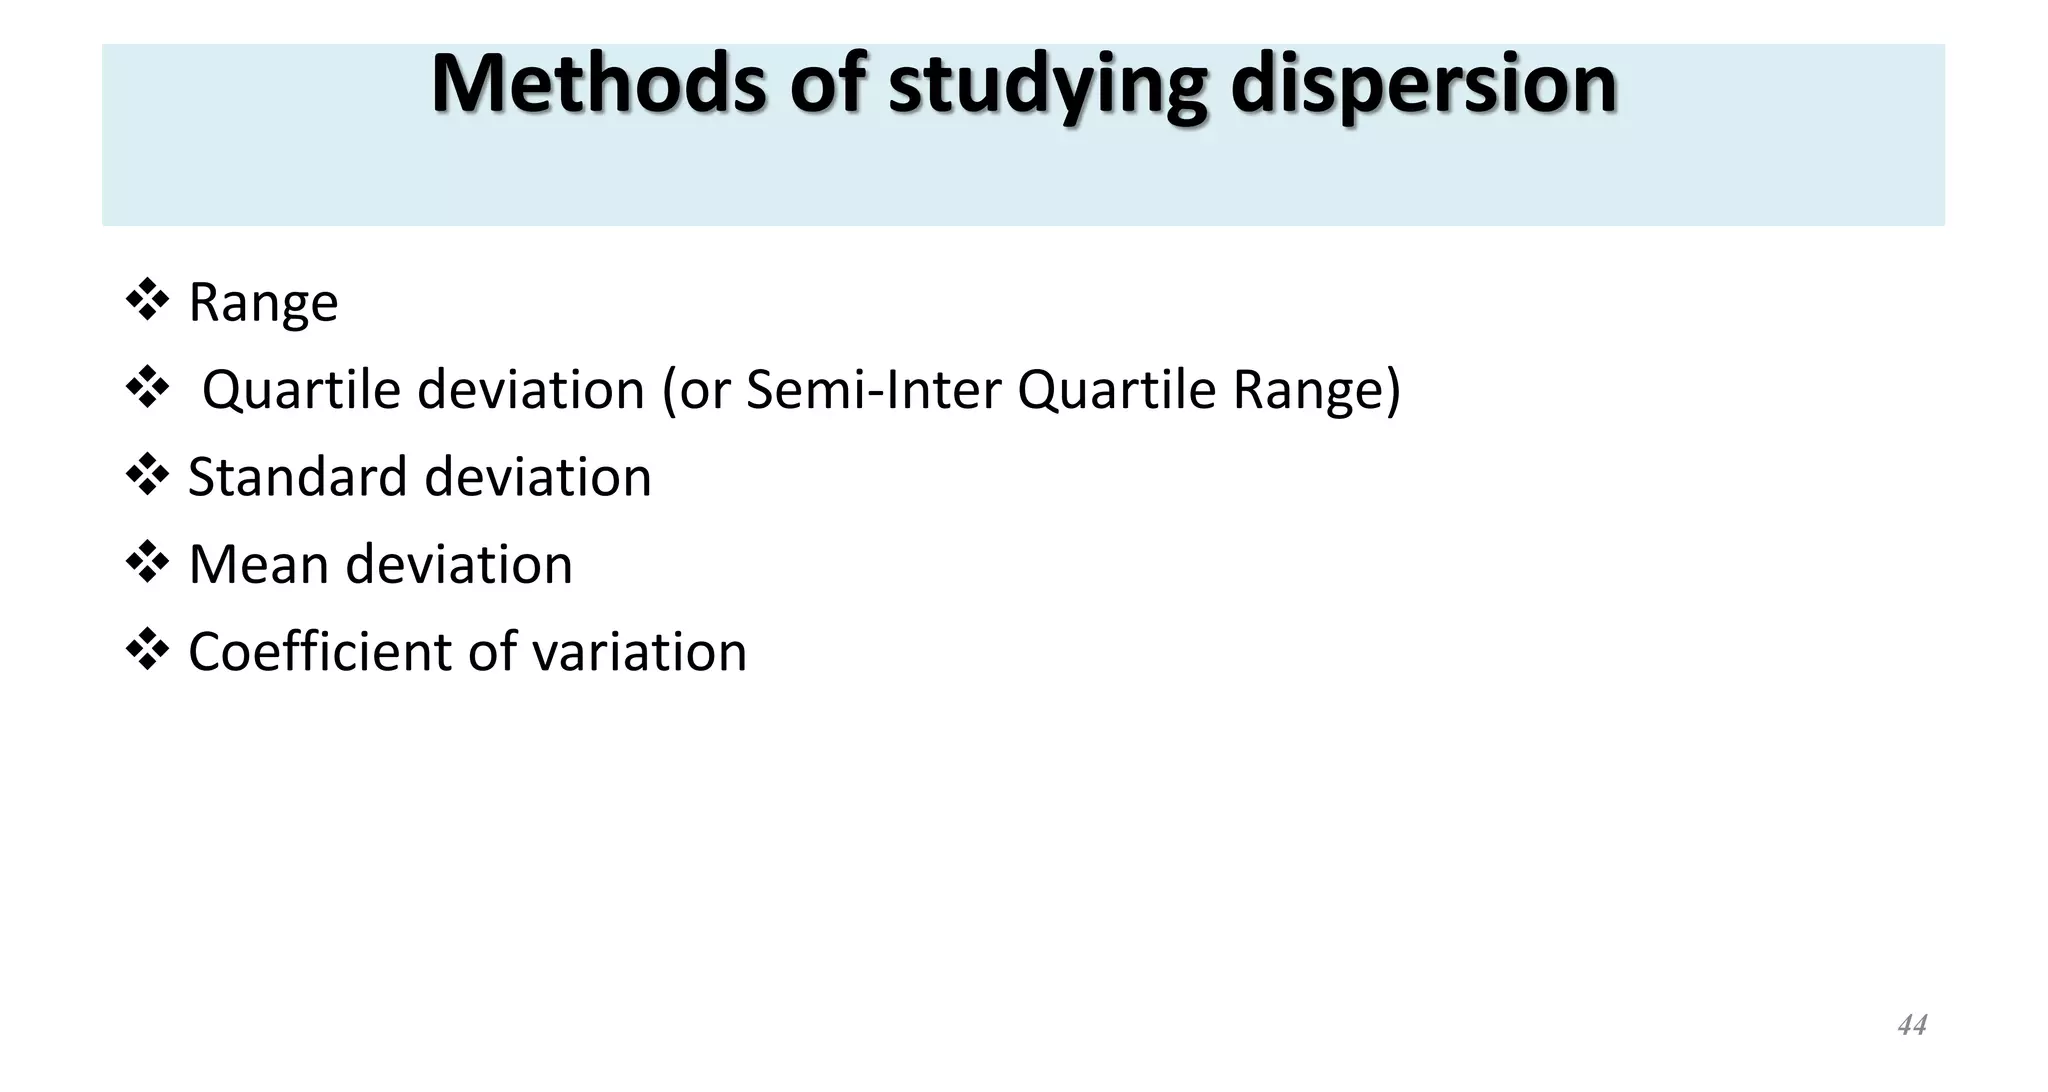
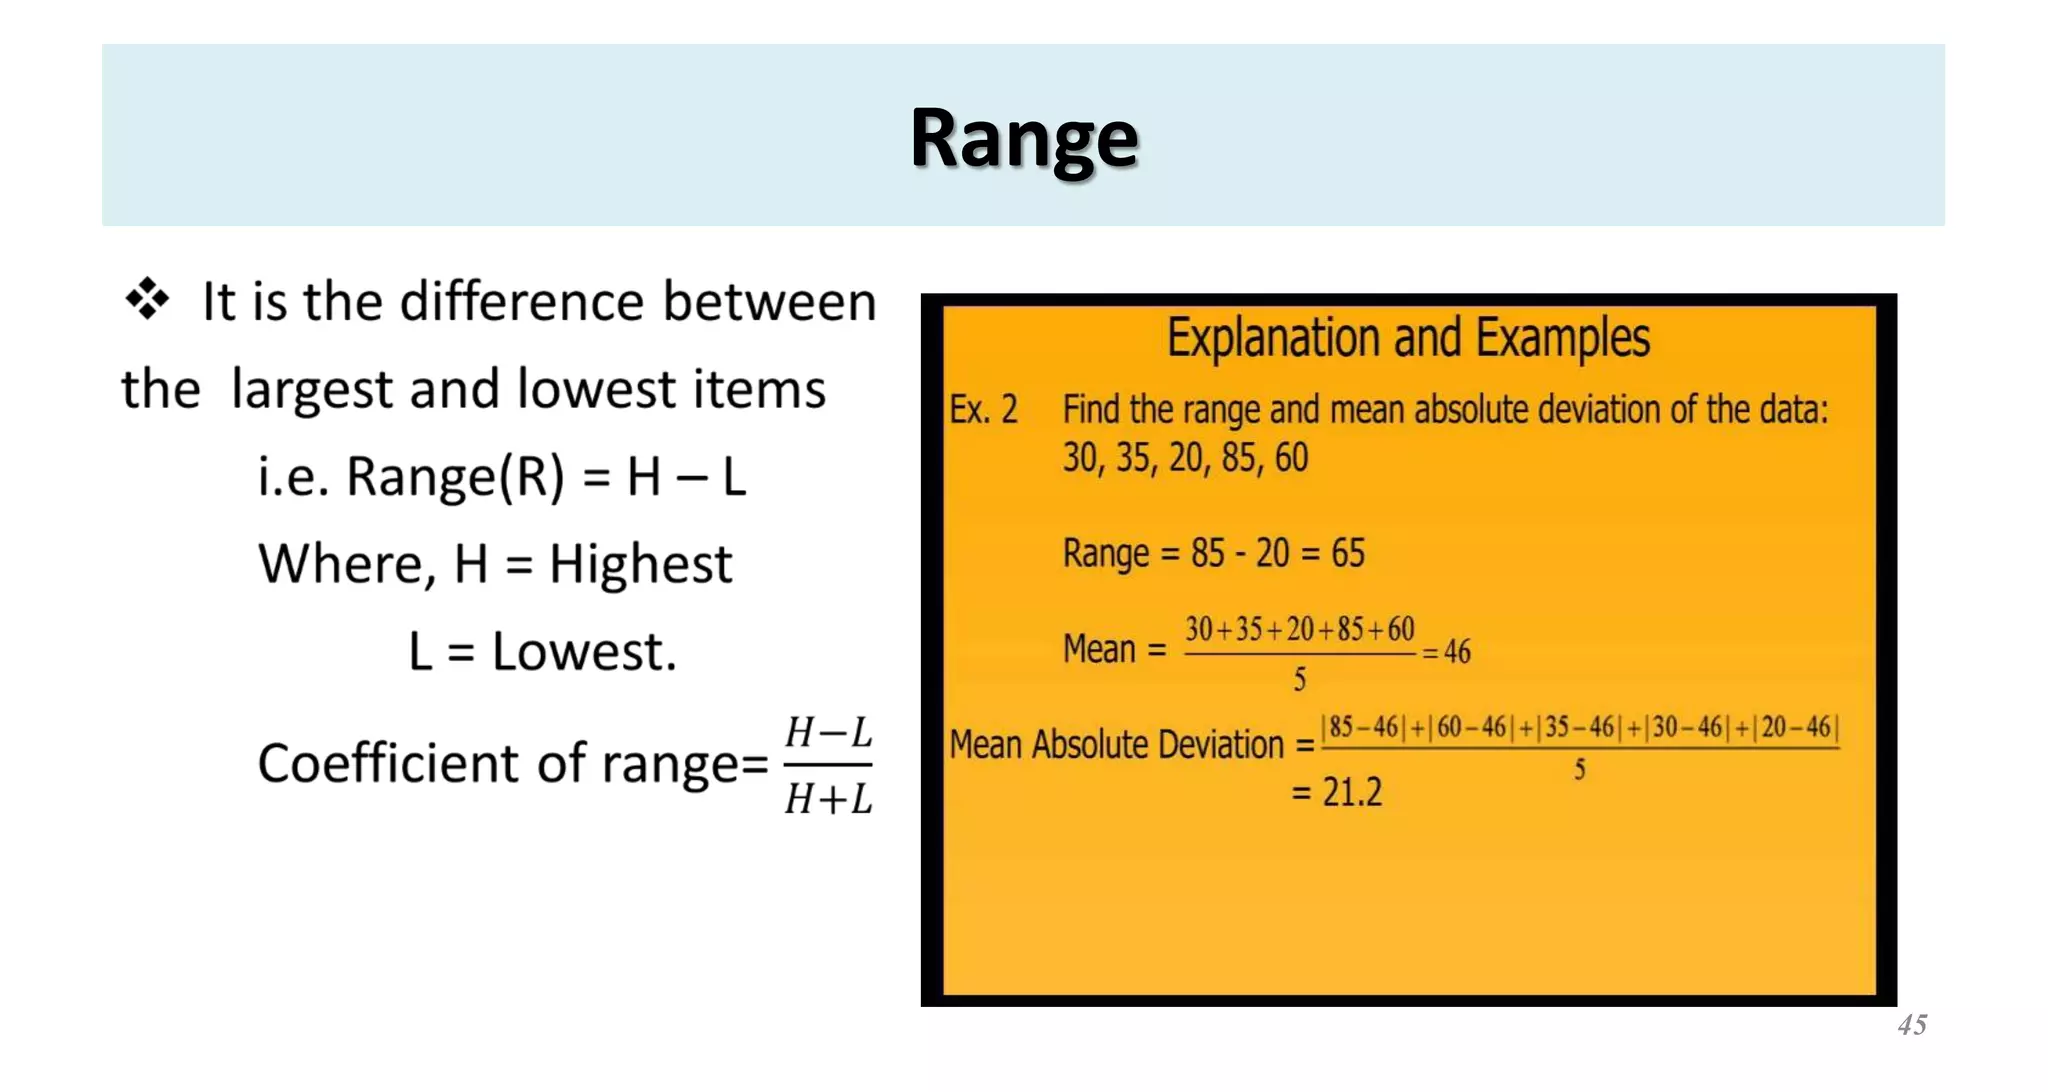

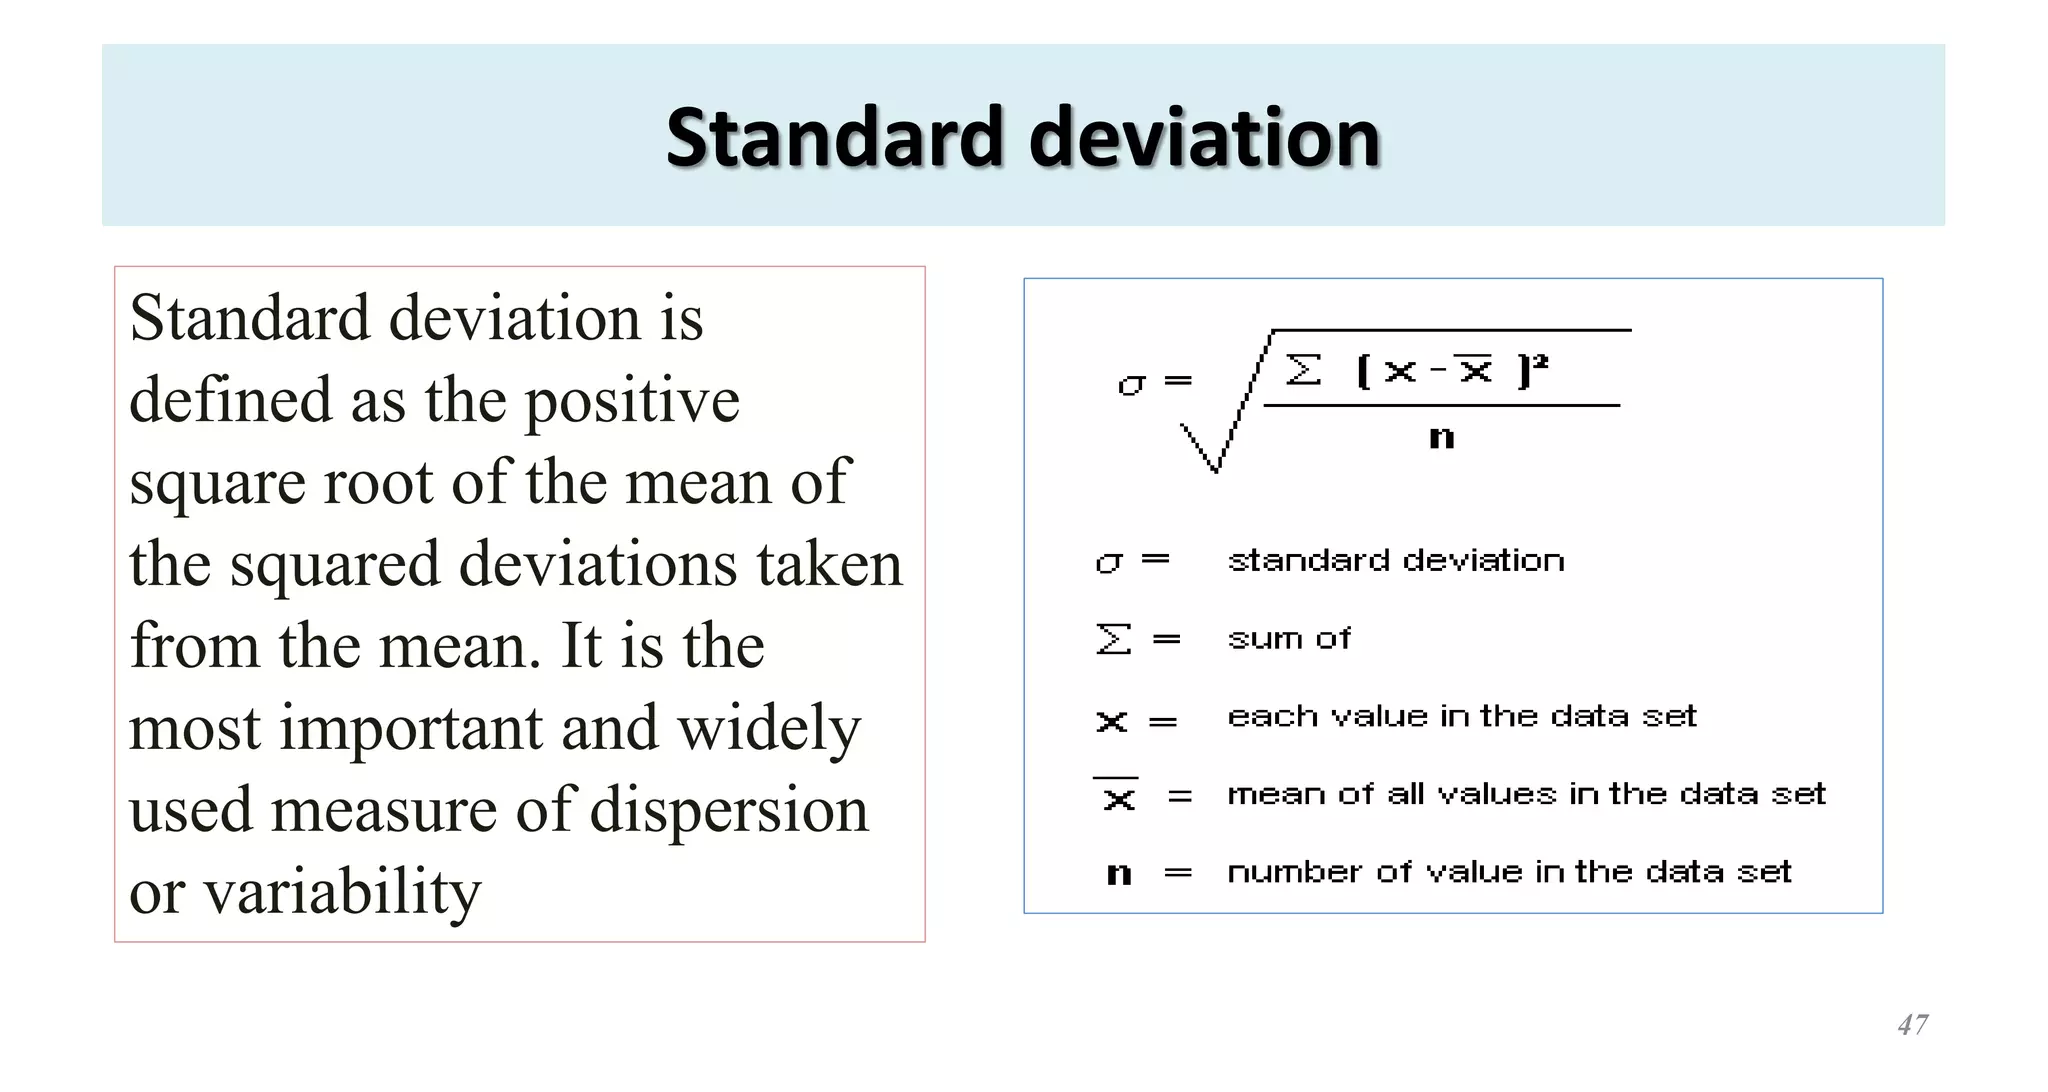
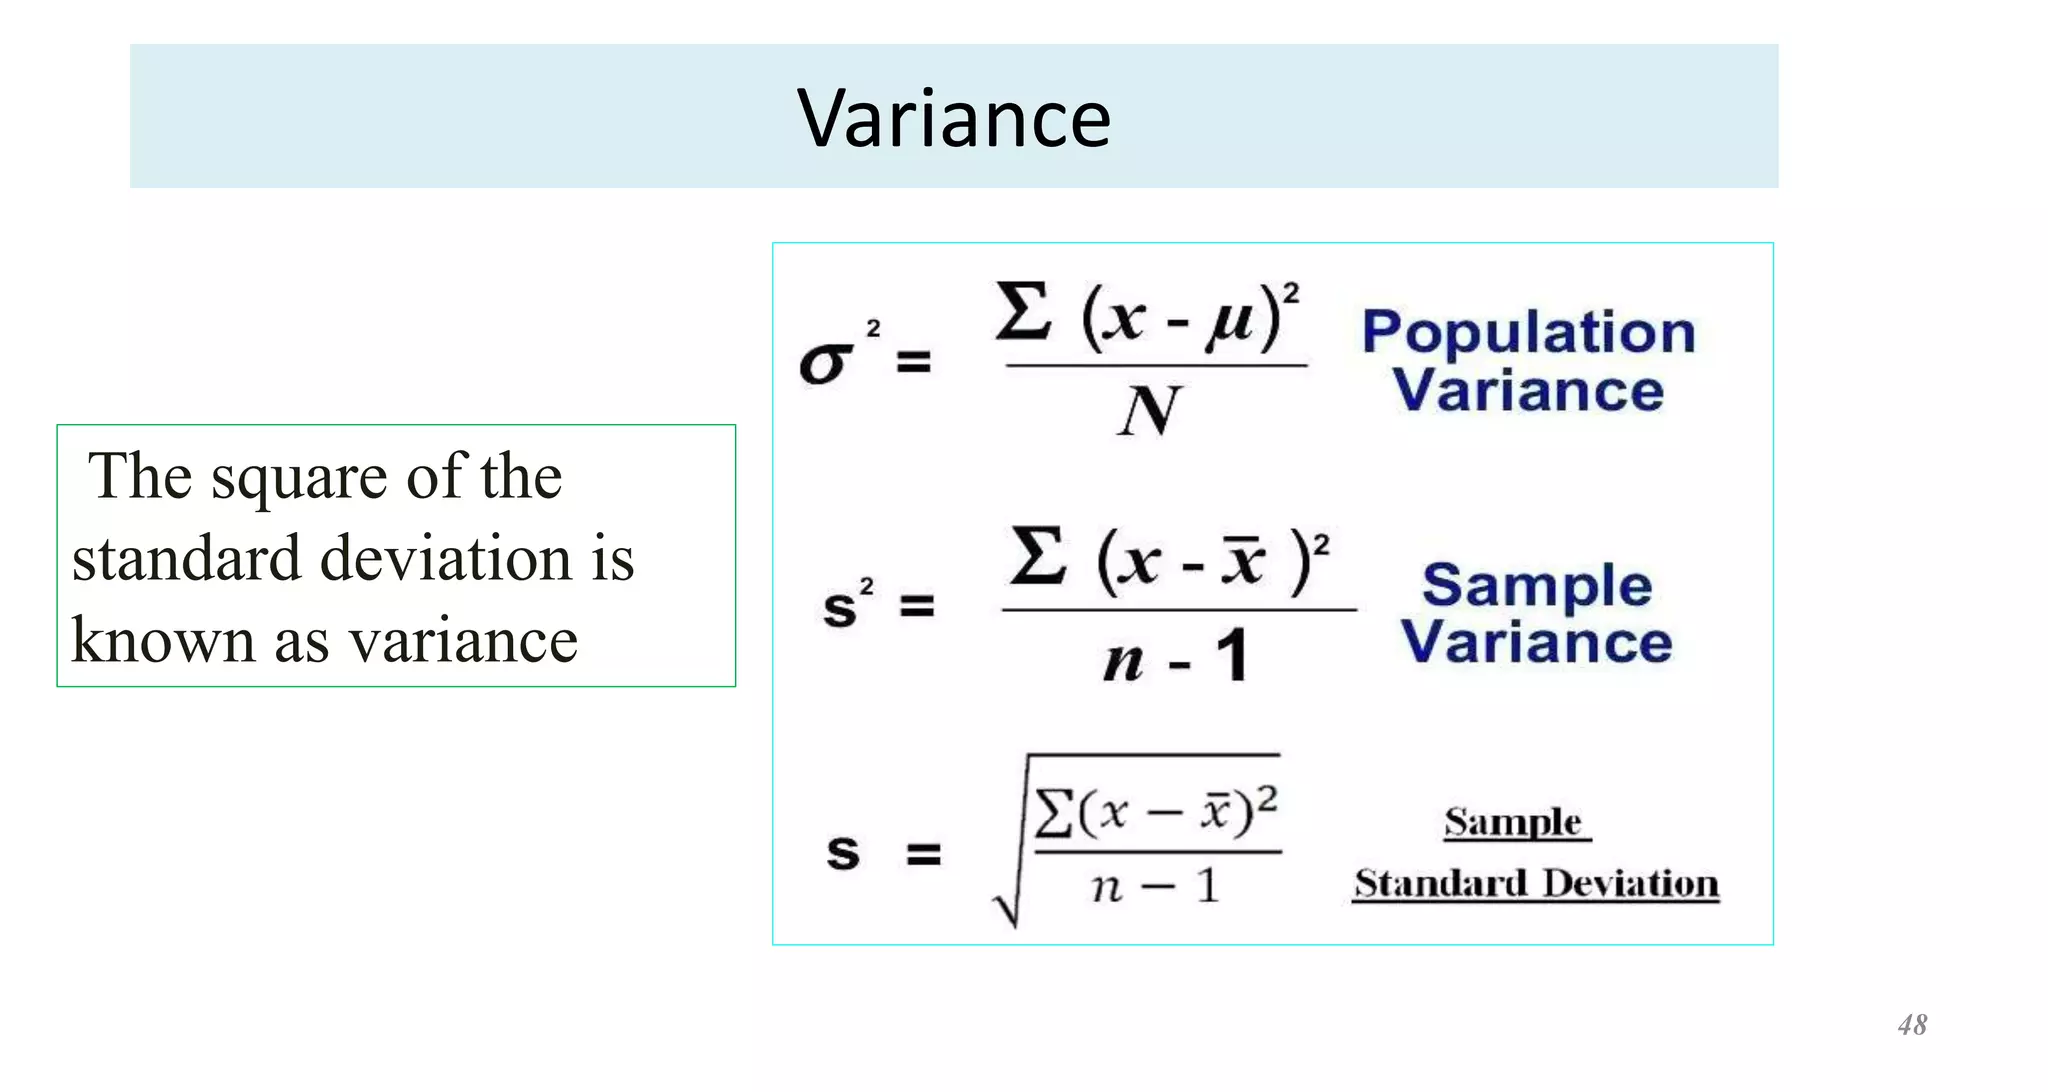


This document provides an overview of descriptive statistics concepts. It defines statistics, descriptive statistics, and inferential statistics. Descriptive statistics involves summarizing and describing data through measures of central tendency like mean, median, and mode, and measures of dispersion like range, standard deviation, and variance. The document discusses different types of data and averages. It also demonstrates how to calculate various descriptive statistics measures and construct graphs like bar diagrams and ogives using sample data.


![Lesson3 lpart one - Measures mean [Autosaved].pptx](https://cdn.slidesharecdn.com/ss_thumbnails/lesson2-measuresmeanautosaved-241011173812-613e1e66-thumbnail.jpg?width=640&height=640&fit=bounds)


