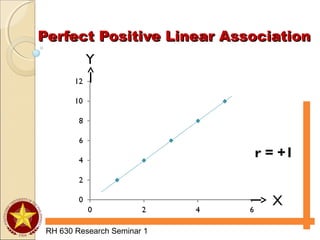
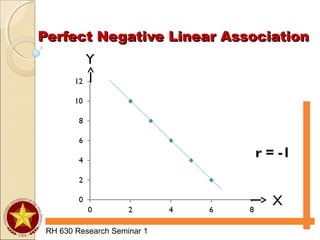
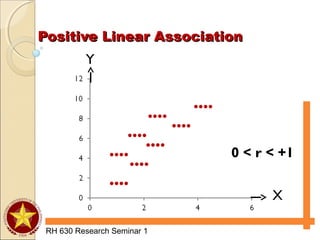
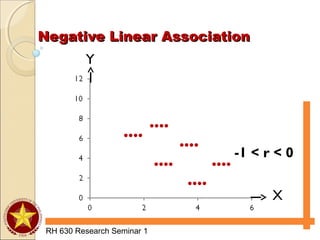
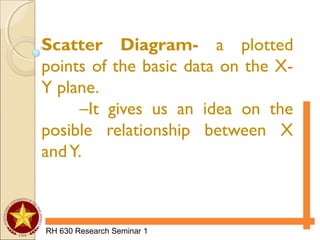
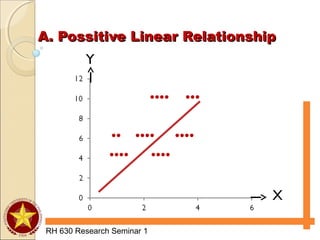
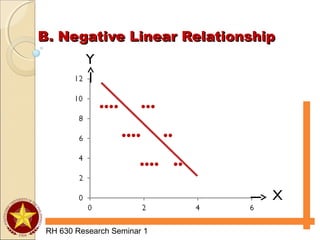
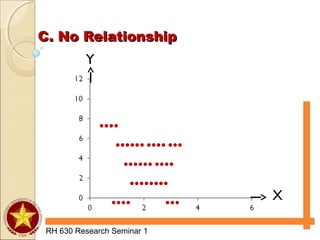
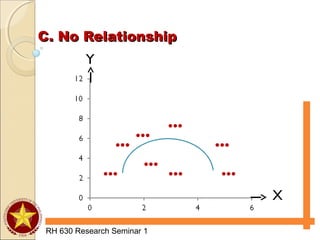
The document discusses various types of analyses for association, including correlation analysis, perfect positive and negative linear association, positive and negative linear association, no linear association, nonlinear association, and the Pearson product moment correlation coefficient. It also discusses simple linear regression analysis, including its objectives, data and scatter diagrams, the regression equation, and calculating simple regression. Finally, it discusses correlation from ranks using the Spearman rank-difference method and chi-square tests for independence using expected frequencies and a test statistic.


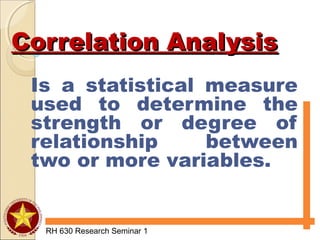
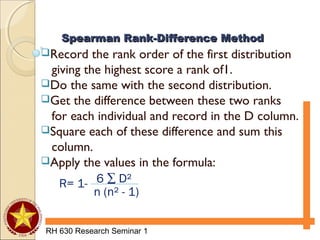
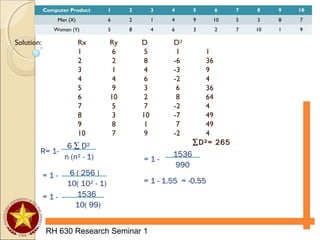
![Pearson Product MomentPearson Product Moment
Correlation CoefficientCorrelation Coefficient
RH 630 Research Seminar 1
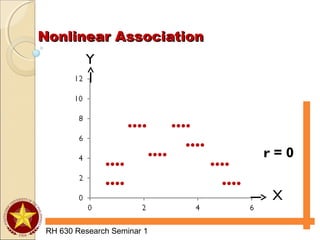
n∑xy-(∑x)(∑y)
√[n(∑x²) - (∑x)²] [n(∑y²) - (∑y)²]
R =](https://image.slidesharecdn.com/researchseminar-160924183808/85/Types-of-Analysis-for-Association-12-320.jpg)
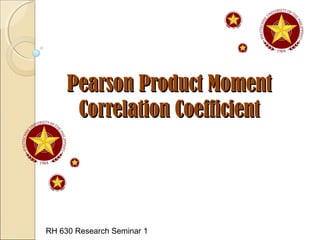
![Pearson Product Moment Correlation CoefficientPearson Product Moment Correlation Coefficient
RH 630 Research Seminar 1
R =
X Y X² Y² XY
3 9 9 81 27
4 13 16 168 52
5 15 25 225 75
6 16 36 256 96
7 17 49 289 119
∑X = 25 ∑ Y = 70 ∑ X² =
135
∑Y²=
1020
∑XY=369
n∑xy - (∑x)(∑y)
√[n(∑x²) - (∑x)²][n(∑y²) – (∑y)²]
√[ 5(135) – (25)² ] [5(1020) – (70)² ]
5 ( 369 ) – 25 ( 70 )
=
1845 - 1750
=
√ ( 50 ) ( 200 )
=
95
100
= .95](https://image.slidesharecdn.com/researchseminar-160924183808/85/Types-of-Analysis-for-Association-13-320.jpg)
![The Data and the Regression EquationThe Data and the Regression Equation
RH 630 Research Seminar 1
Given : Equation of the lineY = a + bX
Computing for a and b:
Calculation of Simple RegressionCalculation of Simple Regression
byx =
∑XY – [∑X∑Y/N]
[∑X²– [(∑X)²/N]
Ayx = Y – byxX](https://image.slidesharecdn.com/researchseminar-160924183808/85/Types-of-Analysis-for-Association-25-320.jpg)
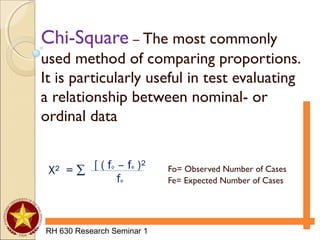
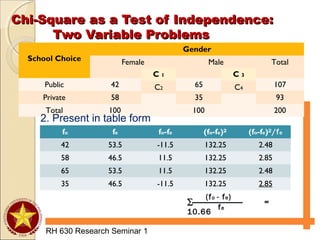
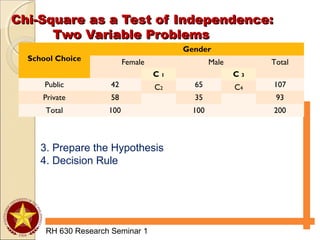
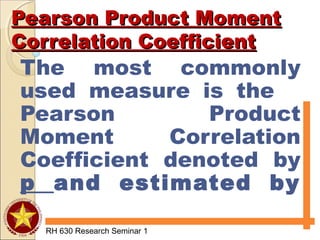
![Chi-Square as a Test of Independence:Chi-Square as a Test of Independence:
Two Variable ProblemsTwo Variable Problems
RH 630 Research Seminar 1
Chi-Square can also be used to test
the significance of the relationship
between two variables when data are
expressed in terms of frequencies of
joint occurence.
Fe = [ ]
(rowtotal) (columntotal)
N](https://image.slidesharecdn.com/researchseminar-160924183808/85/Types-of-Analysis-for-Association-32-320.jpg)
 (columntotal)
N
School Choice
Gender
Female Male Total
Public 42 65 107
Private 58 35 93
Total 100 100 200
C 1
C2
C 3
C4
Computational Procedure:
1. Compute the expected frequency of each cell.
C1 =
100x107 = 53.5
200
200
100x93 = 46.5C1 =
100x107 = 53.5
100x93 = 46.5
C4 = 200
C3 = 200](https://image.slidesharecdn.com/researchseminar-160924183808/85/Types-of-Analysis-for-Association-33-320.jpg)