The document discusses production scheduling and sequencing. It covers topics like:
- Scheduling inputs, loading and scheduling devices, factors influencing scheduling, and techniques like Gantt charts and network analysis using PERT and CPM.
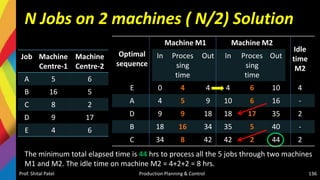
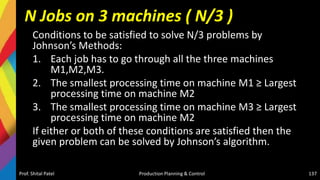
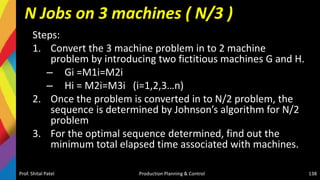
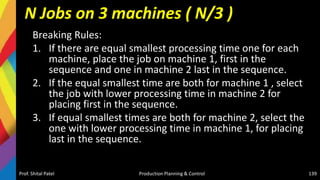
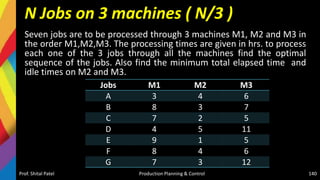
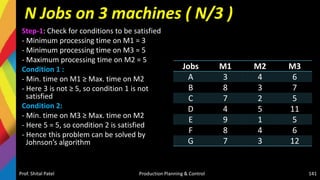
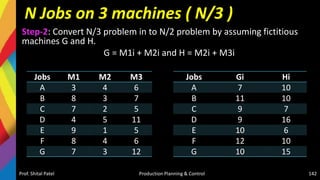
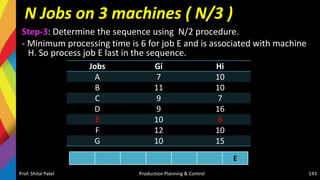
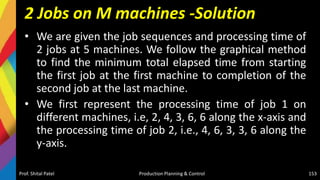
- Sequencing of products and jobs on machines using rules like Johnson's rule and algorithms like processing n jobs on 3 machines.
It provides overviews and examples of key concepts in production scheduling and sequencing like inputs, loading, techniques, and algorithms.

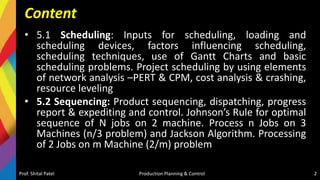


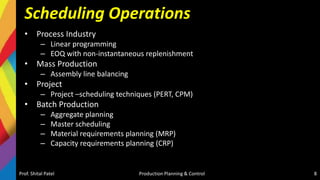

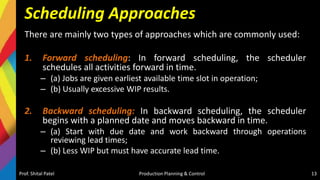


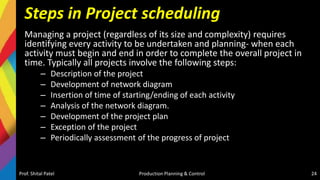


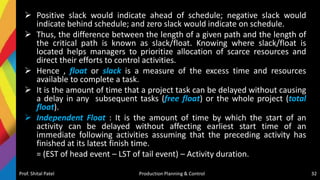


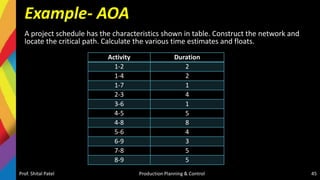
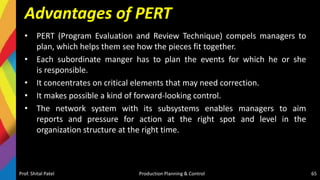
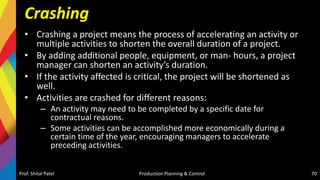
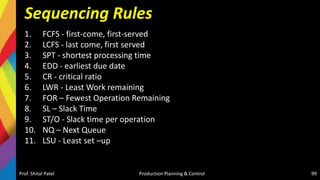
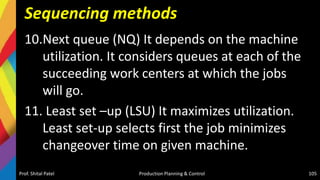
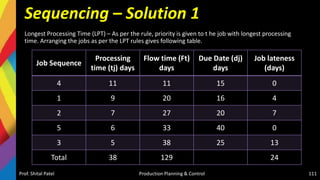
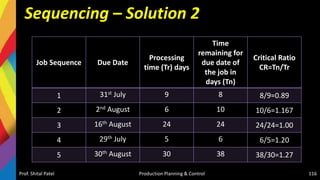
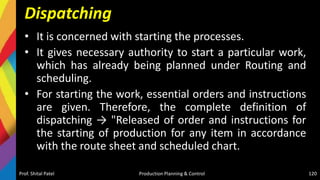
![CPM- Critical Path Method
Prof. Shital Patel Production Planning & Control 43
Start
0 0
0 0
A
0 2 2
4 6
F
2 4 6
7 11
D
2 3 5
6 9
B
0 6 6
3 9
C
0 4 4
0 4
E
4 5 9
4 9
G
9 2 11
9 11
End
11 11
11 11
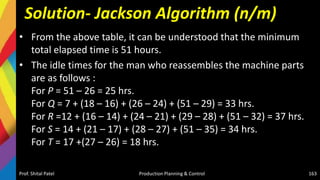
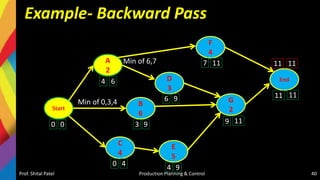
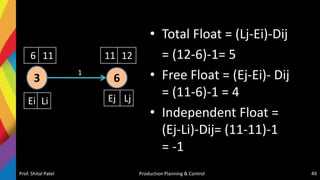
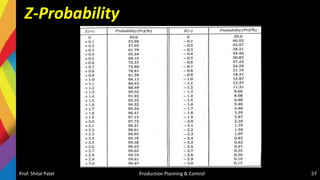
Path 1-: Start-A-F-End = 6 days
Path 2-: Start-A-D-G-End = 7 days
Path 3-: Start-B-G-End = 8 days
Path 4-: Start-C-E-G-End = 11 days
[CRITICAL PATH]](https://image.slidesharecdn.com/5-220405074853/85/5-Production-Scheduling-and-Sequencing-pptx-43-320.jpg)
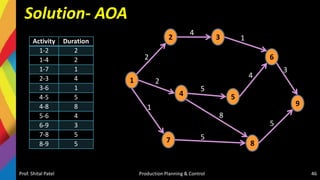


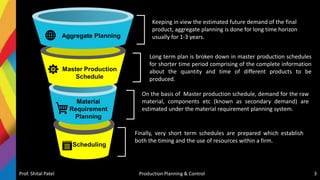
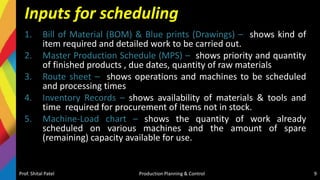
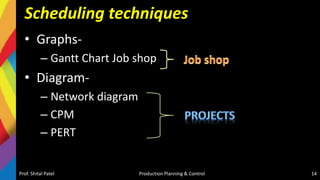
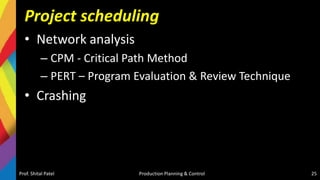
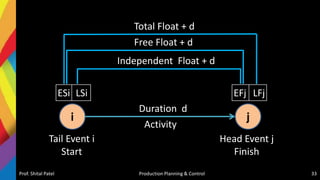
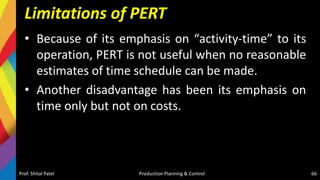
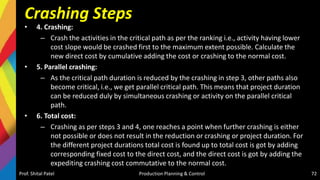
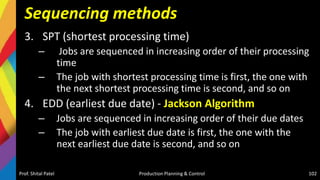
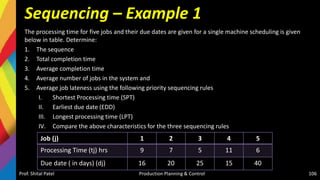
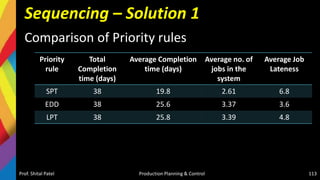
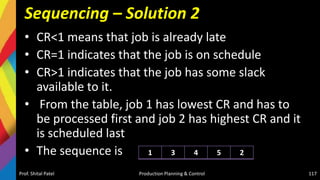
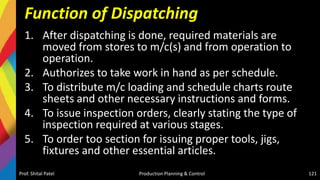
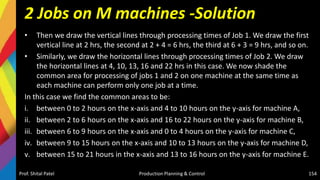
![Solution-PERT
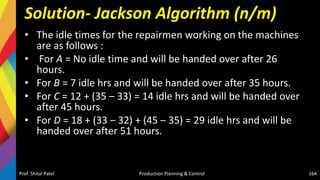
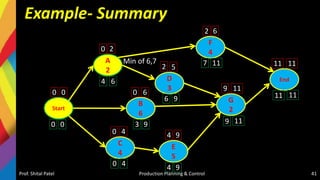
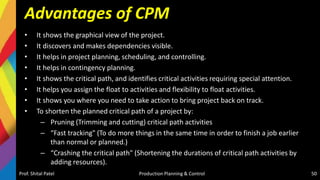
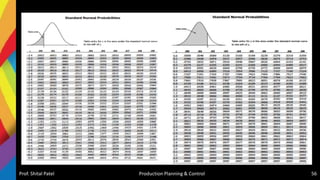
• From Normal Distribution Table, for Z = 0.35, the
fraction of (shadow) area = 0.637 i.e., 63.68%
• So probability of completion of project in 27 days is
63.68%
• [Note: If probability of completion of project will be
given and the due date (D) will be asked to find out,
then backward calculation can give the
result].
Prof. Shital Patel Production Planning & Control 64](https://image.slidesharecdn.com/5-220405074853/85/5-Production-Scheduling-and-Sequencing-pptx-64-320.jpg)

![Crashing Steps
Crashing of a network can be done in following steps:
• 1. Critical path:
– Find the normal critical path and identify the critical activity.
• 2. Cost slope:
– Calculate the cost slope for the different activities by using the formula.
– Cost slope = [Crash cost-Normal cost]/[Normal time- Crash time]
– The cost slope indicates the extra cost required to expedite an activity per unit
time.
• 3. Ranking:
– Rank the activities in the ascending order of cost slope . The activity having
the minimum cost slope have to be crashed first, crash the selected activity to
its minimum duration.
Prof. Shital Patel Production Planning & Control 71](https://image.slidesharecdn.com/5-220405074853/85/5-Production-Scheduling-and-Sequencing-pptx-71-320.jpg)
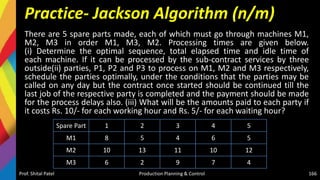
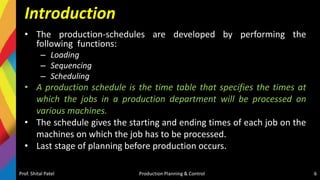
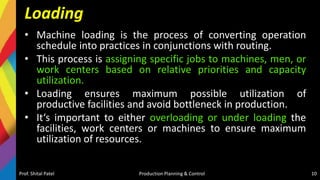
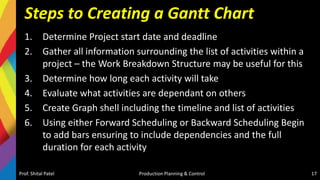
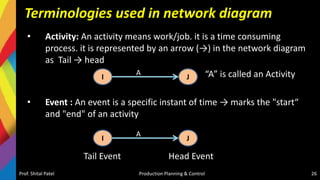
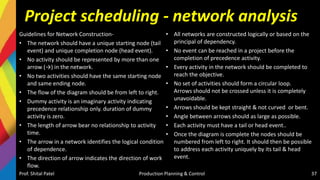
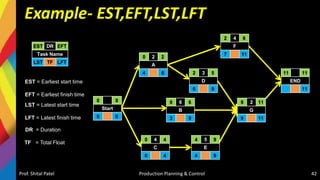
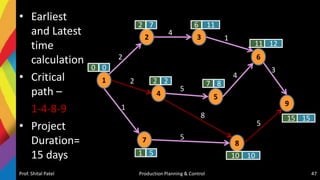
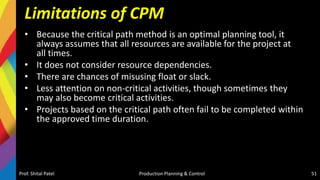
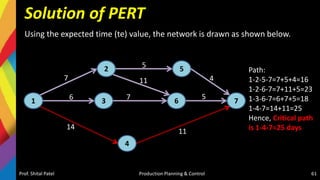
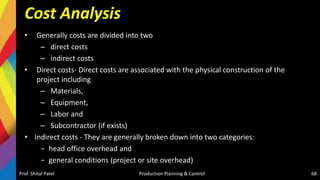
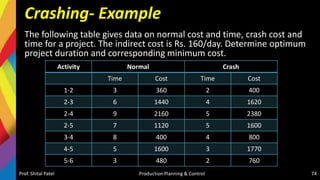
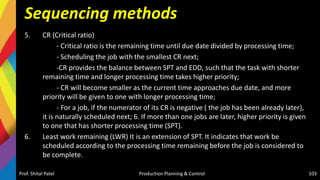
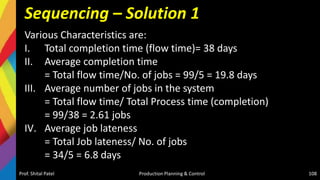
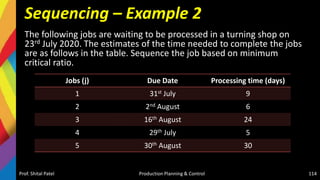
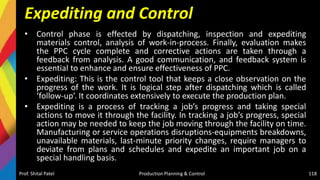
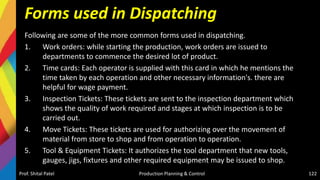
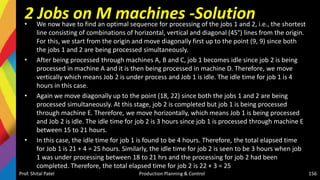
![Cost Slop
Slop = Crash Cost-Normal Cost
Normal Time-Crash Time
Direct Cost =
Direct cost of previous Crashing
+
[Crashing Cost slop X Crashing
Time] of current crashing
Prof. Shital Patel Production Planning & Control 73
Activity
Cost
Time
Crash
Cost
Normal
Cost
Normal
Time
Crash
Time
Crashed Activity
Normal Activity
Actual Cost Curve](https://image.slidesharecdn.com/5-220405074853/85/5-Production-Scheduling-and-Sequencing-pptx-73-320.jpg)
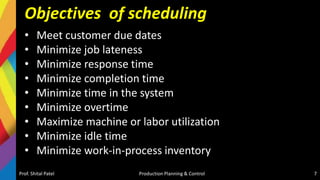
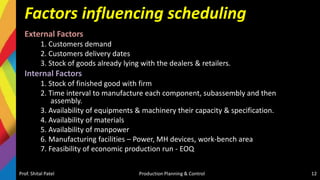
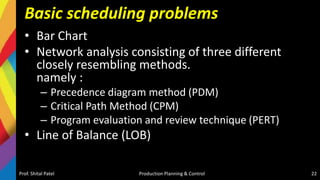
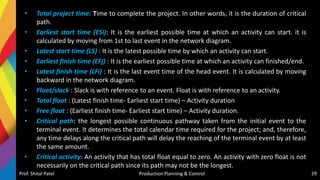
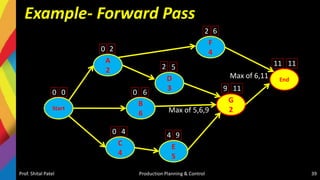
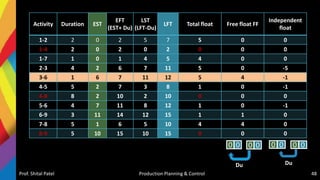
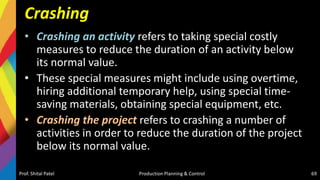
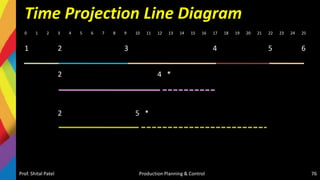
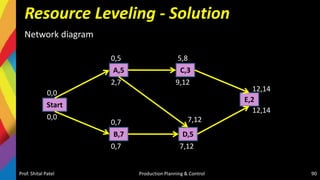
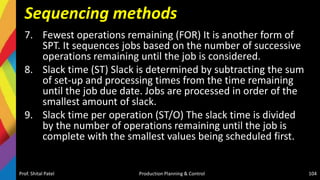
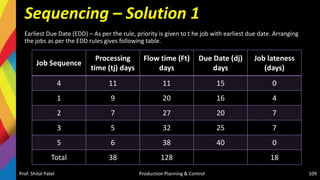
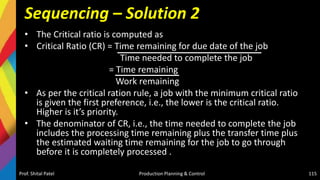
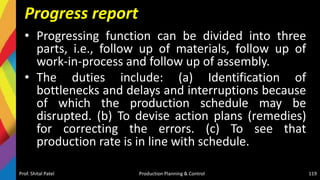
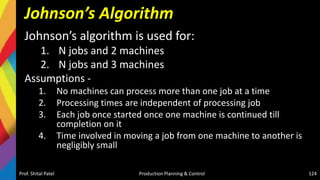
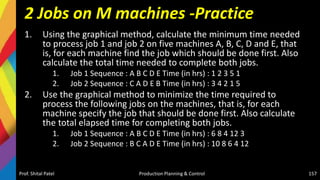
![Network Diagram
Prof. Shital Patel Production Planning & Control 75
1 2
3
4
5
6
0 0
3 3
9 9
17 17
22 22
25 25
3
6
9
8
7
5
3
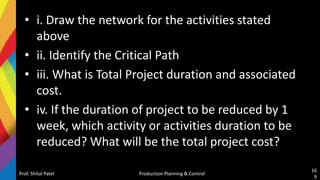
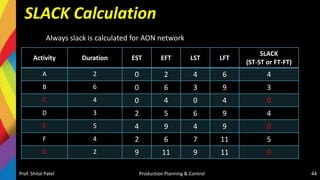
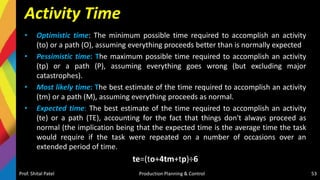
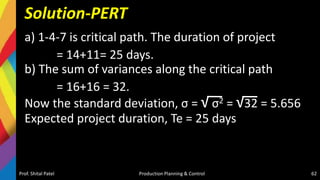
Project Duration-25
Total Cost= Direct Cost +
[Indirect Cost X Duration]
= 7560 + [160 X 25]
= 11,560/-](https://image.slidesharecdn.com/5-220405074853/85/5-Production-Scheduling-and-Sequencing-pptx-75-320.jpg)
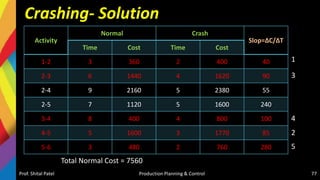
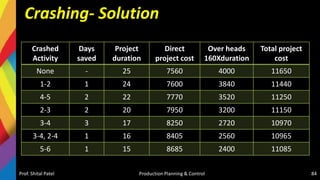
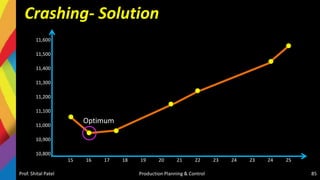
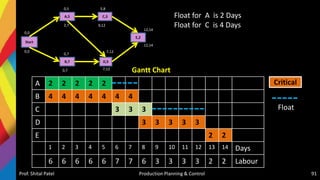
![Crashing- Solution
1. Crashing Activity 1-2: As min. slop is 40 for activity 1-2, we will Crash it first
Prof. Shital Patel Production Planning & Control 78
1 2
3
4
5
6
0 0
2 2
8 8
16 16
21 21
24 24
3
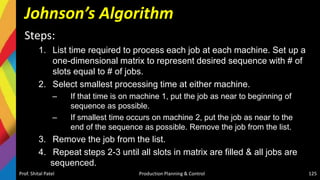
6
9
8
7
5
2
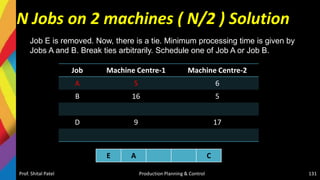
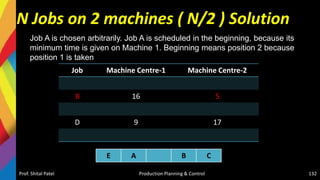
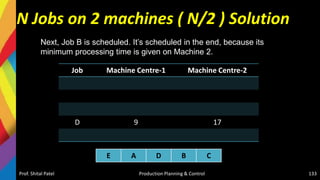
Project Duration-24
Total Cost = {Direct Cost + [Crash
Cost Slop X Crash Duration]} +
[Indirect Cost X Duration]
= {7560 + [40 X 1] } + [160 X 24]
= 7600 + 3840 = 11,440/-](https://image.slidesharecdn.com/5-220405074853/85/5-Production-Scheduling-and-Sequencing-pptx-78-320.jpg)
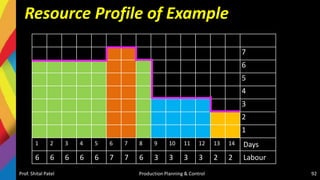
![Crashing- Solution
2. Crashing Activity 4-5: As next min. slop is 85 for activity 4-5, we will Crash it now
Prof. Shital Patel Production Planning & Control 79
1 2
3
4
5
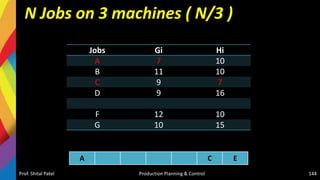
6
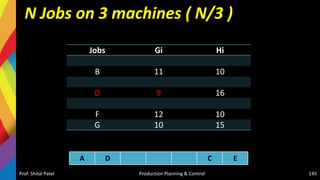
0 0
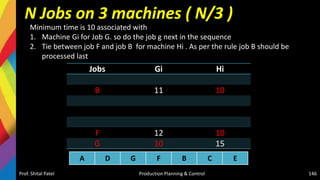
2 2
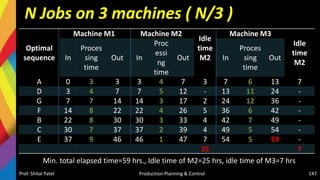
8 8
16 16
19 19
22 22
2
6
9
8
7
5
3
Project Duration-22
Total Cost = [ Direct Cost of previous
crashing + [Crash Cost X Crash time]}
+ [Indirect Cost X Duration]
= {7600 + [85 X 2]} + [160 X 22]
= 7770 + 3520 = 11,290/-
3](https://image.slidesharecdn.com/5-220405074853/85/5-Production-Scheduling-and-Sequencing-pptx-79-320.jpg)
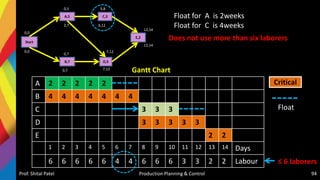
![Crashing- Solution
3. Crashing Activity 2-3: As next min. slop is 90 for activity 2-3, we will Crash it now
Prof. Shital Patel Production Planning & Control 80
1 2
3
4
5
6
0 0
2 2
6 6
14 14
17 17
20 20
2
6
9
8
7
3
3
4
Project Duration-20
Total Cost = [ Direct Cost of previous
crashing + [Crash Cost X Crash time]}
+ [Indirect Cost X Duration]
= {7770 + [90 X 2]} + [160 X 20]
= 7950 + 3200 = 11,150/-](https://image.slidesharecdn.com/5-220405074853/85/5-Production-Scheduling-and-Sequencing-pptx-80-320.jpg)
![Crashing- Solution
4. Crashing Activity 3-4: As next min. slop is 100 for activity 3-4, we will Crash it now. If we crash 3-4
fully by 4 days then CP will be changed. Therefore to maintain original CP containing 3-4, we will crash it
by 3 days only
Prof. Shital Patel Production Planning & Control 81
1 2
3
4
5
6
0 0
2 2
6 6
11 11
14 14
17 17
2
4
9
8
7
3
3
5
Project Duration-17
Total Cost = [ Direct Cost of previous
crashing + [Crash Cost X Crash time]}
+ [Indirect Cost X Duration]
= {7950 + [100 X 3]} + [160 X 17]
= 8250 + 2720 = 10,970/-](https://image.slidesharecdn.com/5-220405074853/85/5-Production-Scheduling-and-Sequencing-pptx-81-320.jpg)
![Crashing- Solution
5. Crashing Activity 2-4 & 3-4: If we crash 2-3 & 3-4 simultaneously by 1 day then total
cost (100+55=155) which is less than indirect cost 160. so we can crash both together
Prof. Shital Patel Production Planning & Control 82
1 2
3
4
5
6
0 0
2 2
6 6
10 10
13 13
16 16
2
4
9
5
7
3
3
4
8
Project Duration-16
Total Cost = [ Direct Cost of previous
crashing + [Crash Cost X Crash time]}
+ [Indirect Cost X Duration]
= {8250 + [155 X 1]} + [160 X 16]
= 8405 + 2560 = 10,965/-](https://image.slidesharecdn.com/5-220405074853/85/5-Production-Scheduling-and-Sequencing-pptx-82-320.jpg)
![Crashing- Solution
6. Crashing Activity 5-6: As next min. slop is 280 for activity 5-6, we will
Crash it now.
Prof. Shital Patel Production Planning & Control 83
1 2
3
4
5
6
0 0
2 2
6 6
10 10
13 13
15 15
2
4
8
4
7
3
3
2
Project Duration-15
Total Cost = [ Direct Cost of previous
crashing + [Crash Cost X Crash time]}
+ [Indirect Cost X Duration]
= {8405 + [280 X 1]} + [160 X 15]
= 8685 + 2400 = 11,085/-](https://image.slidesharecdn.com/5-220405074853/85/5-Production-Scheduling-and-Sequencing-pptx-83-320.jpg)
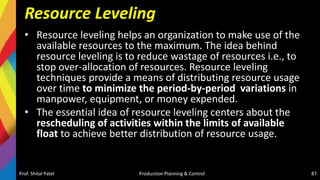
![Resource Leveling
• Resource leveling is a technique used to examine unbalanced use
of resources (usually people or equipment) over time, and for
resolving over-allocations or conflicts resulting from scheduling
certain tasks simultaneously. Such conflicts are:
– more resources such as machines or people are needed are available,
or
– a specific person is needed in both tasks, the tasks will have be
rescheduled concurrently or even sequentially to manage the
constraint.
• It is used to balance the workload of primary resources over course of the
project[s], usually at the expense of one of traditional triple constraints
(time, cost, scope)
Prof. Shital Patel Production Planning & Control 86](https://image.slidesharecdn.com/5-220405074853/85/5-Production-Scheduling-and-Sequencing-pptx-86-320.jpg)


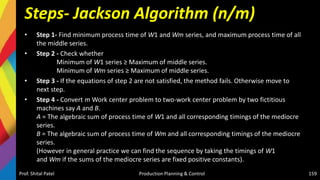
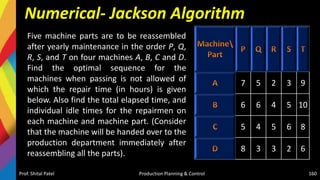
![Solution-Jackson Algorithm (n/m)
Checking Sequencing algorithm rules :
Minimum repair time of P series [Minimum (tP,j)] = (tP,C) = 5
Minimum repair time of T series [Minimum (tT,j)] = (tT,D) = 6
And maximum repair time of Q, R, S series [Maximum (tQ,j tR,j tS,j)] = {6,
5, 6}, respectively.
Since the condition Minimum (tT,j) > = Maximum (tQ,j tR,j tS,j) is satisfied,
the given problem can be converted into a four jobs and two machines
(say X and Y) problem as
–tX,j = (tP,j + tQ,j + tR,j + TS,j )
– tY,j = (tQ,j + tR,j + tS,j + TT,j )
Prof. Shital Patel Production Planning & Control 161
17 21 20 16
19 25 23 14](https://image.slidesharecdn.com/5-220405074853/85/5-Production-Scheduling-and-Sequencing-pptx-161-320.jpg)