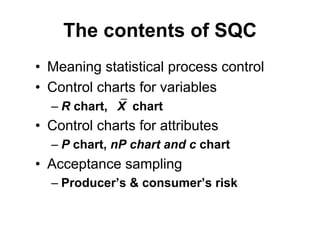
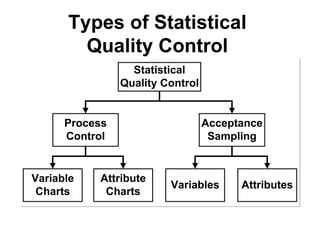
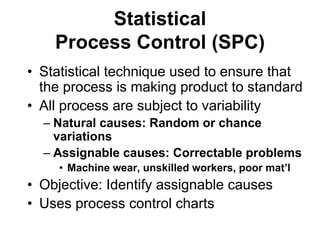
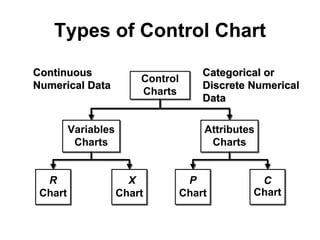
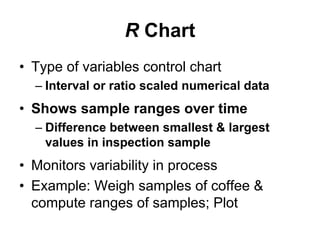
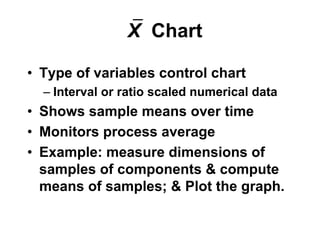
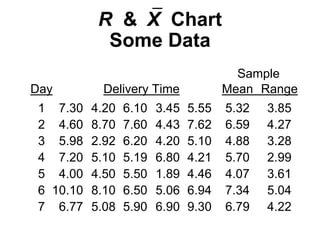
Introduction to
Statistical Quality Control
The contents of SQC
• Meaning statistical process control
• Control charts for variables
– R chart, ⎯X chart
• Control charts for attributes
– P chart, nP chart and c chart
• Acceptance sampling
– Producer’s & consumer’s risk
Statistical
Quality Control (SQC)
• Uses mathematics (i.e., statistics)
• Involves collecting data, organizing &
interpreting those collected data
• Objective: To Regulate product quality
• These are Used to
– Control the process as and when the
products are produced, and
– Inspect samples of finished products
Types of Statistical
Quality Control
• Characteristics for
which one focuses on
defects
• Classify products as
either ‘good’ or ‘bad’,
or count # defects
– e.g., radio works or not
• Categorical or discrete
random variables
Attributes
Attributes
Quality Characteristics
• Characteristics that
one can measure
– e.g., weight, length
• May be whole
number or fractional
• Continuous random
variables
Variables
Variables
Statistical
Process Control
Statistical
Process Control (SPC)
• Statistical technique used to ensure that
the process is making product to standard
• All process are subject to variability
– Natural causes: Random or chance
variations
– Assignable causes: Correctable problems
• Machine wear, unskilled workers, poor mat’l
• Objective: Identify assignable causes
• Uses process control charts
Purpose of Control Chart
• Show changes in data pattern
– e.g., trends
• Make corrections before process is out of
control
• Show causes of changes in data
– Assignable causes
• Data outside control limits or trend in data
– Natural causes
• Random variations around average
Statistical Process Control
Steps
Types of Control Chart
R X P C
R X P C
Continuous
Continuous
Numerical Data
Numerical Data
Categorical or
Categorical or
Discrete Numerical
Discrete Numerical
Data
Data
R Chart
R Chart
• Type of variables control chart
– Interval or ratio scaled numerical data
• Shows sample ranges over time
– Difference between smallest & largest
values in inspection sample
• Monitors variability in process
• Example: Weigh samples of coffee &
compute ranges of samples; Plot
R &⎯X Chart
Hotel Data
R &⎯X Chart
Hotel Data
Sample
Day Delivery Time Mean Range
1 7.30 4.20 6.10 3.45 5.55 5.32 3.85
7.30
7.30 -
- 3.45
3.45
Sample Range =
Sample Range =
Largest
Largest Smallest
Smallest
R &⎯X Chart
Hotel Data
Sample
Day Delivery Time Mean Range
1 7.30 4.20 6.10 3.45 5.55 5.32 3.85
2 4.60 8.70 7.60 4.43 7.62 6.59 4.27
3 5.98 2.92 6.20 4.20 5.10 4.88 3.28
4 7.20 5.10 5.19 6.80 4.21 5.70 2.99
5 4.00 4.50 5.50 1.89 4.46 4.07 3.61
6 10.10 8.10 6.50 5.06 6.94 7.34 5.04
7 6.77 5.08 5.90 6.90 9.30 6.79 4.22
⎯X Chart
• Type of variables control chart
– Interval or ratio scaled numerical data
• Shows sample means over time
• Monitors process average
• Example: measure dimensions of
samples of components & compute
means of samples; & Plot the graph.
R &⎯X Chart
Some Data
Sample
Day Delivery Time Mean Range
1 7.30 4.20 6.10 3.45 5.55 5.32 3.85
2 4.60 8.70 7.60 4.43 7.62 6.59 4.27
3 5.98 2.92 6.20 4.20 5.10 4.88 3.28
4 7.20 5.10 5.19 6.80 4.21 5.70 2.99
5 4.00 4.50 5.50 1.89 4.46 4.07 3.61
6 10.10 8.10 6.50 5.06 6.94 7.34 5.04
7 6.77 5.08 5.90 6.90 9.30 6.79 4.22
• Solution*
• Redesign the process
• Use TQM tools
– Cause & effect diagrams
– Process flow charts
– Pareto charts
If the process is out of control
Method
Method People
People
Material
Material Equipment
Equipment
Too
Long
Acceptance Sampling
Statistical
Quality Control
What Is
Acceptance Sampling?
• It is a “Form of quality testing” used for
incoming materials or finished goods
– e.g., purchased material & components
• Procedure
– Take one or more samples at random from
a lot (shipment) of items
– Inspect each of the items in the sample
– Decide whether to reject the whole lot
based on the inspection results
What Is an
Acceptance Plan?
• It is a “Set of procedure” for inspecting
incoming materials or finished goods
• It Identifies
– Type of sample
– Sample size (n)
– Criteria (c) used to reject or accept a lot
• Producer (supplier) & consumer (buyer)
must negotiate
• Select a single random sample of
size n = 40 bags of potatoes from
a shipment (lot) of 200 bags.
• Determine the sample mean
weight,⎯X, of the 40 bags.
• If⎯X ≥ 39.5 Kgs., accept the
shipment (lot) of 200 bags;
otherwise reject it & inspect all
bags.
Example Sampling Plan for
Variables
© 1995 Corel Corp.
Operating Characteristics Curve
• Shows how well a sampling plan
discriminates between good & bad lots
(shipments)
• Shows the relationship between the
probability of accepting a lot & its quality
Producer’s & Consumer’s
Risk
• Producer's risk (α)
– Probability of rejecting a good lot
– Probability of rejecting a lot when fraction
defective is AQL
• Consumer's risk (ß)
– Probability of accepting a bad lot
– Probability of accepting a lot when fraction
defective is LTPD

file000244.pdf

  • 1.
  • 2.
    The contents ofSQC • Meaning statistical process control • Control charts for variables – R chart, ⎯X chart • Control charts for attributes – P chart, nP chart and c chart • Acceptance sampling – Producer’s & consumer’s risk
  • 3.
    Statistical Quality Control (SQC) •Uses mathematics (i.e., statistics) • Involves collecting data, organizing & interpreting those collected data • Objective: To Regulate product quality • These are Used to – Control the process as and when the products are produced, and – Inspect samples of finished products
  • 4.
  • 5.
    • Characteristics for whichone focuses on defects • Classify products as either ‘good’ or ‘bad’, or count # defects – e.g., radio works or not • Categorical or discrete random variables Attributes Attributes Quality Characteristics • Characteristics that one can measure – e.g., weight, length • May be whole number or fractional • Continuous random variables Variables Variables
  • 6.
  • 7.
    Statistical Process Control (SPC) •Statistical technique used to ensure that the process is making product to standard • All process are subject to variability – Natural causes: Random or chance variations – Assignable causes: Correctable problems • Machine wear, unskilled workers, poor mat’l • Objective: Identify assignable causes • Uses process control charts
  • 8.
    Purpose of ControlChart • Show changes in data pattern – e.g., trends • Make corrections before process is out of control • Show causes of changes in data – Assignable causes • Data outside control limits or trend in data – Natural causes • Random variations around average
  • 9.
  • 10.
    Types of ControlChart R X P C R X P C Continuous Continuous Numerical Data Numerical Data Categorical or Categorical or Discrete Numerical Discrete Numerical Data Data
  • 11.
  • 12.
    R Chart • Typeof variables control chart – Interval or ratio scaled numerical data • Shows sample ranges over time – Difference between smallest & largest values in inspection sample • Monitors variability in process • Example: Weigh samples of coffee & compute ranges of samples; Plot
  • 13.
    R &⎯X Chart HotelData R &⎯X Chart Hotel Data Sample Day Delivery Time Mean Range 1 7.30 4.20 6.10 3.45 5.55 5.32 3.85 7.30 7.30 - - 3.45 3.45 Sample Range = Sample Range = Largest Largest Smallest Smallest
  • 14.
    R &⎯X Chart HotelData Sample Day Delivery Time Mean Range 1 7.30 4.20 6.10 3.45 5.55 5.32 3.85 2 4.60 8.70 7.60 4.43 7.62 6.59 4.27 3 5.98 2.92 6.20 4.20 5.10 4.88 3.28 4 7.20 5.10 5.19 6.80 4.21 5.70 2.99 5 4.00 4.50 5.50 1.89 4.46 4.07 3.61 6 10.10 8.10 6.50 5.06 6.94 7.34 5.04 7 6.77 5.08 5.90 6.90 9.30 6.79 4.22
  • 15.
    ⎯X Chart • Typeof variables control chart – Interval or ratio scaled numerical data • Shows sample means over time • Monitors process average • Example: measure dimensions of samples of components & compute means of samples; & Plot the graph.
  • 16.
    R &⎯X Chart SomeData Sample Day Delivery Time Mean Range 1 7.30 4.20 6.10 3.45 5.55 5.32 3.85 2 4.60 8.70 7.60 4.43 7.62 6.59 4.27 3 5.98 2.92 6.20 4.20 5.10 4.88 3.28 4 7.20 5.10 5.19 6.80 4.21 5.70 2.99 5 4.00 4.50 5.50 1.89 4.46 4.07 3.61 6 10.10 8.10 6.50 5.06 6.94 7.34 5.04 7 6.77 5.08 5.90 6.90 9.30 6.79 4.22
  • 17.
    • Solution* • Redesignthe process • Use TQM tools – Cause & effect diagrams – Process flow charts – Pareto charts If the process is out of control Method Method People People Material Material Equipment Equipment Too Long
  • 18.
  • 19.
  • 20.
    What Is Acceptance Sampling? •It is a “Form of quality testing” used for incoming materials or finished goods – e.g., purchased material & components • Procedure – Take one or more samples at random from a lot (shipment) of items – Inspect each of the items in the sample – Decide whether to reject the whole lot based on the inspection results
  • 21.
    What Is an AcceptancePlan? • It is a “Set of procedure” for inspecting incoming materials or finished goods • It Identifies – Type of sample – Sample size (n) – Criteria (c) used to reject or accept a lot • Producer (supplier) & consumer (buyer) must negotiate
  • 22.
    • Select asingle random sample of size n = 40 bags of potatoes from a shipment (lot) of 200 bags. • Determine the sample mean weight,⎯X, of the 40 bags. • If⎯X ≥ 39.5 Kgs., accept the shipment (lot) of 200 bags; otherwise reject it & inspect all bags. Example Sampling Plan for Variables © 1995 Corel Corp.
  • 23.
    Operating Characteristics Curve •Shows how well a sampling plan discriminates between good & bad lots (shipments) • Shows the relationship between the probability of accepting a lot & its quality
  • 24.
    Producer’s & Consumer’s Risk •Producer's risk (α) – Probability of rejecting a good lot – Probability of rejecting a lot when fraction defective is AQL • Consumer's risk (ß) – Probability of accepting a bad lot – Probability of accepting a lot when fraction defective is LTPD