Downloaded 10 times
![Block Diagram
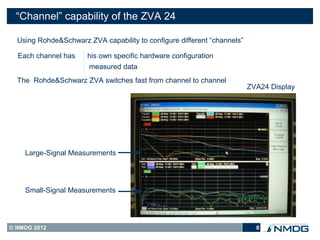
Measure at large-signal frequency grid and
at small-signal frequency grid, sweeping source 2
Network Analyzer Receivers
Large Signal ` (*) (*)
Conditions
ZS
f0 DUT
External RF source 1 ZL
or
VNA RF source 1 “Measure S-par” 50 Ohm
Large Signal
(depends on VNA)
Conditions
VNA couplers
or VNA RF source 2
external (low-loss) couplers [similar to S-par measurement]
Absolute Calibration Planes
(*) Other configurations possible, e.g. position couplers, use of splitters,
depending on power requirements
© NMDG 2012 5](https://image.slidesharecdn.com/stabilityunderlargesignalconditionspresentation-120619170954-phpapp01/85/Stability-under-Large-Signal-Conditions-Presentation-5-320.jpg)
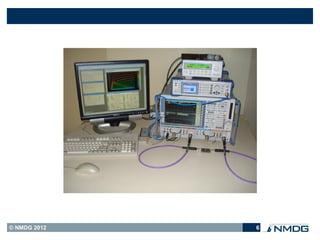
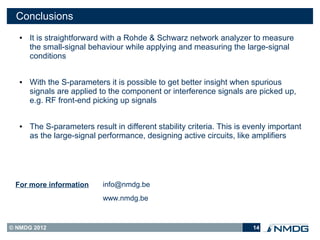

The document discusses the importance of combining large-signal and small-signal measurements using a vector network analyzer for characterizing amplifiers and assessing stability. It outlines practical setups, measurement techniques, and the impact of spurious and interference signals, emphasizing the value of s-parameters in analyzing amplifier behavior. Conclusions highlight the simplicity of using a Rohde & Schwarz network analyzer for achieving comprehensive insights into both small-signal and large-signal conditions.


![RF Circuit Design - [Ch2-2] Smith Chart](https://cdn.slidesharecdn.com/ss_thumbnails/ch2-2-150613064401-lva1-app6891-thumbnail.jpg?width=640&height=640&fit=bounds)

![RF Circuit Design - [Ch4-1] Microwave Transistor Amplifier](https://cdn.slidesharecdn.com/ss_thumbnails/ch4-1-150613064409-lva1-app6892-thumbnail.jpg?width=640&height=640&fit=bounds)
![RF Circuit Design - [Ch3-1] Microwave Network](https://cdn.slidesharecdn.com/ss_thumbnails/ch3-1-150613064402-lva1-app6892-thumbnail.jpg?width=640&height=640&fit=bounds)
![RF Circuit Design - [Ch3-2] Power Waves and Power-Gain Expressions](https://cdn.slidesharecdn.com/ss_thumbnails/ch3-2-150613064404-lva1-app6891-thumbnail.jpg?width=640&height=640&fit=bounds)


![RF Circuit Design - [Ch4-2] LNA, PA, and Broadband Amplifier](https://cdn.slidesharecdn.com/ss_thumbnails/ch4-2-150613064410-lva1-app6891-thumbnail.jpg?width=640&height=640&fit=bounds)


![RF Circuit Design - [Ch1-1] Sinusoidal Steady-state Analysis](https://cdn.slidesharecdn.com/ss_thumbnails/ch1-1-150613064348-lva1-app6891-thumbnail.jpg?width=640&height=640&fit=bounds)


![5G Explained! A High Level Overview [Introduction]](https://cdn.slidesharecdn.com/ss_thumbnails/5gexplainedahighleveloverview-260119165306-cc137a3e-thumbnail.jpg?width=640&height=640&fit=bounds)


