RF Circuit Design - [Ch4-1] Microwave Transistor Amplifier
•
8 likes•10,860 views

E.E. Essential Knowledge Sereies My Online Courses: https://www.byparams.com/courses Microwave Transistor Amplifier
![Department of Electronic Engineering, NTUT
Power Gain Equations
2 2
2
212 2
22
1 1
1 1
s LL
T
AVS in s L
P
G S
P S
2 2
2
212 2
11
1 1
1 1
s LL
T
AVS s out L
P
G S
P S
2
2
212 2
22
11
1 1
LL
p
in in L
P
G S
P S
2
2
212 2
11
1 1
1 1
sAVN
A
AVS s out
P
G S
P S
• Transducer Power Gain
• Operating Power Gain
• Available Power Gain
Transistor
[S]
sE
sZ
LZ
PAVNPAVS PLPin
Ms
interface interface
ML
2/45](data:image/gif;base64,R0lGODlhAQABAIAAAAAAAP///yH5BAEAAAAALAAAAAABAAEAAAIBRAA7)
Recommended
Recommended
More Related Content
What's hot
What's hot (20)
Viewers also liked
Viewers also liked (18)
Similar to RF Circuit Design - [Ch4-1] Microwave Transistor Amplifier
Similar to RF Circuit Design - [Ch4-1] Microwave Transistor Amplifier (20)
More from Simen Li
More from Simen Li (20)
Recently uploaded
Recently uploaded (20)
RF Circuit Design - [Ch4-1] Microwave Transistor Amplifier
- 1. Chapter 4-1 Microwave Transistor Amplifier Design Chien-Jung Li Department of Electronics Engineering National Taipei University of Technology
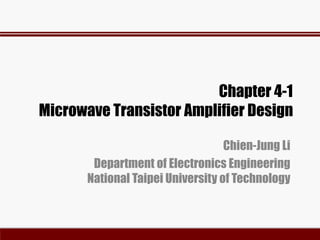
- 2. Department of Electronic Engineering, NTUT Power Gain Equations 2 2 2 212 2 22 1 1 1 1 s LL T AVS in s L P G S P S 2 2 2 212 2 11 1 1 1 1 s LL T AVS s out L P G S P S 2 2 212 2 22 11 1 1 LL p in in L P G S P S 2 2 212 2 11 1 1 1 1 sAVN A AVS s out P G S P S • Transducer Power Gain • Operating Power Gain • Available Power Gain Transistor [S] sE sZ LZ PAVNPAVS PLPin Ms interface interface ML 2/45
- 3. Department of Electronic Engineering, NTUT Example (I) • Calculate the PAVS, Pin, PAVN, and PL 1 50Z Input Matching Network Output Matching Network 1 10 0E 2 50Z 0.5 120s in out 0.4 90L sZ inZ outZ LZ S 11 12 21 22 0.6 160 0.045 16 2.5 30 0.5 90 S S S S S Transistor S parameters: 12 21 11 22 0.627 164.6 1 L in L S S S S 12 21 22 11 0.471 97.63 1 s out s S S S S 2 2 2 212 2 22 1 1 9.43 1 1 s LL T AVS in s L P G S P S or 9.75 dB 3/45
- 4. Department of Electronic Engineering, NTUT Example (II) 2 2 212 2 22 11 13.51 1 1 LL p in in L P G S P S or 11.31 dB 2 2 212 2 11 1 1 9.55 1 1 sAVN A AVS s out P G S P S or 9.8 dB in AVS sP P M T p sG G Mand 9.43 0.698 1.56 dB 13.51 T s p G M G 2 2 2 1 1 0.6983 1.56 dB 1 s in s s in M L AVN LP P M T A LG G Mand 9.43 0.9874 0.055 dB 9.55 T L A G M G 2 2 2 1 1 0.9874 0.055 dB 1 L out L out L M 2 2 1 1 10 0.25 W 8 8 50 AVS E P R 0.25 W 0.1745 Win sP M 0.25 W 2.358 WL TP G 2.358 WL AVN LP P M 2.39 WAVNP 4/45
- 5. Department of Electronic Engineering, NTUT Stability 12 21 11 221 L in L S S S S 12 21 22 111 s out s S S S S • The stability of an amplifier, or its resistance to oscillate, is a very important consideration in a design and can be determined from the S parameters, the matching networks, and the terminations. • Oscillations are possible when either the input or output port presents a negative resistance, i.e., or ( or for a unilateral device). 1in 1out 22 1S11 1S Transistor [S] sE sZ out LZ in s L • The two-port network is said to be unconditionally stable at a given frequency if the real parts of Zin and Zout are greater then zero for a passive load and source impedances. For potentially unstable, that is, some passive load and source terminations can produce input and output impedances having a negative real part. 5/45
- 6. Department of Electronic Engineering, NTUT Stability Considerations 1s 12 21 22 11 1 1 s out s S S S S 1L 12 21 11 22 1 1 L in L S S S S 22 11 12 21 2 2 2 2 22 22 L S S S S S S 11 22 12 21 2 2 2 2 11 11 s S S S S S S 11 22 12 21S S S S • In terms of reflection coefficients, the conditions for unconditionally stability at a given frequency are • The region where produces is determined.L 1in • Stability Circles include and Transistor [S] sE sZ out LZ in s L • The region where produces is determined.s 1out and where 6/45
- 7. Department of Electronic Engineering, NTUT The Stability Circles 12 21 2 2 22 L S S r S 22 11 2 2 22 L S S C S 12 21 2 2 11 s S S r S 11 22 2 2 11 s S S C S • Output Stability Circle ( values for )L 1in Center Radius • Input Stability Circle ( values for ) Center Radius s 1out 1in 1out LC Lr LC sC sr sC -planeL -planes 7/45
- 8. Department of Electronic Engineering, NTUT Determine the Stable Region LC LC Lr 1in sr sC sC 1out • How do we determine the stable region? Inside or outside the stability circle? The and can help! (see next two slides)11S -planeL -planes Output Stability Circle Input Stability Circle 22S 8/45
- 9. Department of Electronic Engineering, NTUT Determine the Stable Region of Plane LC LC Lr 1in 11 1S 12 21 11 221 L in L S S S S 0L LC LC 0L Lr 1in • Criteria: virtually make , then and0L 11in S L oZ Z -planeL -planeL L Case (1): 11 1S Case (2): stable region stable region 9/45
- 10. Department of Electronic Engineering, NTUT Determine the Stable Region of Plane 12 21 22 111 s out s S S S S 22 1S 22 1S s Case (1): Case (2): • Criteria: virtually make , then and0s 22out S s oZ Z stable region stable region -planes -planes 0s 0s sC sC sC srsr sC 1out 1out 10/45
- 11. Department of Electronic Engineering, NTUT Unconditionally Stable (I) -planeL -planes 0s 0L LC sC sC sr Lr LC 1in 1out • For the cases of and11 1S 22 1S Make the stability circles completely outside the Smith Chart! 11/45
- 12. Department of Electronic Engineering, NTUT Unconditionally Stable (II) • For the cases of and11 1S 22 1S Make the stability circles completely enclose the Smith Chart! -planeL -planes 0s 0L LC sCsC sr Lr LC 1in 1out 12/45
- 13. Department of Electronic Engineering, NTUT Stability Tests 2 2 2 11 22 12 21 1 1 2 S S K S S • Rollet’s Condition (K-∆ test): For unconditional stability 11 22 12 21 1S S S Sand The K-∆ test is a mathematically rigorous condition for unconditional stability. However, it cannot be used to compare the relative stability of two or more devices (or bias conditions) since it involves constraints on two parameters. K>1 and |∆|<1 must simultaneously hold for unconditionally stable • In 1992, Edwards, et. al. derived a new criterion that involves only a single parameter μ for unconditional stability. Thus, if μ > 1, the device is unconditionally stable. In addition, it can be said that larger values of μ imply greater stability. 2 11 22 11 12 21 1 1 S S S S S 13/45
- 14. Department of Electronic Engineering, NTUT Example (I) Determined the stability. If the transistor is potentially unstable at a given frequency, draw the input and output stability circles. 2 2 2 11 22 12 21 1 1 2 S S K S S 11 22 12 21 1S S S S K 0.482 0.221 123 0.857 0.173 162.9 1.31 0.174 160 1.535 0.226 121 (GHz)f 0.5 1 2 4 • The S-parameter of a BJT at VCE = 15 V and IC = 15 mA at f=500 MHz, 1 GHz, and 4 GHz are as follows: 2 11 22 11 12 21 1 1 S S S S S 0.49 14/45
- 15. Department of Electronic Engineering, NTUT Example (II) 22 11 2 2 22 L S S C S 12 21 2 2 22 L S S r S 11 22 2 2 11 s S S C S 12 21 2 2 11 s S S r S sC sr 1.36 157.6 0.558 2.8 57.86 2.18 1.28 169 0.315 2.62 51.3 (GHz)f 0.5 1 LC Lr 1.71 15/45
- 16. Department of Electronic Engineering, NTUT Stabilization Methods • Stabilization methods described below are used to stabilize the transistor unconditionally. 1R 2R 6R 5R 3R 4R Stabilization of input port through series or shunt resistance, eg., R1, R2. Stabilization of output port through series or shunt resistance, eg., R3, R4. Stabilization using series or shunt negative feedback, eg., R5, R6. Inductances and capacitances are also commonly used as feedback elements. Stabilization results in a loss of gain and an increase in noise figure. 16/45
- 17. Department of Electronic Engineering, NTUT Example (I) • The S-parameter of a transistor at f=800 MHz are : 11 0.65 95S 12 0.035 40S 21 5 115S 22 0.8 35S Determine the stability circle and show how resistive loading can stabilize the transistor. 2 2 2 11 22 12 21 1 0.547 2 S S K S S 11 22 12 21 0.504 249.6S S S S Since K<1, the transistor is potentially unstable at f=800MHz. 1.79 122sC 1.04sr 1.3 48LC 0.45Lr Input Stability Circle: Output Stability Circle: 17/45
- 18. Department of Electronic Engineering, NTUT Input and Output Stability Circle 1.79 122sC 1.3 48LC 18/45
- 19. Department of Electronic Engineering, NTUT Stabilization – Input Series Resistance 1.79 122sC 1.3 48LC 9 s 9s sZ Z s sZ 19/45
- 20. Department of Electronic Engineering, NTUT Stabilization – Input Shunt Resistance 1.79 122sC 1.3 48LC 71.5 20/45
- 21. Department of Electronic Engineering, NTUT Stabilization – Output Series Resistance 1.79 122sC 1.3 48LC 29 21/45
- 22. Department of Electronic Engineering, NTUT Stabilization – Output Shunt Resistance 1.79 122sC 1.3 48LC 500 22/45
- 23. Department of Electronic Engineering, NTUT Stability Considerations (I) • For a unilateral transistor, S12=0 (or it is so small that can be set to zero). In unilateral case, and (the transistor output signal would not go through back to the input). If , the transistor presents a negative resistance at the input, and if the transistor presents a negative resistance at the output. 11in S 22out S 11 0S 22 0S • For unconditionally stability any passive load and or source in the network must produce a stable condition. For and , we want the stability circles to fall completely outside the Smith Chart. (Or completely enclosed for and ) 11 0S 22 0S 11 0S 22 0S • It is convenient to use the μ parameter to check the stability, the transistor will be more stable for a larger μ. • For the unilateral case, we have unconditionally stability if and for all passive source and load terminations.11 0S 22 0S 23/45
- 24. Department of Electronic Engineering, NTUT Stability Considerations (II) • A potentially unstable transistor can be made unconditionally stable by either resistively loading the transistor or by adding negative feedback. These techniques are nor recommended in narrowband amplifiers because of the resulting degradation in power gain, noise figure, and VSWRs. • Usually, stabilizing one port of a transistor results in an unconditionally stable device. • All four choices of resistive loading affects the gain performance of the amplifier. In practice, resistive loading at the input is not used because it produces a significant deterioration in the noise performance of the amplifier. • Negative feedback can be used to stabilize a transistor by neutralizing S12 (making S12=0). However, this is not commonly done. In a broadband design, a common procedure is to use resistive loading to stabilize the transistor and negative feedback to provide the proper ac performance (constant gain and low input and output VSWR). 24/45
- 25. Department of Electronic Engineering, NTUT Unilateral Transducer Power Gain 11S 1E oZ oZ Transistor oG Output matching LG Input matching sG s L22S 2 2 2 212 2 11 22 1 1 1 1 s L TU s o L s L G S G G G S S 2 2 11 1 1 s s s G S 2 21oG S 2 2 22 1 1 L L L G S (dB) (dB) (dB) (dB)TU s o LG G G G • Unilateral Transducer Power Gain GTU • The term Gs and GL represent the gain or loss produced by the matching or mismatching of the input or output circuits. 12 0S 25/45
- 26. Department of Electronic Engineering, NTUT Maximum Unilateral Transducer Power Gain 11S 1E oZ oZ Transistor oG Output matching ,maxLG Input matching ,maxsG 11s S 22L S 22S 11s S 22L S ,max 2 11 1 1 sG S ,max 2 22 1 1 LG S 2 ,max ,max ,max 212 2 11 22 1 1 1 1 TU s o LG G G G S S S • Maximum Unilateral Transducer Power Gain GTU,max Optimize and to provide maximum gain in Gs and GL.s L and 2 2 11 1 1 s s s G S 2 2 22 1 1 L L L G S and and 26/45
- 27. Department of Electronic Engineering, NTUT General Form of the Matching Gain 2 2 1 1 i i ii i G S • General form of the matching gains Gs and GL : with 11, and with 22i s ii i L ii (1) Unconditionally stable case: 1iiS ,max 2 1 1 i ii G S ,max0 i iG G i iiS For optimum terminations: Other values of (mismatched) produce Gi between zero and Gi,max:i • The values of that produce a constant gain Gi will be shown to lie in a circle in the Smith Chart. These circles are called constant Gi circles. i Constant Gs circles: i = s Constant GL circles: i = L 27/45
- 28. Department of Electronic Engineering, NTUT Constant Gi Circle – Unconditionally Stable • Normalized Gain Factor: 2 2 2 ,max 1 1 1 1 ii i i ii ii i ii i G g G S S G S such that 0 1ig • Constant Gi circle in the Smith Chart The values of that produce a constant values of gi lie in a circle. i i ii g gC r 2 1 1i i ii g ii i g S C S g 2 2 1 1 1 1i i ii g ii i g S r S g Each gi generates a constant Gi circle. When gi =1 gives 0igr ig iiC S and Maximum gain is represented by a point located at iiS giC gir iiS i iiS iU iV -planei Maximum gain Gi,max occurs Locate iiS Determine Gi and gi Use gi to find igr,igC Center: Radius: 28/45
- 29. Department of Electronic Engineering, NTUT Example (I) • The S parameters of a BJT measured at VCE = 10 V, IC = 30 mA, and the operating frequency f = 1 GHz, in a 50-Ohm system, are: 11 0.73 175 ,S 12 0,S 21 4.45 65 , andS 22 0.21 80S (a) Calculate the optimum terminations. (b) Calculate Gs,max, GL,max, and GTU,max in dB. (c) Draw several Gs constant-gain circles. (d) Design the input network for Gs = 2 dB. (a) 11 0.73 175s S 12 0S unilateral Optimum terminations: 22 0.21 80L S and 7.6 2.35sZ j and 48.5 21.5LZ j 29/45
- 30. Department of Electronic Engineering, NTUT Example (II) (b) ,max 2 11 1 2.141 3.31 dB 1 sG S ,max 2 22 1 1.046 0.195 dB 1 LG S 2 21 19.8 12.97 dBoG S The transistor inherently provides 12.97 dB gain ,max dB 3.31 12.97 0.195 16.47 dBTUG Input and output matching networks provide excess gain for transducer power (c) ,max 3.31 dBsG 30/45
- 31. Department of Electronic Engineering, NTUT Example (III) (d) Matching to Gs = 2dB 31/45
- 32. Department of Electronic Engineering, NTUT Constant Gi Circle – Potentially Unstable (2) Potentially unstable case: 1iiS 2 2 1 1 i i ii i G S Critical value of , 1 , andi c i ii G S i 2 2 21 1 1 1 i i i ii ii ii i g G S S S Since , thus 0ig 1iiS 2 1 1i i ii g ii i g S C S g 2 2 1 1 1 1i i ii g ii i g S r S g Maximum gain Gi,max (infinite) occurs Center Radius 32/45
- 33. Department of Electronic Engineering, NTUT When and , has a maximum value, and the ratio is bounded by Unilateral Figure of Merit (I) • When S12 can be set to zero, the design procedure is much simpler. In order to determine the error involved in assuming S12 = 0, we form the magnitude ratio of GT and GTU, namely, 2 1 1 T TU G G X 2 2 2 212 2 11 1 1 1 1 s L T s out L G S S 2 2 2 212 2 11 22 1 1 1 1 s L TU s L G S S S 12 21 11 221 1 s L s L S S X S S 2 2 1 1 1 1 T TU G GX X 11s S 22L S TUG 2 2 1 1 1 1 T TU G GU U is known as the Unilateral Figure of Merit and where 12 21 11 22 2 2 11 221 1 S S S S U S S where 33/45
- 34. Department of Electronic Engineering, NTUT Unilateral Figure of Merit (II) f dBU 5 10 15 • The value of U varies with frequency because of its dependence on the S parameter. 100 MHz 1 GHz @100 MHz, and 1 GHz 15 dB 0.03U 2 2 1 1 1 0.03 1 0.03 T TU G G 0.9426 1.031T TU G G 0.26 dB 0.26 dBT TU G G • The maximum error is ±0.26 dB at 100 MHz and 1 GHz. In some designs this error is small enough to justify the unilateral assumption. 34/45
- 35. Department of Electronic Engineering, NTUT Simultaneous Conjugate Match: Bilateral Case in 1E oZ oZ Transistor oG Output matching LG Input matching sG s Lout s in L out • Maximum Simultaneous Conjugate Matched Transducer Power Gain GT,max and 22 1 1 1 1 4 2 Ms B B C C and 12 21 11 221 L in s L S S S S 12 21 22 111 s out L s S S S S and 22 2 2 2 2 4 2 ML B B C C 2 2 2 1 11 221B S S 2 2 2 2 22 111B S S 1 11 22C S S 2 22 11C S S where 35/45
- 36. Department of Electronic Engineering, NTUT Stability and Simultaneous Conjugate Match 22 1 1 1 1 4 2 Ms B B C C 22 2 2 2 2 4 2 ML B B C C 1K 1K 1K 1K Simultaneous conjugate match can be achieved Simultaneous conjugate match doesn’t exist Potentially unstable or Unstable 1 1 Unconditionally stable Potentially unstable Any reference to a simultaneous conjugate match assumes that the two port network is unconditionally stable. 36/45
- 37. Department of Electronic Engineering, NTUT Maximum Stable and Available Gain 2 2 2 212 2 22 1 1 1 1 s L T in s L G S S in 1E oZ oZ Transistor oG Output matching LG Input matching sG s Lout s in Ms L out ML 2 2 21 2 ,max 212 2 1222 11 1 1 1 ML T Ms ML S G S K K SS • Maximum Simultaneous Conjugate Matched Transducer Power Gain GT,max and • Maximum Stable Gain (MSG) is defined when K =1: 21 12 MSG S G S (potentially unstable) (unconditionally stable) 37/45
- 38. Department of Electronic Engineering, NTUT Operating Power-Gain Circle 2 2 21 2 212 211 22 22 1 1 1 1 L p p L L L S G S g S S S • Unconditionally stable bilateral case: 2 2 2 2 2 2 2 2 22 11 11 22 2 1 1 1 1 2Re L L p L L L L g S S S S C 2 22 11C S S Gp and gp are the functions of the device S parameters and ΓL. The values of ΓL that produce a constant gp are shown to lie on a circle, known as an operating power-gain circle. L p pC r 2 2 2 221 p p p g C C g S 2 2 12 21 12 21 2 2 22 1 2 1 p p p p K S S g S S g r g S Center Radius where • Operating Power-Gain Circle: 38/45
- 39. Department of Electronic Engineering, NTUT Maximum Operating Power-Gain 2 2 12 21 12 21 2 2 22 1 2 1 p p p p K S S g S S g r g S • The maximum operating power gain occurs when rp = 0. 2 2 12 21 ,max 12 21 ,max1 2 0p pK S S g S S g 2 ,max 12 21 1 1pg K K S S 21 2 ,max ,max 12 1p T S G K K G S • The value of ΓL that produces Gp,max follows by substituting gp = gp,max for Cp. This value of ΓL = Cp,max must be equal to ΓML. ,max 2 ,max 2 2 ,max 221 p ML p p g C C g S 39/45
- 40. Department of Electronic Engineering, NTUT Maximum Operating Power Gain • For a given Gp,ΓL is selected from the constant operating power-gain circles. Gp,max, results when ΓL is selected at the distance where gp,max = Gp,max /|S21|2 . The maximum output power results when a conjugate match is selected at the input (i.e., ), and it follows that the input power is equal to the maximum available input power. Therefore, in this circumstances GT,max = Gp,max . The values of Γs and ΓL that result in Gp,max are identical to ΓMs and ΓML , respectively. s in in 1E oZ oZ Transistor oG Output matching LG Input matching sG s L • Design Procedure: 40/45
- 41. Department of Electronic Engineering, NTUT Example (I) • Design a microwave amplifier using a GaAs FET to operate f = 6 GHz with maximum transducer power gain. The transistor S parameters at the linear bias point, VDS = 4 V and IDS = 0.5 IDDS, are 11 0.641 171.3S 12 0.057 16.3S 21 2.058 28.5S 22 0.572 95.7S Use (1) Transducer power gain method (2) Operating power gain method to find the matching networks (3) Gp=9 dB amplifier design (1) Transducer power gain method 1.504K 0.3014 109.88 Unconditionally stable 0.1085UCheck unilateral: 0.89 dB 1 dBT TU G G S12 cannot be neglected (bilateral case) 1 2 1 20.9928, 0.8255, 0.4786 177.3 , 0.3911 103.9B B C C 0.762 177.3Ms 0.718 103.9ML 2 ,max 2.058 1.504 1.504 1 13.74 or 11.38 dB 0.057 TG 41/45
- 42. Department of Electronic Engineering, NTUT Example (II) (2) Operating power gain method: ,max 2 ,max 2 2 ,max 22 0.718 103.9 1 p ML p p g C C g S ,max ,max 2 2 21 13.74 3.24 2.058 p p G g S ,max 0pr 12 21 11 22 0.762 177.3 1 ML Ms in ML S S S S (3) Operating power gain method: Gp = 9 dB ,max ,max 13.74T pG G 2 2 21 2.058 4.235 or 6.27 dBS 2 21 7.94 1.875 4.235 p p G g S 1.504K 0.3014 109.88 2 0.3911 103.9C 0.431pr 0.508 103.9pC 42/45
- 43. Department of Electronic Engineering, NTUT Example (III) Select point A for matching: 0.36 47.5L 12 21 11 22 0.629 175.51 1 L s in L S S S S Since , it follows that GT = Gp = 9 dB s in 1 0.622 4.3 1 0.622out VSWR 43/45
- 44. Department of Electronic Engineering, NTUT Available Power-Gain Circle 2 2 21 2 212 222 11 11 1 1 1 1 s A a s s s S G S g S S S • Unconditionally stable bilateral case: 2 2 2 2 2 2 21 22 11 1 1 1 2Re sA a s s G g S S S C 1 11 22C S S Ga and ga are the functions of the device S parameters and Γs. The values of Γs that produce a constant ga are shown to lie on a circle, known as an available power-gain circle. s a aC r 1 2 2 111 a a a g C C g S 2 2 12 21 12 21 2 2 11 1 2 1 a a a a K S S g S S g r g S Center Radius • Available Power-Gain Circle: where 44/45
- 45. Department of Electronic Engineering, NTUT Design Procedures 1E oZ oZ Transistor oG Output matching LG Input matching sG s Lout • Design using operating power gain: • Design using available power gain: in 1E oZ oZ Transistor oG Output matching LG Input matching sG s L 45/45