Download as PDF, PPTX

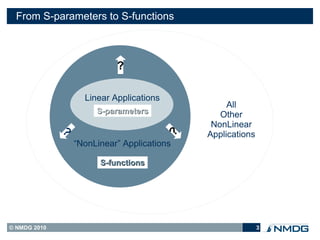
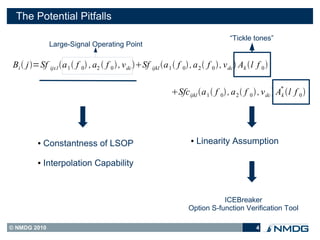
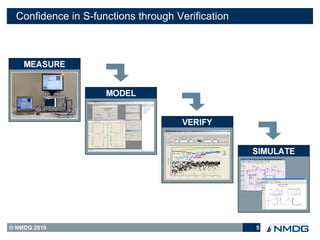
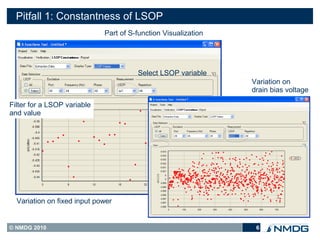
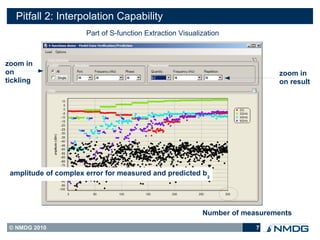
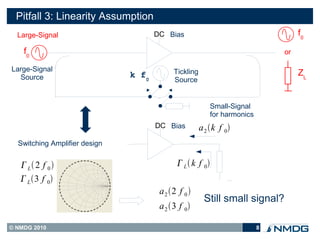
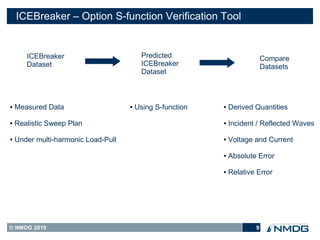
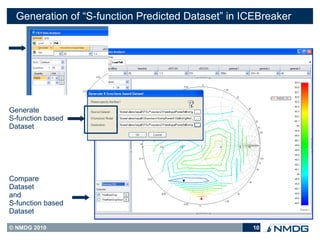
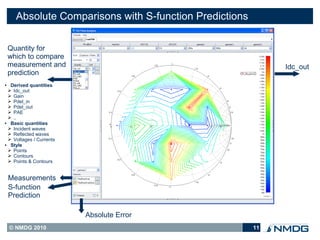
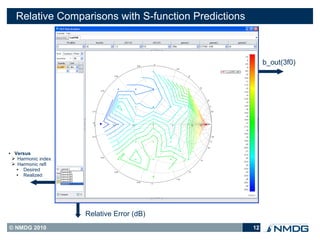


This document describes ICEBreaker, a tool for verifying S-parameter models of nonlinear devices against measured data. It discusses potential issues with S-parameter models like changes in operating point, interpolation errors, and the assumption of linearity. ICEBreaker addresses these by comparing S-parameter predicted data to complex multi-tone measured datasets, identifying errors in quantities like power, efficiency, and waves. The tool allows engineers to verify S-functions under realistic conditions to have confidence in their accuracy.


![RF Circuit Design - [Ch1-1] Sinusoidal Steady-state Analysis](https://cdn.slidesharecdn.com/ss_thumbnails/ch1-1-150613064348-lva1-app6891-thumbnail.jpg?width=640&height=640&fit=bounds)


![5G Explained! A High Level Overview [Introduction]](https://cdn.slidesharecdn.com/ss_thumbnails/5gexplainedahighleveloverview-260119165306-cc137a3e-thumbnail.jpg?width=640&height=640&fit=bounds)


