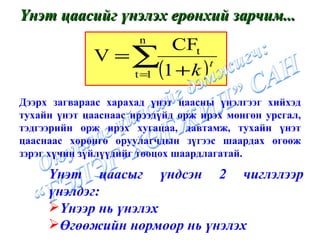
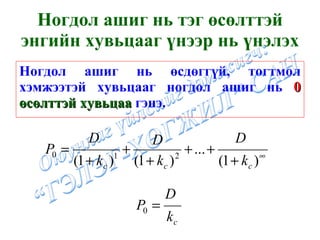
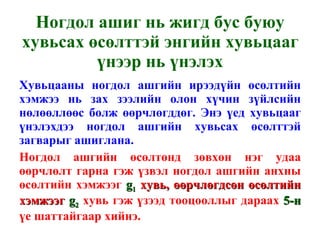
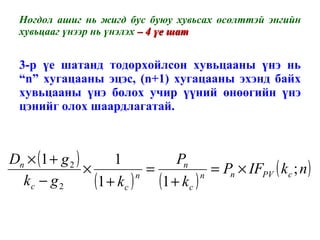
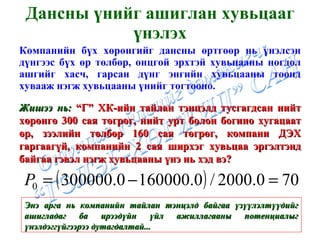
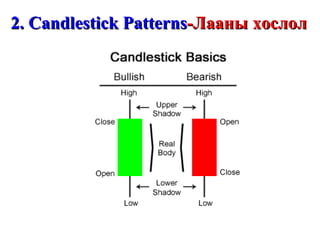
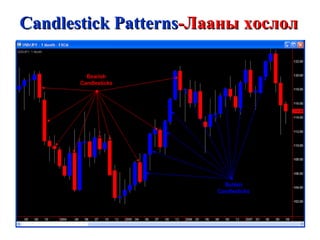
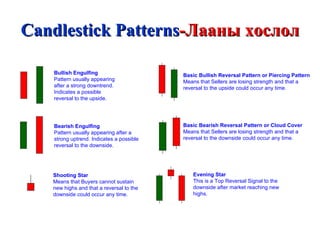
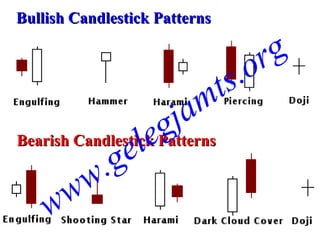
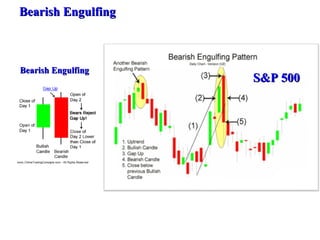
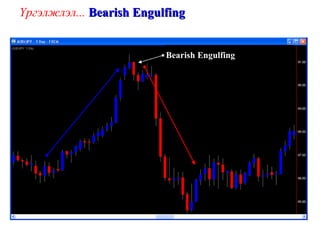
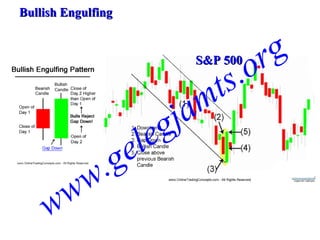
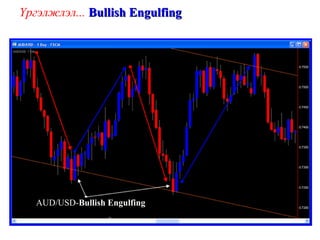
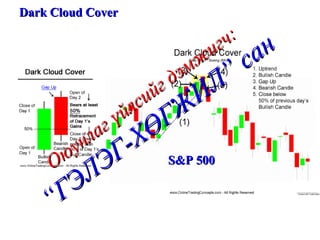
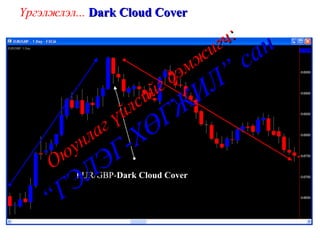
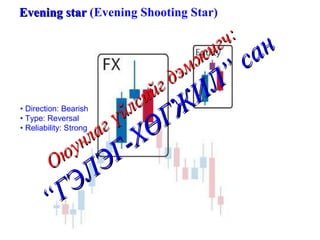
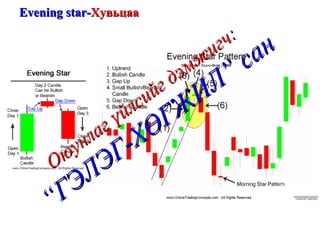
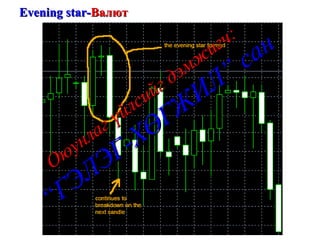
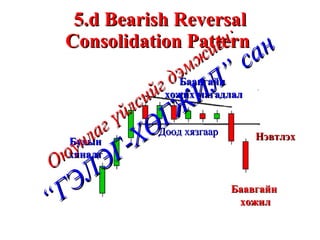
Candlestick Patterns -Лааныхослол Bullish Engulfing Pattern usually appearing after a strong downtrend. Indicates a possible reversal to the upside. Bearish Engulfing Pattern usually appearing after a strong uptrend. Indicates a possible reversal to the downside. Basic Bullish Reversal Pattern or Piercing Pattern Means that Sellers are losing strength and that a reversal to the upside could occur any time. Basic Bearish Reversal Pattern or Cloud Cover Means that Sellers are losing strength and that a reversal to the downside could occur any time. Shooting Star Means that Buyers cannot sustain new highs and that a reversal to the downside could occur any time. Evening Star This is a Top Reversal Signal to the downside after market reaching new highs.
99.
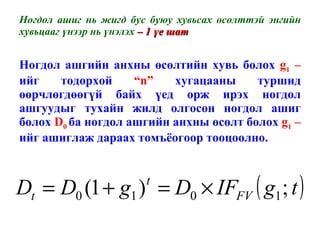
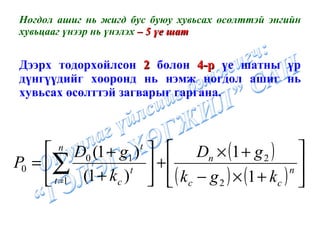
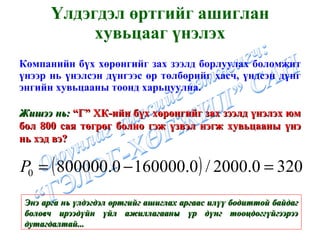
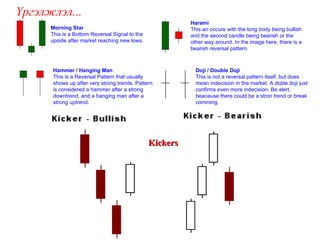
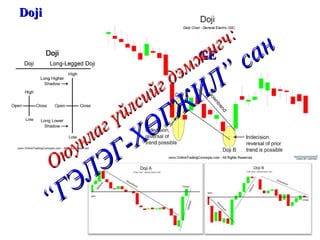
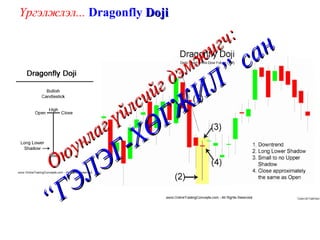
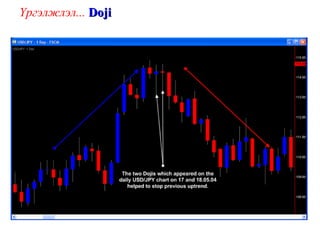
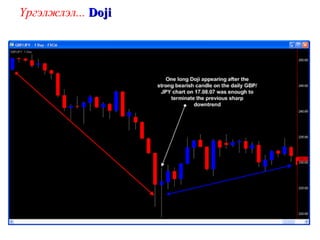
Үргэлжлэл... MorningStar This is a Bottom Reversal Signal to the upside after market reaching new lows. Hammer / Hanging Man This is a Reversal Pattern that usually shows up after very strong trends. Pattern is considered a hammer after a strong downtrend, and a hanging man after a strong uptrend. Harami This an occure with the long body being bullish and the second candle being bearish or the other way around. In the image here, there is a bearish reversal pattern. Doji / Double Doji This is not a reversal pattern itself, but does mean indecision in the market. A doble doji just confirms even more indecision. Be alert, beacause there could be a stron trend or break comming. Kickers
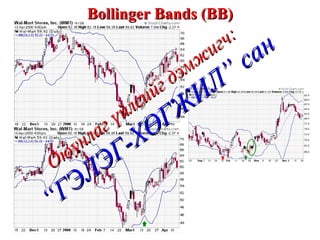
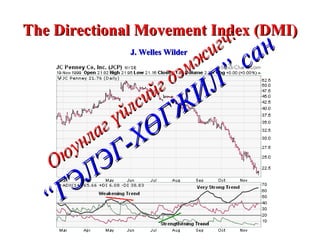
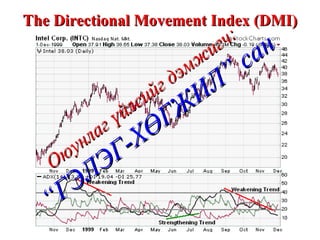
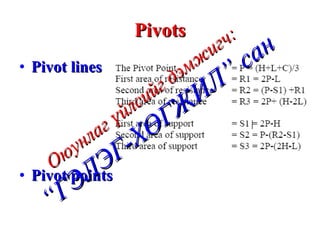
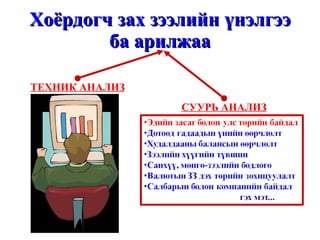
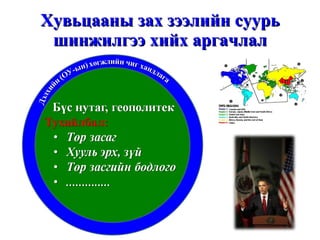
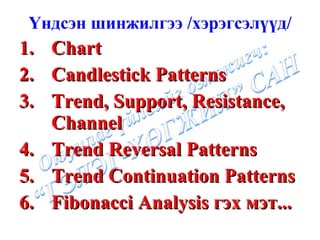
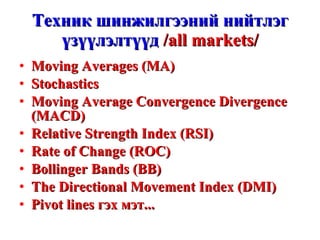
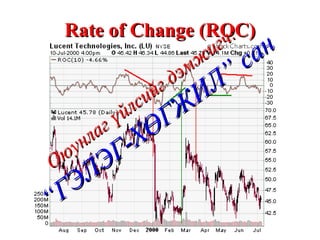
Техник шинжилгээний нийтлэгүзүүлэлтүүд /all markets/ Moving Averages (MA) Stochastics Moving Average Convergence Divergence (MACD) Relative Strength Index (RSI) Rate of Change (ROC) Bollinger Bands (BB) The Directional Movement Index (DMI) Pivot lines гэх мэт...
163.
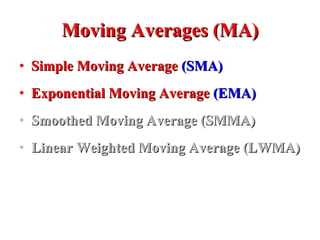
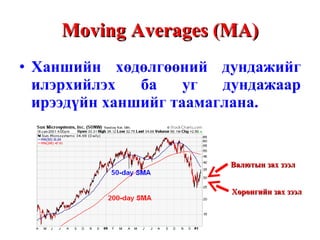
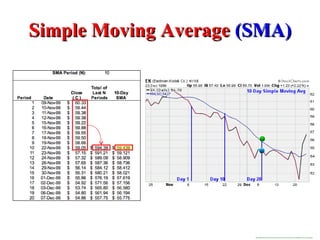
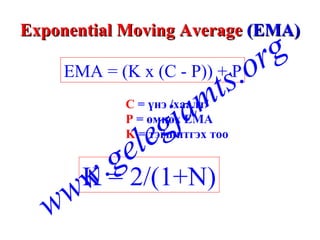
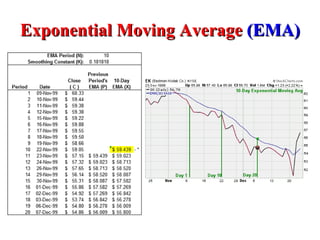
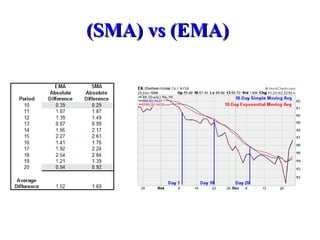
Moving Averages (MA)Simple Moving Average (SMA) Exponential Moving Average (EMA) Smoothed Moving Average (SMMA) Linear Weighted Moving Average (LWMA)
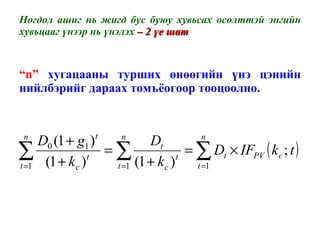
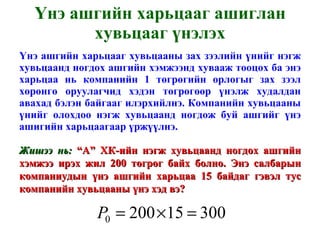
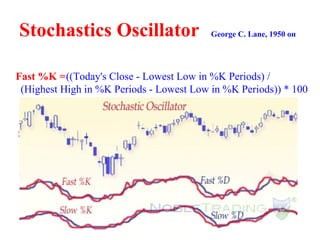
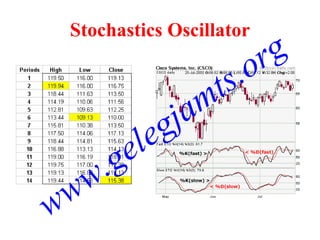
Stochastics Oscillator George C. Lane, 1950 он Fast %K = Slowing %K = 3-period moving average of Fast %K %D = 3-period simple moving average of Slowing %K ((Today's Close - Lowest Low in %K Periods) / (Highest High in %K Periods - Lowest Low in %K Periods)) * 100
Ашигласан ном, сурахбичиг, эх сурвалжууд 2/15/2010 Л.Жаргал, Ж.Бат-Өлзий “Санхүүгийн менежмент” 2008 он, УБ хот П.Баянсан “Бизнесийн санхүү” 2004 он , УБ хот Б.Бүжинлхам “Санхүүгийн удирдлага” 2004 он, УБ хот Bradford D.Jordan, Thomas W.Miller “Fundamentals of Investment, valuation and management” 4 th edition Bodie, Kane, Marcus “Investment” 6 th edition Ross W.Jordan “Fundamentals of corporate finance” 8 th edition Richard A Brealey, Stewart C Myers “ Principles of Corporate Finance ” 2007 Zvi Bodie, Alex Kane, Alan J.Marcus, Alan J.Marcus, Alex Kane “ Essentials of Investments ” 6 th edition 2005 Frederic S.Mishkin “ Economics of Money, Banking and Financial Markets ” 2009 J.Van Horne, John M.Wachowicz “ Fundamentals of Financial Management ” 13 th edition 2008 Alan C.Shapiro “ Multinational Financial Management ” 2009 Randolph Westerfield “ Fundamentals of Corporate Finance ” 2009 Eugene F.Brigham, Joel F.Houston “ Fundamentals of Financial Management ” 6 th edition 2008 Eugene F.Brigham, Joel F.Houston “ Fundamentals of Financial Management ” 12 th edition 2009 Stanley B.Block, Geoffrey A.Hirt, Bartley R.Danielsen “ Foundations of Financial Management ” 13 th edition 2008 Keith Cuthbertson, Dirk Nitzsche “ Investments ” 2 th edition 2008 Robert Parrino, David S.Kidwell “ Fundamentals of Corporate Finance ” 2008 John Tennent “ Guide to Financial Management ” 2008 Zvi Bodie, Alex Kane, Alan J.Marcus, Alan J.Marcus, Alex Kane “ Essentials of Investments ” 2005 Eugene F.Brigham, Joel F.Houston “ Fundamentals of Financial Management ” 6 th edition 2008
Editor's Notes
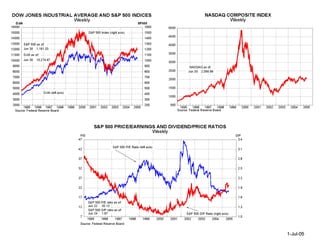
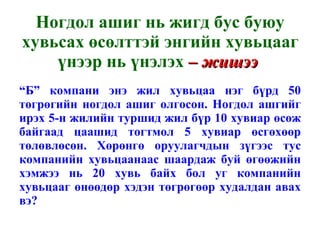
#102 Bearish Engulfing Sell Signal Three methodologies for selling using the Bearish Engulfing Pattern are listed below in order of most aggressive to most conservative: Sell at the close of Day 2. An even stronger indication to sell is given when there is a substantial increase in volume that accompanies the large move downward in price (see: Volume ). Sell on the day after the Bearish Engulfing Pattern occurs; by waiting until the next day to sell, a trader is making sure that the bearish reversal pattern is for real and was not just a one day occurance. In the chart above of Verizon, a trader would probably entered on the day after the Bearish Engulfing Pattern because the selling continued. Usually trader's wait for other signals, such as a price break below the upward support line (see: Support & Resistance ), before entering a sell order. However, in the case of Verizon above, the Bearish Engulfing Pattern occured at the same time as the trendline break below support.


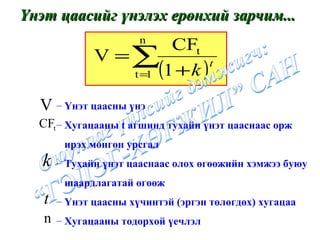


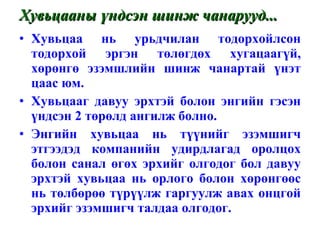


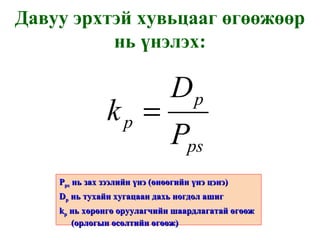


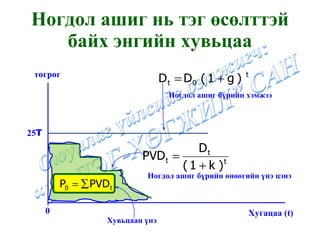

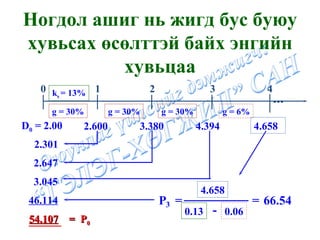

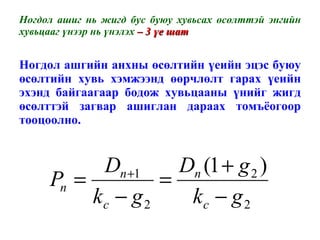

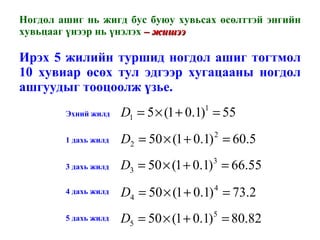


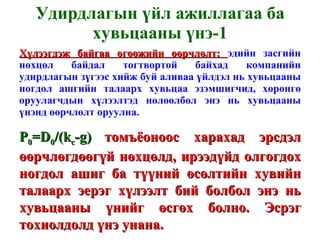


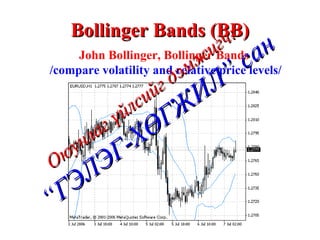
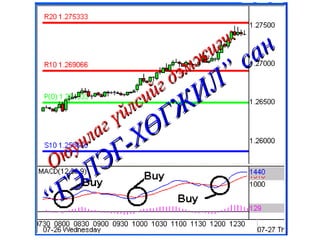
![Bollinger Bands (BB) ML = SUM [CLOSE, N]/N TL = ML + (D*StdDev) BL = ML — (D*StdDev) Оюунлаг үйлсийг дэмжигч: “ГЭЛЭГ-ХӨГЖИЛ” сан](https://image.slidesharecdn.com/presentation1-110225000420-phpapp01/85/slide-180-320.jpg)