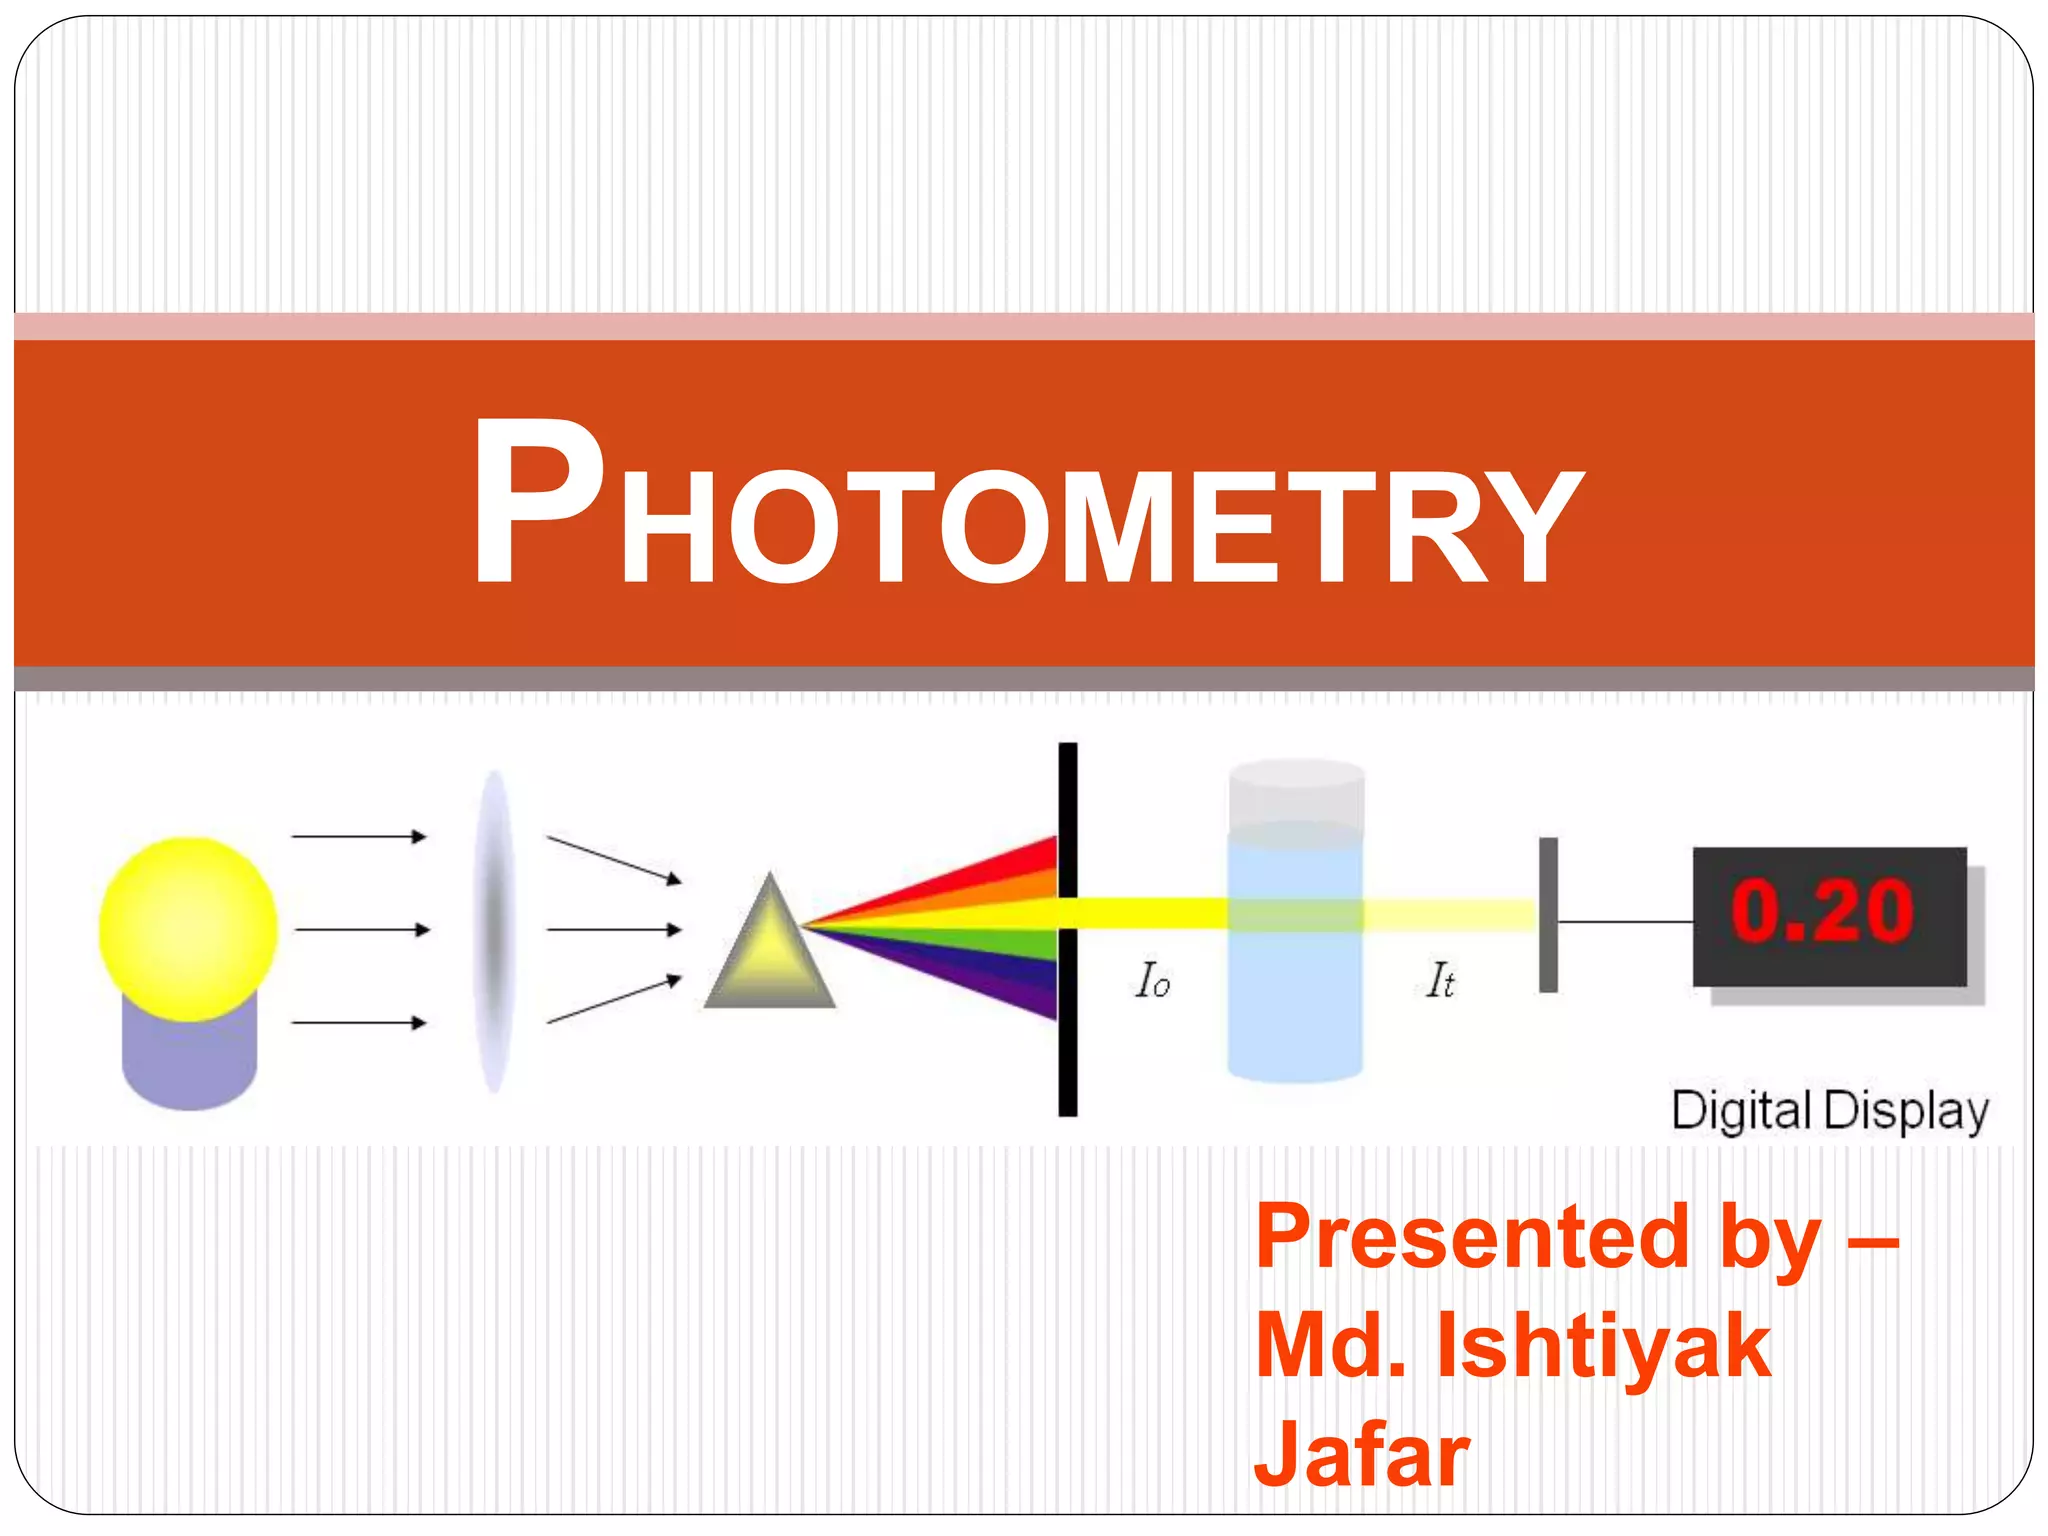
Photometry is the science of measuring light in terms of its brightness as perceived by the human eye. It only considers visible light since the eye can only see in this range. Spectrophotometry measures light intensity across the electromagnetic spectrum using instruments. Absorption spectrophotometry measures the absorption of light as it passes through a sample, relating absorption to characteristics like concentration through Beer's and Lambert's laws. A spectrophotometer directs light from a source through a sample and measures the intensity of transmitted light using a detector to analyze samples and identify substances.
Spectroscopy using spectrophotometers of different types like: U.V, Mass Spectrophotometer, absorption , Emission, Nuclear magnetic resonance and X-rays Spectrophotometer
This document provides an overview of UV-visible spectroscopy and chromophores. It discusses electromagnetic radiation and its wave and particle properties. UV-visible spectroscopy utilizes absorption of radiation in the ultraviolet and visible wavelength ranges by chromophores in molecules. Chromophores are functional groups that absorb specific wavelengths, while auxochromes modify this absorption. Beer's law describes the relationship between absorption and concentration. Instrumentation for UV-visible spectroscopy includes sources of radiation, monochromators, sample cells, and detectors. Applications involve quantitative analysis, structure elucidation, and more.
This document provides an overview of infrared spectroscopy (IR) and its applications. It discusses the IR regions, the principles of IR which involve molecular vibrations and interactions with IR radiation. It describes fundamental vibrations such as stretching and bending, and instrumentation used including sources, sample handling, and detectors. Fourier transform IR is highlighted as a preferred method. Applications include detection of impurities, protein quantification, forensic analysis, and studying reaction progress and molecular structure identification.
This document discusses spectrophotometry and the Nanodrop instrument. Spectrophotometry involves measuring how much light is absorbed by a sample at specific wavelengths. The Nanodrop is a spectrophotometer that can measure extremely small sample volumes down to 0.5 microliters. It uses principles like Beer's law to calculate concentrations of nucleic acids, proteins, and other molecules from absorbance readings. Key applications of the Nanodrop include quantifying DNA, RNA, and proteins as well as measuring purity based on absorbance ratios.
This document provides an overview of UV-Visible spectroscopy. It discusses the basic principles including electromagnetic radiation, spectroscopy, absorption of UV-Visible light, and Beer-Lambert's law. It describes the instrumentation of UV-Visible spectroscopy including light sources, wavelength selectors, sample compartments, detectors and basic components. It also discusses electronic transitions, shifts in absorption, and applications of UV-Visible spectroscopy in qualitative and quantitative analysis.
UV - Visible Spectroscopy detailed information is included .The Spectroscopy study provide the information and the absorbance as well the concentration of the drugs is studied.
This document provides an overview of UV-Visible spectroscopy. It discusses the basic principles, components, and types of UV-Visible spectrophotometers. The key components include a light source, monochromator, cuvettes to hold samples, and detectors. It also describes the principles of absorption spectroscopy and how double-beam spectrophotometers work by splitting the light source into reference and sample beams to improve accuracy. UV-Visible spectroscopy is a common technique for quantitative analysis that measures how light is absorbed by molecules at different wavelengths.
spectroscopy, classification of spectroscopy, history, UV-VIS spectrophotometer, principle, beer lambert law instrumentation, detector, single beam, double beam in time, double beam in space, application, merits, and demerits
The document discusses electromagnetic radiation and ultraviolet spectroscopy, explaining that UV spectroscopy involves measuring the absorption of UV or visible light, which provides information about electronic transitions in molecules. It describes the components of a UV spectrometer and the principles of absorption spectroscopy. Various applications of UV spectroscopy in forensic science are also outlined, such as identifying illegal substances or determining the number of inks in questioned documents.
The document discusses electromagnetic radiation and ultraviolet spectroscopy, explaining that UV spectroscopy involves measuring the absorption of UV or visible light, which produces electronic transitions in molecules. It describes the components of a UV spectrometer and the principles of absorption spectroscopy. UV spectroscopy has various applications in forensic science such as identifying questioned documents and detecting controlled substances.
A spectrophotometer is an instrument containing a monochromator, a device which produces a light beam containing wavelengths in a narrow band around a selected wavelength, and a means of measuring the ratio of that beam's intensity as it enters and leaves a cuvette 99 This describes a single-beam photometer.
Spectrophotometer instrumentation & working Sabahat Ali
Spectrophotometric analysis is a technique to measure the concentration of solute solution by measuring the amount of light absorbed by solution.
Absorption can be calculated in terms of transmittance by using Beer's Lambert law.
performance and specifications of spectrophotometerPulak Das
Spectrophotometers measure the intensity of light at specific wavelengths to determine the concentration of compounds in solution. They consist of a light source, wavelength selector like a monochromator, cuvette to hold samples, photodetector like a photomultiplier tube, readout device, and data system. For accurate results, spectrophotometers must meet various performance specifications including wavelength accuracy checked using holmium oxide or didymium filters, low stray light verified with cutoff filters, linear detector response across concentration ranges, and photometric accuracy assessed using neutral density filters.
details about uv-visible spectroscopy. intoduction to uv-visible spectroscopy with principle,
instrumentation, application, beers lamberts law , detectors. helps to know details about uv-visible spectroscopy. complete notes of uv-visible spectroscopy.
Unlike a spectrometer (which is any instrument that can measure the
properties of light over a range of wavelengths), a spectrophotometer
measures only the intensity of light as a function of its wavelength.
Here are the answers to your questions:
1. To determine molar absorptivity (ε) and specific absorbtivity (A), measure the absorbance (A) of solutions with known concentrations (c) and pathlengths (l). Molar absorptivity is calculated as ε = A/cl. Specific absorbtivity is calculated as A = εcl.
2. The grating in a spectrophotometer functions to separate polychromatic light into its component wavelengths (monochromatic light). It does this via the principle of diffraction - the grating grooves act like multiple slits that diffract light at different angles depending on the wavelength.
3. The main parts of a mon
This document discusses various spectroscopic techniques used in chemical analysis. It describes how spectroscopy involves the interaction of electromagnetic radiation with matter and the information that can be obtained from these interactions. Specifically, it outlines different types of spectroscopy including absorption, emission, infrared, Raman, and others. It also provides details on instrumentation such as spectrophotometers and their applications in quantitative analysis, qualitative analysis, enzyme assays, and molecular weight determination in pharmaceutical analysis.
The document discusses the components and working of a UV-Visible spectrophotometer. It describes the key components as the light source, monochromator, sample holder, detector and amplifier. It then explains the working of single beam and double beam spectrophotometers, noting that double beam compensates for changes in lamp intensity. It also discusses various types of detectors used including photovoltaic cells, phototubes and photomultiplier tubes.
Spectroscopy is a method which measures the interaction of matter with electromagnetic radiation. it reveals different properties of substances such as absorbance, composition and interaction with other matter
Spectrophotometers use light sources, monochromators, and detectors to measure the absorption of specific wavelengths of light by a sample. They have applications in photometry, colorimetry, and spectrophotometry to quantitatively analyze compounds. A spectrophotometer passes light through a sample and measures the intensity of transmitted light, allowing concentration measurements using the Beer-Lambert law. Common components include sources like deuterium lamps, monochromators to select wavelengths, and detectors to convert light to electrical signals.
1. A spectrophotometer measures the light that passes through a liquid sample and gives readings in percent transmittance and absorbance.
2. As concentration of an absorbing substance increases, less light is transmitted through the sample according to Beer-Lambert's law.
3. Key aspects of a spectrophotometer include the light source, monochromator, sample cells, detector, and associated electronics for amplification and readout. Spectrophotometers are used for a variety of applications including quantitative analysis and molecular structure determination.
UV spectroscopy can be used to analyze organic compounds. It works by measuring the absorption of UV or visible light. Double beam UV spectroscopy has advantages over single beam as it automatically corrects for fluctuations in light source intensity and detector response. UV spectroscopy can be used to detect impurities, characterize functional groups, and determine concentrations through the Beer-Lambert law. It provides structural information about organic compounds.
Flame photometry is a technique that uses the characteristic emissions of light from elements introduced into a flame to determine the concentration of certain metal ions like sodium, potassium, calcium, and lithium. It works based on the principle that elements emit light at specific wavelengths when excited in a flame. The flame photometer instrument consists of a burner to generate the flame, a nebulizer to introduce the sample, an optical system to transmit and focus the light, filters to isolate wavelengths, and a photodetector to measure light intensity and relate it to concentration. Flame photometry can be used for both qualitative and quantitative analysis of metals in samples like soils, foods, beverages, and bodily fluids.
UV-Visible spectrophotometry involves measuring light intensity as a function of wavelength. A spectrophotometer directs light through a sample and measures the transmitted light intensities using a charged coupled device detector. It displays the results as a graph of absorbance versus wavelength. UV-Vis spectroscopy can be used to determine concentrations, detect impurities, elucidate organic structures, and study chemical kinetics by observing changes in absorbance.
Remote Sensing and Computational, Evolutionary, Supercomputing, and Intellige...University of Maribor
Slides from talk:
Aleš Zamuda: Remote Sensing and Computational, Evolutionary, Supercomputing, and Intelligent Systems.
11th International Conference on Electrical, Electronics and Computer Engineering (IcETRAN), Niš, 3-6 June 2024
Inter-Society Networking Panel GRSS/MTT-S/CIS Panel Session: Promoting Connection and Cooperation
https://www.etran.rs/2024/en/home-english/
The binding of cosmological structures by massless topological defectsSérgio Sacani
Assuming spherical symmetry and weak field, it is shown that if one solves the Poisson equation or the Einstein field
equations sourced by a topological defect, i.e. a singularity of a very specific form, the result is a localized gravitational
field capable of driving flat rotation (i.e. Keplerian circular orbits at a constant speed for all radii) of test masses on a thin
spherical shell without any underlying mass. Moreover, a large-scale structure which exploits this solution by assembling
concentrically a number of such topological defects can establish a flat stellar or galactic rotation curve, and can also deflect
light in the same manner as an equipotential (isothermal) sphere. Thus, the need for dark matter or modified gravity theory is
mitigated, at least in part.
Immersive Learning That Works: Research Grounding and Paths ForwardLeonel Morgado
We will metaverse into the essence of immersive learning, into its three dimensions and conceptual models. This approach encompasses elements from teaching methodologies to social involvement, through organizational concerns and technologies. Challenging the perception of learning as knowledge transfer, we introduce a 'Uses, Practices & Strategies' model operationalized by the 'Immersive Learning Brain' and ‘Immersion Cube’ frameworks. This approach offers a comprehensive guide through the intricacies of immersive educational experiences and spotlighting research frontiers, along the immersion dimensions of system, narrative, and agency. Our discourse extends to stakeholders beyond the academic sphere, addressing the interests of technologists, instructional designers, and policymakers. We span various contexts, from formal education to organizational transformation to the new horizon of an AI-pervasive society. This keynote aims to unite the iLRN community in a collaborative journey towards a future where immersive learning research and practice coalesce, paving the way for innovative educational research and practice landscapes.
Current Ms word generated power point presentation covers major details about the micronuclei test. It's significance and assays to conduct it. It is used to detect the micronuclei formation inside the cells of nearly every multicellular organism. It's formation takes place during chromosomal sepration at metaphase.
Phenomics assisted breeding in crop improvementIshaGoswami9
As the population is increasing and will reach about 9 billion upto 2050. Also due to climate change, it is difficult to meet the food requirement of such a large population. Facing the challenges presented by resource shortages, climate
change, and increasing global population, crop yield and quality need to be improved in a sustainable way over the coming decades. Genetic improvement by breeding is the best way to increase crop productivity. With the rapid progression of functional
genomics, an increasing number of crop genomes have been sequenced and dozens of genes influencing key agronomic traits have been identified. However, current genome sequence information has not been adequately exploited for understanding
the complex characteristics of multiple gene, owing to a lack of crop phenotypic data. Efficient, automatic, and accurate technologies and platforms that can capture phenotypic data that can
be linked to genomics information for crop improvement at all growth stages have become as important as genotyping. Thus,
high-throughput phenotyping has become the major bottleneck restricting crop breeding. Plant phenomics has been defined as the high-throughput, accurate acquisition and analysis of multi-dimensional phenotypes
during crop growing stages at the organism level, including the cell, tissue, organ, individual plant, plot, and field levels. With the rapid development of novel sensors, imaging technology,
and analysis methods, numerous infrastructure platforms have been developed for phenotyping.
ESA/ACT Science Coffee: Diego Blas - Gravitational wave detection with orbita...Advanced-Concepts-Team
Presentation in the Science Coffee of the Advanced Concepts Team of the European Space Agency on the 07.06.2024.
Speaker: Diego Blas (IFAE/ICREA)
Title: Gravitational wave detection with orbital motion of Moon and artificial
Abstract:
In this talk I will describe some recent ideas to find gravitational waves from supermassive black holes or of primordial origin by studying their secular effect on the orbital motion of the Moon or satellites that are laser ranged.
ESR spectroscopy in liquid food and beverages.pptxPRIYANKA PATEL
With increasing population, people need to rely on packaged food stuffs. Packaging of food materials requires the preservation of food. There are various methods for the treatment of food to preserve them and irradiation treatment of food is one of them. It is the most common and the most harmless method for the food preservation as it does not alter the necessary micronutrients of food materials. Although irradiated food doesn’t cause any harm to the human health but still the quality assessment of food is required to provide consumers with necessary information about the food. ESR spectroscopy is the most sophisticated way to investigate the quality of the food and the free radicals induced during the processing of the food. ESR spin trapping technique is useful for the detection of highly unstable radicals in the food. The antioxidant capability of liquid food and beverages in mainly performed by spin trapping technique.
hematic appreciation test is a psychological assessment tool used to measure an individual's appreciation and understanding of specific themes or topics. This test helps to evaluate an individual's ability to connect different ideas and concepts within a given theme, as well as their overall comprehension and interpretation skills. The results of the test can provide valuable insights into an individual's cognitive abilities, creativity, and critical thinking skills
EWOCS-I: The catalog of X-ray sources in Westerlund 1 from the Extended Weste...Sérgio Sacani
Context. With a mass exceeding several 104 M⊙ and a rich and dense population of massive stars, supermassive young star clusters
represent the most massive star-forming environment that is dominated by the feedback from massive stars and gravitational interactions
among stars.
Aims. In this paper we present the Extended Westerlund 1 and 2 Open Clusters Survey (EWOCS) project, which aims to investigate
the influence of the starburst environment on the formation of stars and planets, and on the evolution of both low and high mass stars.
The primary targets of this project are Westerlund 1 and 2, the closest supermassive star clusters to the Sun.
Methods. The project is based primarily on recent observations conducted with the Chandra and JWST observatories. Specifically,
the Chandra survey of Westerlund 1 consists of 36 new ACIS-I observations, nearly co-pointed, for a total exposure time of 1 Msec.
Additionally, we included 8 archival Chandra/ACIS-S observations. This paper presents the resulting catalog of X-ray sources within
and around Westerlund 1. Sources were detected by combining various existing methods, and photon extraction and source validation
were carried out using the ACIS-Extract software.
Results. The EWOCS X-ray catalog comprises 5963 validated sources out of the 9420 initially provided to ACIS-Extract, reaching a
photon flux threshold of approximately 2 × 10⁻⁸ photons cm−2
s
−1
. The X-ray sources exhibit a highly concentrated spatial distribution,
with 1075 sources located within the central 1 arcmin. We have successfully detected X-ray emissions from 126 out of the 166 known
massive stars of the cluster, and we have collected over 71 000 photons from the magnetar CXO J164710.20-455217.
Or: Beyond linear.
Abstract: Equivariant neural networks are neural networks that incorporate symmetries. The nonlinear activation functions in these networks result in interesting nonlinear equivariant maps between simple representations, and motivate the key player of this talk: piecewise linear representation theory.
Disclaimer: No one is perfect, so please mind that there might be mistakes and typos.
dtubbenhauer@gmail.com
Corrected slides: dtubbenhauer.com/talks.html
3. Light is the Electromagnetic radiation (EMR),
that is visible to human eye.
composed of particles called photons
ranges from 380 or 400 to about 760 or 780 nm.
In Physics, the term light sometimes refers to
electromagnetic radiation of any type, whether
visible or not.
5. Energy associated with a given segment of the
spectrum is related to frequency and
wavelengths.
6. Photometry,
Greek photo- ("light") and - metry ("measure")
Science of measurement of light in terms of its
perceived brightness to the human eye.
In photometry, the standard is the human eye.
Since the human eye is only sensitive to visible
light, photometry only falls in that range.
When intensity at each wavelength on the
whole range of electromagnetic spectrum is
measured, it is called Spectrophotometry.
7. Spectrophotometry
Actually its a science that deals the use of
measurement of interaction between Matter and
electromagnetic radiations to quantize the
concentration of an analyte or for qualitative
purpose.
Matter can be atoms, molecules or ions.
The nature of interaction between the radiation
and matter may include –
Absorption
Emission or
Scattering
8. Spectrophotometry
Three principal branches of Spectrophotometry
1. Absorption Spectrophotometry
2. Emission Spectrophotometry and
3. Scattering Spectrophotometry.
9. Absorption Spectrophotometry
deals the measurement of radiation absorbed at
various wavelengths.
When a beam of EMR passes through the
sample, some of the radiation’s intensity is
attenuated (decrease in number of photons)
This process of attenuation is called absorption.
10. Major types of Absorption
Spectrophotometry
EMR Spectrophotometry Type
γ γ- ray Absorption Spectrophotometry
X - ray X – ray Absorption Spectrophotometry
UV/Visual UV/Visual Absorption Spectrophotometry
IR IR Absorption Spectrophotometry
Microwave Microwave Absorption Spectrophotometry
Radio Wave NMR Spectrophotometry
11. Emission Spectrophotometry
Deals the measurement of Emitted Radiation
Atoms or molecules that are excited to high energy
levels can decay to lower levels by emitting energy
as radiations.
These emitted radiations are then passed through a
prism and measured directly.
High temperature induced emission is called Atomic
emission (emission spectroscopy)
EMR induced emission is called Atomic
Fluorescence (Fluorescence Spectroscopy).
Used in Flame Spectrophotometry and
fluorometry
12. Scattering Spectrophotometry
Measures certain physical properties by
measuring the amount of light that a substance
scatters at certain wavelengths.
Most useful application is Raman
Spectrophotometry.
13. Principles of Absorption
Spectrophotometry
When radiation falls on homogenous medium, a
portion of incident light is reflected, a portion is
absorbed and remainder is transmitted.
The two laws governing the absorbance of the
radiation are known as Beer’s law and
Lambert’s law.
Incident Light (Io)
Transmitted
Light (I)
14. Beer’s Law
Intensity of transmitted monochromatic light
decreases exponentially as the concentration of the
absorbing substance increases.
A α C
15. Lambert’s Law
Intensity of transmitted monochromatic light
decreases exponentially as the thickness (path
length) of the absorbing material increases.
A α l
16. Mathematical expression of
Beer – Lamberts Law
A = log = εcl
T =
%T = × 100 or %T = T × 100 or T =
A = log10 or –log10 T or – log10
A = – log10 %T + log10100 or – log10 %T +
log10102
A = 2 – log10 %T
Io
I
I
Io
I
Io
%T
100
1
T
%T
100
Where,
17. Limitations
Very elevated concentrations cann’t be measured
If Incident radiation is not monochromatic
If solvent absorption is not significant compared
to solute absorbance.
If the sides of the cell are not parallel
If Radiant energy is transmitted by other
mechanism (stray light)
0.15
0.25
18. Spectrophotometer
An instrument used to measure the absorbance
by measuring the amount of transmitted light of a
specific wavelength passes through a sample is
termed
Spectrophotometer
20. 1. Light Source
1. Tungsten filament lamp – continuous spectrum
2. Tungsten iodide lamp – Visible and UV
3. Hydrogen and Deuterium lamps – Continuous UV
4. Mercury vapour lamps – Discontinuous/line
spectrum
5. LEDs – two types of semi conductors
2. Entrance slit
• Focuses light on grating/prism, where it can be
dispersed with minimum stray lights
0
21. 3. Spectral isolator
For the isolation of required wavelength/range of
wavelengths
Two types :
a) Filters
b) Monochromators
A. Filters
Consists of only a material that selectively
transmits the desired wavelength and absorbs
the rest.
2 types –
Absorption filter and
Interference filter Interference
filter
MgF
2
22. B. Monochromators
A Grating/Prism disperses radiation energy from the
source lamp into a spectrum from which desired
wavelength is isolated by mechanical slits.
Prism – non linear dispersion
Grating – Linear dispersion
a. Prisms :
Made up of fused silica
Give only one order of emerging spectrum thus provide
higher optical efficiency.
Wavelength of monochromatic light emerging from exit
slit can be change by rotating the prism.
23. b. Grating :
Consists of highly polished
reflecting surfaces with many
equally placed parallel grooves with
sharp corners.
Types –
Transmittance grating (made up of
glass)
Reflection grating (made up of
aluminium)
0
4. Exit slit :
Determine the band width of light that will be selected
from dispersed spectrum
24. 5. Cuvettes/Cell
Receptacle for sample
Optical property
depends on the Composition.
Calibrated to path length 1 cm
2 types : Silicate and Quartz or fused silica cell
6. Photodetectors
A device that converts light into an electric signal that is
proportional to the no. Of photons striking its
photosensitive surface.
0
0.25
25. 3 types :
a) Photomultiplier tube – highly sensitive
b) Photodiodes – high signal/noise
c) Charged couple device – constant response to
wavelengths and fast response time.
a. Photomultiplier tubes :
An electron tube that is capable of significantly amplifying
a current.
Extremely fast response time
Slow to fatigue
b. Photodiodes :
Semiconductors that change their charged voltage upon
being struck by light
Change is converted to current and measured
Higher response time
Unlike PMT, it can be used for high intensity
26. C. Charged couple device :
Solid phase devices that are made up of small silicon
cells.
Electron released is captured and quantified
7. Read out devices
Elecric energy from the detector is displayed on a meter
or display system
0
0.25
27. Classes of Spectrophotometers
Single beam and double beam are the two major classes of
spectrophotometer.
Single Beam: In this type, all the light passes through the
sample .To measure the intensity of the incident light the
sample must be removed so that all the light can pass through.
This type of spectrometer is usually less expensive and less
complicated.
Double Beam: In this type, before reaches the sample the
light source is split into two separate beams. From these one
passes through the sample and second one is used for
reference. This gives the advantageous because at the same
time the reference reading and sample reading can take place.
29. Advantage of Double beam
Spectrophotometer
Compensate for variation in the source
intensity
Compensate for drift in the detector and
amplifier
Compensate for variation in intensity as
function of wavelength
30. COLORIMETER SPECTROPHOTOMET
ER
Light measures only in
visible region
UV, visible, IR, X-rays
Filters Prisms/gratings
Can choose only a
bandwidth of
wavelength
Can choose exact
wavelength
Only coloured solutions
measured
Colourless solutions
can also be measured
Absorbance – less Absorbance – More
Comparison
32. Principle
Alkali metals when heated to high temperature,
energy is absorbed by orbital electron.
Electron excited and move to a higher state.
Being unstable there, return back to ground state
by reemitting the absorbed energy as radiation of
specific wavelength
Isolated by optical filter
Photo detector placed behind the filter converts it
in to an electric current which is measured
33. The wavelength of the atomic spectral line gives
the identity of the element.
The intensity of the emitted light is proportional
to the number of atoms of the element
light intensity α no. of atoms α conc. of
substance
Na+ emits 589 nm YELLOW
K+ 766 nm VIOLET
Ca 622 nm Orange
Li 670 nm RED
Various metals emit a characteristic colour of light when
heated