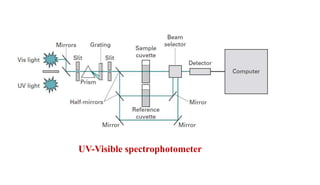
SlideShare a Scribd company logo
Ultraviolet and visible light
Spectroscopy
(UV-Visible Spectroscopy)
Presented by
Mr. Kamble Sainath Hanmant
Assistant Professor
Department of Microbiology
D.B.F. Dayanand College of Arts and Science, Solapur
Spectroscopy is the a technique that measures absorption and transmission of
light waves by chemical compounds and biological molecules like DNA and
proteins.
Light is an electromagnetic radiation having different wavelength. Based on
wavelength light is divided into three types –
1) Ultraviolet light (10 nm to 400 nm)
2) Visible light (400 nm to 700 nm)
3) Infrared light (700 to 1 mm)
Electromagnetic radiation before 180 nm and after 5000 nm not considered as
light.
The UV light is divided in three types based on wavelength as
1) UV-C (100-280 nm) 2) UV-B (280-315 nm) 3) UV-A (315-400 nm)
Principle
When the light waves pass through a chemical compounds , then electrons from an
atoms of these compounds moves from lower energy state to higher energy state or
Vice-versa and absorbe or emit light waves specific wavelength.
Molecular in the chemical compounds which interaction with electromagnetic
radiation and absorbe or emit specific light wavelength are called as chromophores.
In UV-Visible spectroscopy technique based absorption or Transmission of
Ultraviolet light and visible light wavelength by chemical compounds. The instument
In known as UV-Visible spectrophotometer.
 For UV-Visible spectroscopy liquid samples of are used by dissolving chemical
compounds in Water or suitable Solvents.
Beer–Lambert law
Measurement of light absorption or transmission in UV-Visible spectroscopy is
based on Beer–Lambert law.
By this law the chance photon to be absorbed by matter is given by an
extinction coefficient which itself is dependent on the wavelength of the photon.
 If light with the intensity I0 passes through a sample with appropriate
transparency and the path length (thickness) d, the intensity I drops along the
pathway in an exponential manner.
If light with the intensity I0 passes through a sample with appropriate
transparency and the path length (thickness) d, the intensity I drops along the
pathway in an exponential manner.
The characteristic absorption parameter for the sample is the extinction
coefficient ‘α’ yielding the correlation as equations given below.
I = I0 ε α d
T= I/I0
α = Extinction coefficient
I0 = Initial intensity of Light
I = Intensity of light after absorption or transmission
T = Transmission.
Biochemical samples usually comprise aqueous solutions, where
the substance of interest is present at a molar concentration ‘c’ .
Algebraic transformation of the exponential correlation into an
expression based on the decadic logarithm yields the Beer–Lambert
law as an equation below –
where d = 1cm, c = 1 mol dm-3, and ε = 1 dm-3 mol-1 cm-1
ε = Molar absorption coefficient
α = Molar extinction coefficient (α = 2.303 x c x ε).
A = Absorbance of the sample
Instrumentation and Methodology
1) Light Source
In the UV-Visible spectroscopy the source of UV-light is Hydrogen-Deuterium
lamps which covers the wavelength of 180 nm to 400 nm.
While the source of visible light is Tungsten filament lamps which covers the
wavelength of 400 nm to 700 nm.
 The light from these two lamps then fall on to mirror and then reflected and
pass through a slit as beam which enters in to prism.
UV-Visible spectrophotometer
2) Monochromator
Since the emitted light consists of many different wavelengths, a
monochromator is used to split light in different wavelength and select specific
wavelength.
Monochromators generally is composed of prisms and slits. When light from
source pass through prism it separates into various wavelengh
A rotating metal grid of high precision called grating is also used as
monochromator in some spectrophotometers.
Specific light wavelength for analysis then selected for by the slits after prism.
Samples are typically placed in a test like transparent cell known as a cuvette
made up of Quartz or Silica.
This cuvette filled with liquid sample and placed is holder called Sample cell.
Another cuvette filled with reference solution or Standard which contains only
solvent without sample is placed in holder called reference cell.
A spectrophotometer can be either single beam or double beam. In a single beam
all of the light passes through only sample cell. It has no reference cell.
In a double-beam instrument, the light is split into two beams by mirros and then
one beam pass through the Sample cell and other beam reference cell.
3) Sample and reference cells
4) Detector
Light waves of specific wavelength emitted or transmitted from sample cell and
reference then fall on the mirrors and pass through beam selectors towords
detectors.

Generally two photocells are used as detector which receives beams from
sample and reference cell.
The intensity of the radiation from the reference cell is stronger than the beam
of sample cell. This results in the generation of pulsating or alternating currents in
the photocells.
5) Amplifier
The alternating current generated in the photocells is transferred to the
amplifier.
Generally current generated in the photocells is of very low intensity, the
main purpose of amplifier is to amplify the signals many times so we can get
clear and recordable signals.
6) Recording devices
Most of the time amplifier is coupled to a pen recorder which is connected to
the computer.
Computer stores all the data generated and produces the spectrum of the
desired compound as peak graph .
Procedure
1) The sample solution is filled in cuvette and placed sample cell holder
2) The standard reference solution filled in cuvette and placed in reference cell
holder.
3) Then a UV-Visible wavelength scan is done from 180 nm to 1100 nm by
using computer software .
4) After scan spectra is generated from which specific wavelength which is
absorbed maximum by sample
observed which is known as absorption maxima.
5) For finding unknown sample concentration various sample concentration
like (1 mg/ml to 5mg/ml)
taken in cuvette and absorbance is observed at absorption maxima.
6) Then graph is platted as Sample concentration on X - axis and Absorbance
at Y axis.
7) The absorbance of sample with unknown conc. is measured and conc. is
obtained by standard graph.
UV-Visible spectroscopy analysis of bacterial melanin
It is used for detection of impurities from various chemicals, drugs, biological
meolecules in chemicals and pharma industries.
It is usedin the structure elucidation of organic molecules, such as in detecting
the presence or absence of unsaturation, the presence of hetero atoms.
It can be used for the quantitative estimation of compounds that absorb UV
radiation like DNA, RNA proteins and carbohydrates in industries and in
research filed.
It can be used to study enzyme activity by estimating product and substrate
concentrations.
Applications
References
25 UV-Visible.pptx

More Related Content

Similar to 25 UV-Visible.pptx

Spectrophotometer.pptx
Spectrophotometer.pptxSpectrophotometer.pptx
Spectrophotometer.pptx
Deepa B
 
Spectrophotometry
Spectrophotometry Spectrophotometry
Spectrophotometry
KHITISHNAIK
 
UV ray spectrophotometer
UV ray spectrophotometerUV ray spectrophotometer
UV ray spectrophotometer
Goa App
 
UV Spectroscopy
UV Spectroscopy UV Spectroscopy
UV Spectroscopy
MdBabulAktar3
 
UV rays
UV rays UV rays
UV rays
Goa App
 
Spectrophotometry In Biology
Spectrophotometry In BiologySpectrophotometry In Biology
Spectrophotometry In Biology
Syed Muhammad Khan
 
Visible Spectrophotometry and Colorimetry.pptx
Visible Spectrophotometry and Colorimetry.pptxVisible Spectrophotometry and Colorimetry.pptx
Visible Spectrophotometry and Colorimetry.pptx
NeetuSoni21
 
Spectrophotometer instrumentation & working
Spectrophotometer instrumentation & working Spectrophotometer instrumentation & working
Spectrophotometer instrumentation & working
Sabahat Ali
 
UV & VISIBLE SPECTROSCOPY ppt ...1.pptx
UV & VISIBLE SPECTROSCOPY ppt  ...1.pptxUV & VISIBLE SPECTROSCOPY ppt  ...1.pptx
UV & VISIBLE SPECTROSCOPY ppt ...1.pptx
Abhishek Borkar15
 
Uv spectroscopy
Uv spectroscopyUv spectroscopy
Uv spectroscopy
revathyreva6
 
spectrophotometer 2.pdf
spectrophotometer 2.pdfspectrophotometer 2.pdf
spectrophotometer 2.pdf
AbdalrahmanNasser2
 
U.V Spectroscopy
U.V SpectroscopyU.V Spectroscopy
U.V Spectroscopy
Shagufta Farooqui
 
Spectrophotometry
SpectrophotometrySpectrophotometry
Spectrophotometry
Nandita Kumari
 
Biomolecular andcellularresearchdevices fin
Biomolecular andcellularresearchdevices finBiomolecular andcellularresearchdevices fin
Biomolecular andcellularresearchdevices fin
MUBOSScz
 
Uv/visible spectroscopy
Uv/visible spectroscopyUv/visible spectroscopy
Uv/visible spectroscopy
SavitaBhatt2
 
Uv
UvUv
Chapter 8
Chapter 8Chapter 8
Chapter 8
ECRD IN
 
Spectrophotometer Meter
Spectrophotometer MeterSpectrophotometer Meter
Spectrophotometer Meter
ECRD IN
 
Spectrophotometer meter
Spectrophotometer meterSpectrophotometer meter
Spectrophotometer meter
ECRD2015
 
Spectroscpy methods.pptx
Spectroscpy methods.pptxSpectroscpy methods.pptx
Spectroscpy methods.pptx
SonaliGadge4
 

Similar to 25 UV-Visible.pptx (20)

Spectrophotometer.pptx
Spectrophotometer.pptxSpectrophotometer.pptx
Spectrophotometer.pptx
 
Spectrophotometry
Spectrophotometry Spectrophotometry
Spectrophotometry
 
UV ray spectrophotometer
UV ray spectrophotometerUV ray spectrophotometer
UV ray spectrophotometer
 
UV Spectroscopy
UV Spectroscopy UV Spectroscopy
UV Spectroscopy
 
UV rays
UV rays UV rays
UV rays
 
Spectrophotometry In Biology
Spectrophotometry In BiologySpectrophotometry In Biology
Spectrophotometry In Biology
 
Visible Spectrophotometry and Colorimetry.pptx
Visible Spectrophotometry and Colorimetry.pptxVisible Spectrophotometry and Colorimetry.pptx
Visible Spectrophotometry and Colorimetry.pptx
 
Spectrophotometer instrumentation & working
Spectrophotometer instrumentation & working Spectrophotometer instrumentation & working
Spectrophotometer instrumentation & working
 
UV & VISIBLE SPECTROSCOPY ppt ...1.pptx
UV & VISIBLE SPECTROSCOPY ppt  ...1.pptxUV & VISIBLE SPECTROSCOPY ppt  ...1.pptx
UV & VISIBLE SPECTROSCOPY ppt ...1.pptx
 
Uv spectroscopy
Uv spectroscopyUv spectroscopy
Uv spectroscopy
 
spectrophotometer 2.pdf
spectrophotometer 2.pdfspectrophotometer 2.pdf
spectrophotometer 2.pdf
 
U.V Spectroscopy
U.V SpectroscopyU.V Spectroscopy
U.V Spectroscopy
 
Spectrophotometry
SpectrophotometrySpectrophotometry
Spectrophotometry
 
Biomolecular andcellularresearchdevices fin
Biomolecular andcellularresearchdevices finBiomolecular andcellularresearchdevices fin
Biomolecular andcellularresearchdevices fin
 
Uv/visible spectroscopy
Uv/visible spectroscopyUv/visible spectroscopy
Uv/visible spectroscopy
 
Uv
UvUv
Uv
 
Chapter 8
Chapter 8Chapter 8
Chapter 8
 
Spectrophotometer Meter
Spectrophotometer MeterSpectrophotometer Meter
Spectrophotometer Meter
 
Spectrophotometer meter
Spectrophotometer meterSpectrophotometer meter
Spectrophotometer meter
 
Spectroscpy methods.pptx
Spectroscpy methods.pptxSpectroscpy methods.pptx
Spectroscpy methods.pptx
 

Recently uploaded

คำศัพท์ คำพื้นฐานการอ่าน ภาษาอังกฤษ ระดับชั้น ม.1
คำศัพท์ คำพื้นฐานการอ่าน ภาษาอังกฤษ ระดับชั้น ม.1คำศัพท์ คำพื้นฐานการอ่าน ภาษาอังกฤษ ระดับชั้น ม.1
คำศัพท์ คำพื้นฐานการอ่าน ภาษาอังกฤษ ระดับชั้น ม.1
สมใจ จันสุกสี
 
LAND USE LAND COVER AND NDVI OF MIRZAPUR DISTRICT, UP
LAND USE LAND COVER AND NDVI OF MIRZAPUR DISTRICT, UPLAND USE LAND COVER AND NDVI OF MIRZAPUR DISTRICT, UP
LAND USE LAND COVER AND NDVI OF MIRZAPUR DISTRICT, UP
RAHUL
 
Traditional Musical Instruments of Arunachal Pradesh and Uttar Pradesh - RAYH...
Traditional Musical Instruments of Arunachal Pradesh and Uttar Pradesh - RAYH...Traditional Musical Instruments of Arunachal Pradesh and Uttar Pradesh - RAYH...
Traditional Musical Instruments of Arunachal Pradesh and Uttar Pradesh - RAYH...
imrankhan141184
 
C1 Rubenstein AP HuG xxxxxxxxxxxxxx.pptx
C1 Rubenstein AP HuG xxxxxxxxxxxxxx.pptxC1 Rubenstein AP HuG xxxxxxxxxxxxxx.pptx
C1 Rubenstein AP HuG xxxxxxxxxxxxxx.pptx
mulvey2
 
math operations ued in python and all used
math operations ued in python and all usedmath operations ued in python and all used
math operations ued in python and all used
ssuser13ffe4
 
Mule event processing models | MuleSoft Mysore Meetup #47
Mule event processing models | MuleSoft Mysore Meetup #47Mule event processing models | MuleSoft Mysore Meetup #47
Mule event processing models | MuleSoft Mysore Meetup #47
MysoreMuleSoftMeetup
 
How to deliver Powerpoint Presentations.pptx
How to deliver Powerpoint  Presentations.pptxHow to deliver Powerpoint  Presentations.pptx
How to deliver Powerpoint Presentations.pptx
HajraNaeem15
 
BÀI TẬP DẠY THÊM TIẾNG ANH LỚP 7 CẢ NĂM FRIENDS PLUS SÁCH CHÂN TRỜI SÁNG TẠO ...
BÀI TẬP DẠY THÊM TIẾNG ANH LỚP 7 CẢ NĂM FRIENDS PLUS SÁCH CHÂN TRỜI SÁNG TẠO ...BÀI TẬP DẠY THÊM TIẾNG ANH LỚP 7 CẢ NĂM FRIENDS PLUS SÁCH CHÂN TRỜI SÁNG TẠO ...
BÀI TẬP DẠY THÊM TIẾNG ANH LỚP 7 CẢ NĂM FRIENDS PLUS SÁCH CHÂN TRỜI SÁNG TẠO ...
Nguyen Thanh Tu Collection
 
IGCSE Biology Chapter 14- Reproduction in Plants.pdf
IGCSE Biology Chapter 14- Reproduction in Plants.pdfIGCSE Biology Chapter 14- Reproduction in Plants.pdf
IGCSE Biology Chapter 14- Reproduction in Plants.pdf
Amin Marwan
 
Hindi varnamala | hindi alphabet PPT.pdf
Hindi varnamala | hindi alphabet PPT.pdfHindi varnamala | hindi alphabet PPT.pdf
Hindi varnamala | hindi alphabet PPT.pdf
Dr. Mulla Adam Ali
 
Chapter wise All Notes of First year Basic Civil Engineering.pptx
Chapter wise All Notes of First year Basic Civil Engineering.pptxChapter wise All Notes of First year Basic Civil Engineering.pptx
Chapter wise All Notes of First year Basic Civil Engineering.pptx
Denish Jangid
 
Bed Making ( Introduction, Purpose, Types, Articles, Scientific principles, N...
Bed Making ( Introduction, Purpose, Types, Articles, Scientific principles, N...Bed Making ( Introduction, Purpose, Types, Articles, Scientific principles, N...
Bed Making ( Introduction, Purpose, Types, Articles, Scientific principles, N...
Leena Ghag-Sakpal
 
ANATOMY AND BIOMECHANICS OF HIP JOINT.pdf
ANATOMY AND BIOMECHANICS OF HIP JOINT.pdfANATOMY AND BIOMECHANICS OF HIP JOINT.pdf
ANATOMY AND BIOMECHANICS OF HIP JOINT.pdf
Priyankaranawat4
 
Leveraging Generative AI to Drive Nonprofit Innovation
Leveraging Generative AI to Drive Nonprofit InnovationLeveraging Generative AI to Drive Nonprofit Innovation
Leveraging Generative AI to Drive Nonprofit Innovation
TechSoup
 
Advanced Java[Extra Concepts, Not Difficult].docx
Advanced Java[Extra Concepts, Not Difficult].docxAdvanced Java[Extra Concepts, Not Difficult].docx
Advanced Java[Extra Concepts, Not Difficult].docx
adhitya5119
 
The basics of sentences session 6pptx.pptx
The basics of sentences session 6pptx.pptxThe basics of sentences session 6pptx.pptx
The basics of sentences session 6pptx.pptx
heathfieldcps1
 
Pengantar Penggunaan Flutter - Dart programming language1.pptx
Pengantar Penggunaan Flutter - Dart programming language1.pptxPengantar Penggunaan Flutter - Dart programming language1.pptx
Pengantar Penggunaan Flutter - Dart programming language1.pptx
Fajar Baskoro
 
BÀI TẬP BỔ TRỢ TIẾNG ANH 8 CẢ NĂM - GLOBAL SUCCESS - NĂM HỌC 2023-2024 (CÓ FI...
BÀI TẬP BỔ TRỢ TIẾNG ANH 8 CẢ NĂM - GLOBAL SUCCESS - NĂM HỌC 2023-2024 (CÓ FI...BÀI TẬP BỔ TRỢ TIẾNG ANH 8 CẢ NĂM - GLOBAL SUCCESS - NĂM HỌC 2023-2024 (CÓ FI...
BÀI TẬP BỔ TRỢ TIẾNG ANH 8 CẢ NĂM - GLOBAL SUCCESS - NĂM HỌC 2023-2024 (CÓ FI...
Nguyen Thanh Tu Collection
 
ZK on Polkadot zero knowledge proofs - sub0.pptx
ZK on Polkadot zero knowledge proofs - sub0.pptxZK on Polkadot zero knowledge proofs - sub0.pptx
ZK on Polkadot zero knowledge proofs - sub0.pptx
dot55audits
 
বাংলাদেশ অর্থনৈতিক সমীক্ষা (Economic Review) ২০২৪ UJS App.pdf
বাংলাদেশ অর্থনৈতিক সমীক্ষা (Economic Review) ২০২৪ UJS App.pdfবাংলাদেশ অর্থনৈতিক সমীক্ষা (Economic Review) ২০২৪ UJS App.pdf
বাংলাদেশ অর্থনৈতিক সমীক্ষা (Economic Review) ২০২৪ UJS App.pdf
eBook.com.bd (প্রয়োজনীয় বাংলা বই)
 

Recently uploaded (20)

คำศัพท์ คำพื้นฐานการอ่าน ภาษาอังกฤษ ระดับชั้น ม.1
คำศัพท์ คำพื้นฐานการอ่าน ภาษาอังกฤษ ระดับชั้น ม.1คำศัพท์ คำพื้นฐานการอ่าน ภาษาอังกฤษ ระดับชั้น ม.1
คำศัพท์ คำพื้นฐานการอ่าน ภาษาอังกฤษ ระดับชั้น ม.1
 
LAND USE LAND COVER AND NDVI OF MIRZAPUR DISTRICT, UP
LAND USE LAND COVER AND NDVI OF MIRZAPUR DISTRICT, UPLAND USE LAND COVER AND NDVI OF MIRZAPUR DISTRICT, UP
LAND USE LAND COVER AND NDVI OF MIRZAPUR DISTRICT, UP
 
Traditional Musical Instruments of Arunachal Pradesh and Uttar Pradesh - RAYH...
Traditional Musical Instruments of Arunachal Pradesh and Uttar Pradesh - RAYH...Traditional Musical Instruments of Arunachal Pradesh and Uttar Pradesh - RAYH...
Traditional Musical Instruments of Arunachal Pradesh and Uttar Pradesh - RAYH...
 
C1 Rubenstein AP HuG xxxxxxxxxxxxxx.pptx
C1 Rubenstein AP HuG xxxxxxxxxxxxxx.pptxC1 Rubenstein AP HuG xxxxxxxxxxxxxx.pptx
C1 Rubenstein AP HuG xxxxxxxxxxxxxx.pptx
 
math operations ued in python and all used
math operations ued in python and all usedmath operations ued in python and all used
math operations ued in python and all used
 
Mule event processing models | MuleSoft Mysore Meetup #47
Mule event processing models | MuleSoft Mysore Meetup #47Mule event processing models | MuleSoft Mysore Meetup #47
Mule event processing models | MuleSoft Mysore Meetup #47
 
How to deliver Powerpoint Presentations.pptx
How to deliver Powerpoint  Presentations.pptxHow to deliver Powerpoint  Presentations.pptx
How to deliver Powerpoint Presentations.pptx
 
BÀI TẬP DẠY THÊM TIẾNG ANH LỚP 7 CẢ NĂM FRIENDS PLUS SÁCH CHÂN TRỜI SÁNG TẠO ...
BÀI TẬP DẠY THÊM TIẾNG ANH LỚP 7 CẢ NĂM FRIENDS PLUS SÁCH CHÂN TRỜI SÁNG TẠO ...BÀI TẬP DẠY THÊM TIẾNG ANH LỚP 7 CẢ NĂM FRIENDS PLUS SÁCH CHÂN TRỜI SÁNG TẠO ...
BÀI TẬP DẠY THÊM TIẾNG ANH LỚP 7 CẢ NĂM FRIENDS PLUS SÁCH CHÂN TRỜI SÁNG TẠO ...
 
IGCSE Biology Chapter 14- Reproduction in Plants.pdf
IGCSE Biology Chapter 14- Reproduction in Plants.pdfIGCSE Biology Chapter 14- Reproduction in Plants.pdf
IGCSE Biology Chapter 14- Reproduction in Plants.pdf
 
Hindi varnamala | hindi alphabet PPT.pdf
Hindi varnamala | hindi alphabet PPT.pdfHindi varnamala | hindi alphabet PPT.pdf
Hindi varnamala | hindi alphabet PPT.pdf
 
Chapter wise All Notes of First year Basic Civil Engineering.pptx
Chapter wise All Notes of First year Basic Civil Engineering.pptxChapter wise All Notes of First year Basic Civil Engineering.pptx
Chapter wise All Notes of First year Basic Civil Engineering.pptx
 
Bed Making ( Introduction, Purpose, Types, Articles, Scientific principles, N...
Bed Making ( Introduction, Purpose, Types, Articles, Scientific principles, N...Bed Making ( Introduction, Purpose, Types, Articles, Scientific principles, N...
Bed Making ( Introduction, Purpose, Types, Articles, Scientific principles, N...
 
ANATOMY AND BIOMECHANICS OF HIP JOINT.pdf
ANATOMY AND BIOMECHANICS OF HIP JOINT.pdfANATOMY AND BIOMECHANICS OF HIP JOINT.pdf
ANATOMY AND BIOMECHANICS OF HIP JOINT.pdf
 
Leveraging Generative AI to Drive Nonprofit Innovation
Leveraging Generative AI to Drive Nonprofit InnovationLeveraging Generative AI to Drive Nonprofit Innovation
Leveraging Generative AI to Drive Nonprofit Innovation
 
Advanced Java[Extra Concepts, Not Difficult].docx
Advanced Java[Extra Concepts, Not Difficult].docxAdvanced Java[Extra Concepts, Not Difficult].docx
Advanced Java[Extra Concepts, Not Difficult].docx
 
The basics of sentences session 6pptx.pptx
The basics of sentences session 6pptx.pptxThe basics of sentences session 6pptx.pptx
The basics of sentences session 6pptx.pptx
 
Pengantar Penggunaan Flutter - Dart programming language1.pptx
Pengantar Penggunaan Flutter - Dart programming language1.pptxPengantar Penggunaan Flutter - Dart programming language1.pptx
Pengantar Penggunaan Flutter - Dart programming language1.pptx
 
BÀI TẬP BỔ TRỢ TIẾNG ANH 8 CẢ NĂM - GLOBAL SUCCESS - NĂM HỌC 2023-2024 (CÓ FI...
BÀI TẬP BỔ TRỢ TIẾNG ANH 8 CẢ NĂM - GLOBAL SUCCESS - NĂM HỌC 2023-2024 (CÓ FI...BÀI TẬP BỔ TRỢ TIẾNG ANH 8 CẢ NĂM - GLOBAL SUCCESS - NĂM HỌC 2023-2024 (CÓ FI...
BÀI TẬP BỔ TRỢ TIẾNG ANH 8 CẢ NĂM - GLOBAL SUCCESS - NĂM HỌC 2023-2024 (CÓ FI...
 
ZK on Polkadot zero knowledge proofs - sub0.pptx
ZK on Polkadot zero knowledge proofs - sub0.pptxZK on Polkadot zero knowledge proofs - sub0.pptx
ZK on Polkadot zero knowledge proofs - sub0.pptx
 
বাংলাদেশ অর্থনৈতিক সমীক্ষা (Economic Review) ২০২৪ UJS App.pdf
বাংলাদেশ অর্থনৈতিক সমীক্ষা (Economic Review) ২০২৪ UJS App.pdfবাংলাদেশ অর্থনৈতিক সমীক্ষা (Economic Review) ২০২৪ UJS App.pdf
বাংলাদেশ অর্থনৈতিক সমীক্ষা (Economic Review) ২০২৪ UJS App.pdf
 

25 UV-Visible.pptx

  • 1. Ultraviolet and visible light Spectroscopy (UV-Visible Spectroscopy) Presented by Mr. Kamble Sainath Hanmant Assistant Professor Department of Microbiology D.B.F. Dayanand College of Arts and Science, Solapur
  • 2. Spectroscopy is the a technique that measures absorption and transmission of light waves by chemical compounds and biological molecules like DNA and proteins. Light is an electromagnetic radiation having different wavelength. Based on wavelength light is divided into three types – 1) Ultraviolet light (10 nm to 400 nm) 2) Visible light (400 nm to 700 nm) 3) Infrared light (700 to 1 mm) Electromagnetic radiation before 180 nm and after 5000 nm not considered as light. The UV light is divided in three types based on wavelength as 1) UV-C (100-280 nm) 2) UV-B (280-315 nm) 3) UV-A (315-400 nm) Principle
  • 3.
  • 4.
  • 5. When the light waves pass through a chemical compounds , then electrons from an atoms of these compounds moves from lower energy state to higher energy state or Vice-versa and absorbe or emit light waves specific wavelength. Molecular in the chemical compounds which interaction with electromagnetic radiation and absorbe or emit specific light wavelength are called as chromophores. In UV-Visible spectroscopy technique based absorption or Transmission of Ultraviolet light and visible light wavelength by chemical compounds. The instument In known as UV-Visible spectrophotometer.  For UV-Visible spectroscopy liquid samples of are used by dissolving chemical compounds in Water or suitable Solvents.
  • 6. Beer–Lambert law Measurement of light absorption or transmission in UV-Visible spectroscopy is based on Beer–Lambert law. By this law the chance photon to be absorbed by matter is given by an extinction coefficient which itself is dependent on the wavelength of the photon.  If light with the intensity I0 passes through a sample with appropriate transparency and the path length (thickness) d, the intensity I drops along the pathway in an exponential manner.
  • 7. If light with the intensity I0 passes through a sample with appropriate transparency and the path length (thickness) d, the intensity I drops along the pathway in an exponential manner. The characteristic absorption parameter for the sample is the extinction coefficient ‘α’ yielding the correlation as equations given below. I = I0 ε α d T= I/I0 α = Extinction coefficient I0 = Initial intensity of Light I = Intensity of light after absorption or transmission T = Transmission.
  • 8. Biochemical samples usually comprise aqueous solutions, where the substance of interest is present at a molar concentration ‘c’ . Algebraic transformation of the exponential correlation into an expression based on the decadic logarithm yields the Beer–Lambert law as an equation below – where d = 1cm, c = 1 mol dm-3, and ε = 1 dm-3 mol-1 cm-1 ε = Molar absorption coefficient α = Molar extinction coefficient (α = 2.303 x c x ε). A = Absorbance of the sample
  • 9. Instrumentation and Methodology 1) Light Source In the UV-Visible spectroscopy the source of UV-light is Hydrogen-Deuterium lamps which covers the wavelength of 180 nm to 400 nm. While the source of visible light is Tungsten filament lamps which covers the wavelength of 400 nm to 700 nm.  The light from these two lamps then fall on to mirror and then reflected and pass through a slit as beam which enters in to prism.
  • 11. 2) Monochromator Since the emitted light consists of many different wavelengths, a monochromator is used to split light in different wavelength and select specific wavelength. Monochromators generally is composed of prisms and slits. When light from source pass through prism it separates into various wavelengh A rotating metal grid of high precision called grating is also used as monochromator in some spectrophotometers. Specific light wavelength for analysis then selected for by the slits after prism.
  • 12. Samples are typically placed in a test like transparent cell known as a cuvette made up of Quartz or Silica. This cuvette filled with liquid sample and placed is holder called Sample cell. Another cuvette filled with reference solution or Standard which contains only solvent without sample is placed in holder called reference cell. A spectrophotometer can be either single beam or double beam. In a single beam all of the light passes through only sample cell. It has no reference cell. In a double-beam instrument, the light is split into two beams by mirros and then one beam pass through the Sample cell and other beam reference cell. 3) Sample and reference cells
  • 13. 4) Detector Light waves of specific wavelength emitted or transmitted from sample cell and reference then fall on the mirrors and pass through beam selectors towords detectors.  Generally two photocells are used as detector which receives beams from sample and reference cell. The intensity of the radiation from the reference cell is stronger than the beam of sample cell. This results in the generation of pulsating or alternating currents in the photocells.
  • 14. 5) Amplifier The alternating current generated in the photocells is transferred to the amplifier. Generally current generated in the photocells is of very low intensity, the main purpose of amplifier is to amplify the signals many times so we can get clear and recordable signals. 6) Recording devices Most of the time amplifier is coupled to a pen recorder which is connected to the computer. Computer stores all the data generated and produces the spectrum of the desired compound as peak graph .
  • 15. Procedure 1) The sample solution is filled in cuvette and placed sample cell holder 2) The standard reference solution filled in cuvette and placed in reference cell holder. 3) Then a UV-Visible wavelength scan is done from 180 nm to 1100 nm by using computer software . 4) After scan spectra is generated from which specific wavelength which is absorbed maximum by sample observed which is known as absorption maxima.
  • 16. 5) For finding unknown sample concentration various sample concentration like (1 mg/ml to 5mg/ml) taken in cuvette and absorbance is observed at absorption maxima. 6) Then graph is platted as Sample concentration on X - axis and Absorbance at Y axis. 7) The absorbance of sample with unknown conc. is measured and conc. is obtained by standard graph.
  • 17. UV-Visible spectroscopy analysis of bacterial melanin
  • 18. It is used for detection of impurities from various chemicals, drugs, biological meolecules in chemicals and pharma industries. It is usedin the structure elucidation of organic molecules, such as in detecting the presence or absence of unsaturation, the presence of hetero atoms. It can be used for the quantitative estimation of compounds that absorb UV radiation like DNA, RNA proteins and carbohydrates in industries and in research filed. It can be used to study enzyme activity by estimating product and substrate concentrations. Applications