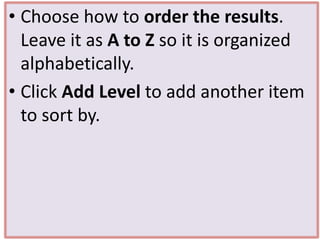
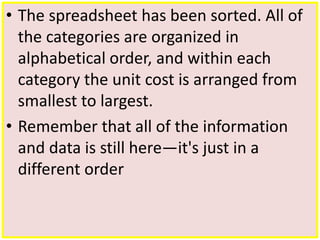
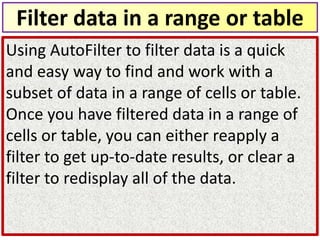
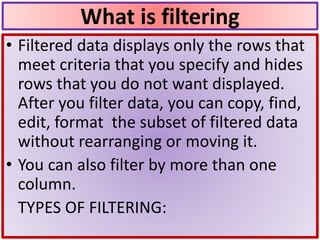
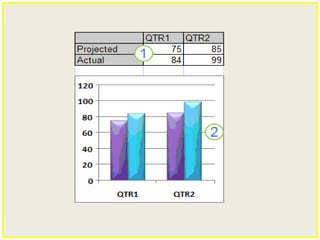
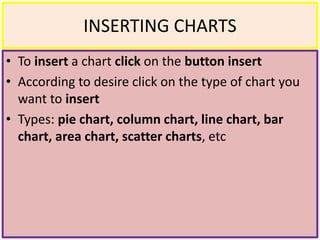
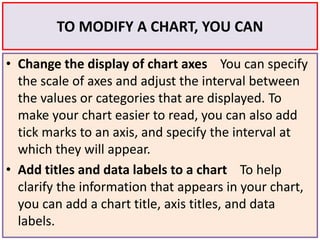
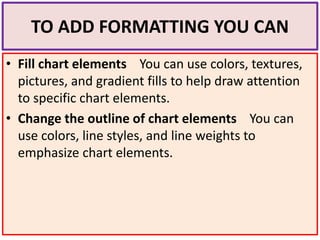
THIS IS A POWERPOINT PRESENTATION ON THE YOPIC PIVOT TABLES IN MS EXCEL.
I GOT TO PREPARE A PROJECT ON THE TOPIC IN MY ICITSS- ITT TRAINING CONDUCTED BY ICAI UNDER CA COURSE.
THIS IS A POWERPOINT PRESENTATION ON THE YOPIC PIVOT TABLES IN MS EXCEL.
I GOT TO PREPARE A PROJECT ON THE TOPIC IN MY ICITSS- ITT TRAINING CONDUCTED BY ICAI UNDER CA COURSE.
From this power point you can get the details about Advanced Filter, Use of Macros with Advanced Filter, Data Validation, Creation of data validation Drop-Down List, Handling of External Data, Goal Seek, What-if analysis,
Presentation is about advance excel advance feature PIVOT Table and contains steps to insert pivot table and some useful features of pivot table in case of large amount of data
Microsoft Access is a database management system from Microsoft that combines the relational Access Database Engine with a graphical user interface and software-development tools. It is a member of the Microsoft 365 suite of applications, included in the Professional and higher editions or sold separately.
NCompass Live - Aug. 22, 2018
http://nlc.nebraska.gov/ncompasslive/
Microsoft Excel has a variety of uses in the library world from keeping track of budgets or managing program registrations to viewing circulation or collection statistics. Learn some hints and tips for working with already existing spreadsheets as well as building your own. We’ll also take a look at Google Sheets and see how that compares with Excel.
Presenter: Megan Boggs, Seward (NE) Memorial Library.
L9 using datawarrior for scientific data visualizationSeppo Karrila
A tutorial for beginning graduate students on data visualization, by hands-on training in using DataWarrior. These are only handout notes so the students can try things out on their own laptops, with the free software, instead of scribbling notes themselves. The instructor needs to demonstrate the options or functions listed in the handout notes.
Palestine last event orientationfvgnh .pptxRaedMohamed3
An EFL lesson about the current events in Palestine. It is intended to be for intermediate students who wish to increase their listening skills through a short lesson in power point.
We all have good and bad thoughts from time to time and situation to situation. We are bombarded daily with spiraling thoughts(both negative and positive) creating all-consuming feel , making us difficult to manage with associated suffering. Good thoughts are like our Mob Signal (Positive thought) amidst noise(negative thought) in the atmosphere. Negative thoughts like noise outweigh positive thoughts. These thoughts often create unwanted confusion, trouble, stress and frustration in our mind as well as chaos in our physical world. Negative thoughts are also known as “distorted thinking”.
Students, digital devices and success - Andreas Schleicher - 27 May 2024..pptxEduSkills OECD
Andreas Schleicher presents at the OECD webinar ‘Digital devices in schools: detrimental distraction or secret to success?’ on 27 May 2024. The presentation was based on findings from PISA 2022 results and the webinar helped launch the PISA in Focus ‘Managing screen time: How to protect and equip students against distraction’ https://www.oecd-ilibrary.org/education/managing-screen-time_7c225af4-en and the OECD Education Policy Perspective ‘Students, digital devices and success’ can be found here - https://oe.cd/il/5yV
Read| The latest issue of The Challenger is here! We are thrilled to announce that our school paper has qualified for the NATIONAL SCHOOLS PRESS CONFERENCE (NSPC) 2024. Thank you for your unwavering support and trust. Dive into the stories that made us stand out!
Unit 8 - Information and Communication Technology (Paper I).pdfThiyagu K
This slides describes the basic concepts of ICT, basics of Email, Emerging Technology and Digital Initiatives in Education. This presentations aligns with the UGC Paper I syllabus.
2024.06.01 Introducing a competency framework for languag learning materials ...Sandy Millin
http://sandymillin.wordpress.com/iateflwebinar2024
Published classroom materials form the basis of syllabuses, drive teacher professional development, and have a potentially huge influence on learners, teachers and education systems. All teachers also create their own materials, whether a few sentences on a blackboard, a highly-structured fully-realised online course, or anything in between. Despite this, the knowledge and skills needed to create effective language learning materials are rarely part of teacher training, and are mostly learnt by trial and error.
Knowledge and skills frameworks, generally called competency frameworks, for ELT teachers, trainers and managers have existed for a few years now. However, until I created one for my MA dissertation, there wasn’t one drawing together what we need to know and do to be able to effectively produce language learning materials.
This webinar will introduce you to my framework, highlighting the key competencies I identified from my research. It will also show how anybody involved in language teaching (any language, not just English!), teacher training, managing schools or developing language learning materials can benefit from using the framework.
This is a presentation by Dada Robert in a Your Skill Boost masterclass organised by the Excellence Foundation for South Sudan (EFSS) on Saturday, the 25th and Sunday, the 26th of May 2024.
He discussed the concept of quality improvement, emphasizing its applicability to various aspects of life, including personal, project, and program improvements. He defined quality as doing the right thing at the right time in the right way to achieve the best possible results and discussed the concept of the "gap" between what we know and what we do, and how this gap represents the areas we need to improve. He explained the scientific approach to quality improvement, which involves systematic performance analysis, testing and learning, and implementing change ideas. He also highlighted the importance of client focus and a team approach to quality improvement.
The Roman Empire A Historical Colossus.pdfkaushalkr1407
The Roman Empire, a vast and enduring power, stands as one of history's most remarkable civilizations, leaving an indelible imprint on the world. It emerged from the Roman Republic, transitioning into an imperial powerhouse under the leadership of Augustus Caesar in 27 BCE. This transformation marked the beginning of an era defined by unprecedented territorial expansion, architectural marvels, and profound cultural influence.
The empire's roots lie in the city of Rome, founded, according to legend, by Romulus in 753 BCE. Over centuries, Rome evolved from a small settlement to a formidable republic, characterized by a complex political system with elected officials and checks on power. However, internal strife, class conflicts, and military ambitions paved the way for the end of the Republic. Julius Caesar’s dictatorship and subsequent assassination in 44 BCE created a power vacuum, leading to a civil war. Octavian, later Augustus, emerged victorious, heralding the Roman Empire’s birth.
Under Augustus, the empire experienced the Pax Romana, a 200-year period of relative peace and stability. Augustus reformed the military, established efficient administrative systems, and initiated grand construction projects. The empire's borders expanded, encompassing territories from Britain to Egypt and from Spain to the Euphrates. Roman legions, renowned for their discipline and engineering prowess, secured and maintained these vast territories, building roads, fortifications, and cities that facilitated control and integration.
The Roman Empire’s society was hierarchical, with a rigid class system. At the top were the patricians, wealthy elites who held significant political power. Below them were the plebeians, free citizens with limited political influence, and the vast numbers of slaves who formed the backbone of the economy. The family unit was central, governed by the paterfamilias, the male head who held absolute authority.
Culturally, the Romans were eclectic, absorbing and adapting elements from the civilizations they encountered, particularly the Greeks. Roman art, literature, and philosophy reflected this synthesis, creating a rich cultural tapestry. Latin, the Roman language, became the lingua franca of the Western world, influencing numerous modern languages.
Roman architecture and engineering achievements were monumental. They perfected the arch, vault, and dome, constructing enduring structures like the Colosseum, Pantheon, and aqueducts. These engineering marvels not only showcased Roman ingenuity but also served practical purposes, from public entertainment to water supply.
2. SORTING AND FILTERING
A Microsoft Excel spreadsheet can contain a great
deal of information. Sometimes you may find that
you need to reorder or sort that information, create
groups, or filter information to be able to use it most
effectively
3. SORTING
Sorting lists is a common spreadsheet task that
allows you to easily re-order your data. The most
common type of sorting is alphabetical ordering,
which you can do in ascending or descending order.
4. To sort in alphabetical order
• Select a cell in the column you want to sort (In this
example, we choose a cell in column A).
• Click the Sort & Filter command in
the Editing group on the Home tab.
• Select Sort A to Z. Now the information in the
Category column is organized in alphabetical order.
5. • You can Sort in reverse alphabetical order by
choosing Sort Z to A in the list
6. TO SORT FROM SMALLEST TO
LARGEST
• Select a cell in the column you want to sort (a
column with numbers).
• Click the Sort & Filter command in
the Editing group on the Home tab.
• Select From Smallest to Largest. Now the
information is organized from the smallest to
largest amount.
• You can sort in reverse numerical order by
choosing From Largest to Smallest in the list.
7. TO SORT MULTIPLE LEVELS
• Click the Sort & Filter command in
the Editing group on the Home tab.
• Select Custom Sort from the list to open the dialog
box.
• Select the Data tab.
• Locate the Sort and Filter group.
• Click the Sort command to open the Custom
Sort dialog box. From here, you can sort by one
item or multiple items.
8. Click the drop-down arrow in the Column Sort
by field, then choose one of the options—in this
example, Category.
9. • Choose what to sort on. In this example, we'll
leave the default as Value.
10. • Choose how to order the results.
Leave it as A to Z so it is organized
alphabetically.
• Click Add Level to add another item
to sort by.
11. • The spreadsheet has been sorted. All of
the categories are organized in
alphabetical order, and within each
category the unit cost is arranged from
smallest to largest.
• Remember that all of the information
and data is still here—it's just in a
different order
12. Filter data in a range or table
Using AutoFilter to filter data is a quick
and easy way to find and work with a
subset of data in a range of cells or table.
Once you have filtered data in a range of
cells or table, you can either reapply a
filter to get up-to-date results, or clear a
filter to redisplay all of the data.
13. What is filtering
• Filtered data displays only the rows that
meet criteria that you specify and hides
rows that you do not want displayed.
After you filter data, you can copy, find,
edit, format the subset of filtered data
without rearranging or moving it.
• You can also filter by more than one
column.
TYPES OF FILTERING:
14. Auto Filter
Using AutoFilter, you can create
three types of filters: by a list
values, by a format, or by criteria.
you can filter by cell color or by a
list of numbers. you can filter by
icon
15. Range of cells
• Select a range of cells containing alphanumeric
data.
• On the Data tab, in the Sort & Filter group,
click Filter.
16. Select from a list of text values
• In the list of text values, select or clear one or
more text values to filter by.
• The list of text values can be up to 10,000. If the
list is large, clear (Select All) at the top, and then
select the specific text values to filter by.
• To make the AutoFilter menu wider or longer, click
and drag the grip handle at the bottom.
17. LEARN ABOUT CHARTS
• Charts are used to display series of numeric data
in a graphical format to make it easier to
understand large quantities of data and the
relationship between different series of data.
• To create a chart in Excel, you start by entering the
numeric data for the chart on a worksheet. Then
you can plot that data into a chart by selecting the
chart type that you want to use on the Office
Fluent Ribbon (Insert tab, Charts group).
18.
19. INSERTING CHARTS
• To insert a chart click on the button insert
• According to desire click on the type of chart you
want to insert
• Types: pie chart, column chart, line chart, bar
chart, area chart, scatter charts, etc
20. TO MODIFY A CHART, YOU CAN
• Change the display of chart axes You can specify
the scale of axes and adjust the interval between
the values or categories that are displayed. To
make your chart easier to read, you can also add
tick marks to an axis, and specify the interval at
which they will appear.
• Add titles and data labels to a chart To help
clarify the information that appears in your chart,
you can add a chart title, axis titles, and data
labels.
21. TO ADD FORMATTING YOU CAN
• Fill chart elements You can use colors, textures,
pictures, and gradient fills to help draw attention
to specific chart elements.
• Change the outline of chart elements You can
use colors, line styles, and line weights to
emphasize chart elements.
22. • Add special effects to chart elements You can
apply special effects, such as shadow, reflection,
glow, soft edges and 3-D rotation to chart element
shapes, which gives your chart a finished look.