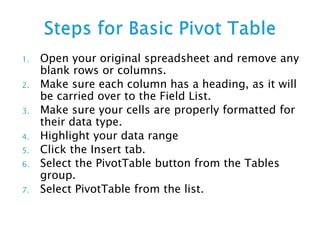
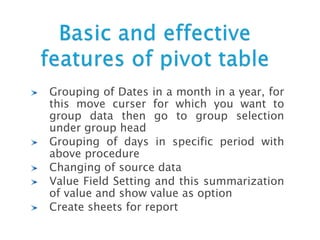
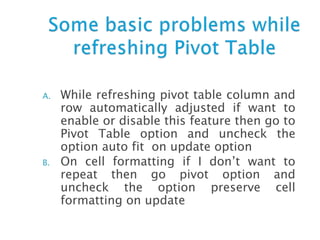
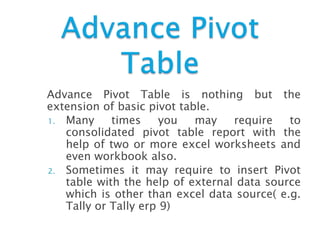
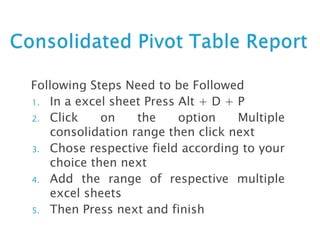
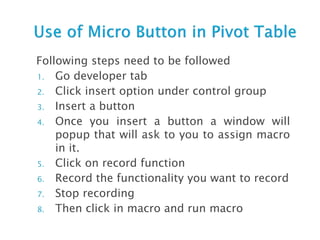
1. What is Pivot table
2. Division of Pivot Table
3. How to insert Basic Pivot Table
4. Pivot table with the help of client
data
5. Effective features of Pivot Table
6. Problems while refreshing the
Pivot Table
7. Advance Pivot Table
8. Steps for consolidated Pivot
Table
Starting from Zero level
Q.1 Why do we call this table Pivot Table.
Ans. As typical dictionary meaning “Pivot”
means a center pointmid point. That
means a one single center point have an
look on large whole area.
Exactly the pivot table is this. It is a one
table have a summarized look on a large
data.
 Excel’s Pivot Table is useful and time-
saving tool for analyzing data in table
format.
 In a Simple word pivot table is a user-
created summary table of original data.
 In which user can easily analyze and use
data according to their requirement
Basic Pivot
Table
Advance
Pivot Table
1. Open your original spreadsheet and remove any
blank rows or columns.
2. Make sure each column has a heading, as it will
be carried over to the Field List.
3. Make sure your cells are properly formatted for
their data type.
4. Highlight your data range
5. Click the Insert tab.
6. Select the PivotTable button from the Tables
group.
7. Select PivotTable from the list.
Grouping of Dates in a month in a year, for
this move curser for which you want to
group data then go to group selection
under group head
Grouping of days in specific period with
above procedure
Changing of source data
Value Field Setting and this summarization
of value and show value as option
Create sheets for report
A. While refreshing pivot table column and
row automatically adjusted if want to
enable or disable this feature then go to
Pivot Table option and uncheck the
option auto fit on update option
B. On cell formatting if I don’t want to
repeat then go pivot option and
uncheck the option preserve cell
formatting on update
Advance Pivot Table is nothing but the
extension of basic pivot table.
1. Many times you may require to
consolidated pivot table report with the
help of two or more excel worksheets and
even workbook also.
2. Sometimes it may require to insert Pivot
table with the help of external data source
which is other than excel data source( e.g.
Tally or Tally erp 9)
Following Steps Need to be Followed
1. In a excel sheet Press Alt + D + P
2. Click on the option Multiple
consolidation range then click next
3. Chose respective field according to your
choice then next
4. Add the range of respective multiple
excel sheets
5. Then Press next and finish
Following steps need to be followed
1. Go developer tab
2. Click insert option under control group
3. Insert a button
4. Once you insert a button a window will
popup that will ask to you to assign macro
in it.
5. Click on record function
6. Record the functionality you want to record
7. Stop recording
8. Then click in macro and run macro

Ppt on pivot table

  • 2.
    1. What isPivot table 2. Division of Pivot Table 3. How to insert Basic Pivot Table 4. Pivot table with the help of client data 5. Effective features of Pivot Table 6. Problems while refreshing the Pivot Table 7. Advance Pivot Table 8. Steps for consolidated Pivot Table
  • 3.
    Starting from Zerolevel Q.1 Why do we call this table Pivot Table. Ans. As typical dictionary meaning “Pivot” means a center pointmid point. That means a one single center point have an look on large whole area. Exactly the pivot table is this. It is a one table have a summarized look on a large data.
  • 4.
     Excel’s PivotTable is useful and time- saving tool for analyzing data in table format.  In a Simple word pivot table is a user- created summary table of original data.  In which user can easily analyze and use data according to their requirement
  • 5.
  • 6.
    1. Open youroriginal spreadsheet and remove any blank rows or columns. 2. Make sure each column has a heading, as it will be carried over to the Field List. 3. Make sure your cells are properly formatted for their data type. 4. Highlight your data range 5. Click the Insert tab. 6. Select the PivotTable button from the Tables group. 7. Select PivotTable from the list.
  • 7.
    Grouping of Datesin a month in a year, for this move curser for which you want to group data then go to group selection under group head Grouping of days in specific period with above procedure Changing of source data Value Field Setting and this summarization of value and show value as option Create sheets for report
  • 8.
    A. While refreshingpivot table column and row automatically adjusted if want to enable or disable this feature then go to Pivot Table option and uncheck the option auto fit on update option B. On cell formatting if I don’t want to repeat then go pivot option and uncheck the option preserve cell formatting on update
  • 9.
    Advance Pivot Tableis nothing but the extension of basic pivot table. 1. Many times you may require to consolidated pivot table report with the help of two or more excel worksheets and even workbook also. 2. Sometimes it may require to insert Pivot table with the help of external data source which is other than excel data source( e.g. Tally or Tally erp 9)
  • 10.
    Following Steps Needto be Followed 1. In a excel sheet Press Alt + D + P 2. Click on the option Multiple consolidation range then click next 3. Chose respective field according to your choice then next 4. Add the range of respective multiple excel sheets 5. Then Press next and finish
  • 11.
    Following steps needto be followed 1. Go developer tab 2. Click insert option under control group 3. Insert a button 4. Once you insert a button a window will popup that will ask to you to assign macro in it. 5. Click on record function 6. Record the functionality you want to record 7. Stop recording 8. Then click in macro and run macro